Rosalina Palanca-Tan*![]() | Daniel del Barrio Alvarez
| Daniel del Barrio Alvarez![]() | Ruth S. Palanca
| Ruth S. Palanca![]() | Nelson Matthew P. Tan
| Nelson Matthew P. Tan![]() | Gem B. Castillo
| Gem B. Castillo![]() | Dino Carlo A. Saplala
| Dino Carlo A. Saplala![]() | Nan Wang
| Nan Wang![]()
© 2024 The authors. This article is published by IIETA and is licensed under the CC BY 4.0 license (http://creativecommons.org/licenses/by/4.0/).
OPEN ACCESS
Using a choice-based conjoint analysis, we measured willingness to pay (WTP) for an increase in the share of specific Renewable Energy (RE) technologies, namely solar, wind, biomass, and small-scale hydropower. The study found that on average, Metro Manila (MM) households are WTP an additional 19.3% of their electricity bill for an additional 20% share of RE in electric power capacity that is sourced from solar power. The corresponding WTP for the other RE technologies are substantially lower – 11.9% for biomass, 10.5% for wind, and 9.8% for small-scale hydropower. The skewed preference for solar energy augurs well for the government’s updated RE plan which stipulates that the bulk of additional RE supply will be sourced from solar. The positive marginal WTP for new and unconventional RE technologies likewise provide demand-side evidence for a RE plan that is much less focused and dependent on geothermal and large-scale hydropower, the traditional RE sources in the Philippines. Further, the higher WTP for biomass over wind and small-scale hydropower reveals some scope for intensifying support for waste-to-energy projects and increasing the share of biomass in the RE mix. The findings from the study suggest the need for appropriate information campaigns to raise public awareness on the less known RE technologies and on the role of RE in Climate Change (CC) mitigation, and to direct these campaigns more on high income households with high electricity bills and on female household heads.
choice experiment, willingness to pay, renewable energy, solar, wind, biomass, small-scale hydropower, climate change mitigation
The Philippines has massive potential for renewable energy (RE)-vast water bodies with an estimated untapped hydropower potential of 13,097 MW; high quality geothermal resources with 4,407 MW of tapped and potential reserves; solar energy with an average daily insolation of 5 kWh per m2; around 10,000 sites identified to have an annual average wind power of at least 300 W/m2 capable of supporting at least 76,600 MW of installed capacity; several sources of biomass including agricultural wastes (rice husk and straw, bagasse cane, coconut and corn trash, animal wastes), energy crops (plant oils), forest residues, and municipal wastes; and a total of 73,710 hectares open for ocean energy development, with a theoretical capacity of 170,000 MW over a 1,000 km2 ocean resource area [1] as cited in the study of Palanca-Tan et al. [2]. The Philippine government intends to fully utilize this rich endowment of RE resources to achieve self-sufficiency and energy security [3] as well as to meet its carbon emissions reduction commitment in the Paris Agreement of 2015.
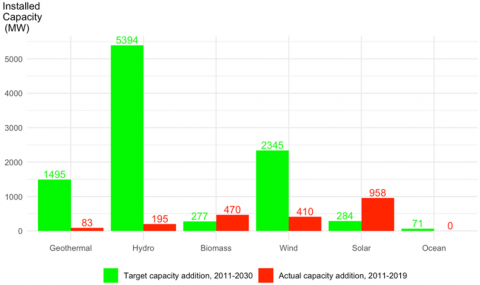
The Philippines’ National Renewable Energy Program 2011-2030 (NREP 2011-2030) is the first comprehensive document that outlines the country’s RE targets, action plans, and strategies. NREP 2011-2020 targeted to increase installed RE capacity to 15,304 MW in 2030, thrice 2010’s 5,438 MW [1]. Accomplishments for 2011-2019 revealed substantial drawbacks. Additional RE capacity was only 2,115 MW, a mere one-fifth of the 9,865 MW target for 2030. Total installed RE capacity as of 31 December 2019 was 7,399 MW, not even half of the 15,304 MW target for 2030. Figure 1 below shows target capacity addition in 2011-2030 vis a vis actual capacity addition in 2011-2019 for each RE technology. Solar and biomass, with the highest installed capacity additions in 2011-2019 of 958 MW and 470 MW, respectively, already exceeded their respective capacity addition targets for the entire program period 2011-2030 of 284 MW and 277MW. However, installed capacity additions in 2011-2019 for wind (410 MW), hydropower (195 MW), and geothermal (83 MW) were still way below their respective 2011-2030 targets of 2,345 MW, 5,394 MW, and 1,495 MW [4]. The Feed-in Tariff (FiT)-a mechanism that provides guaranteed fixed payments per kWh of electricity produced from emerging RE resources, priority connection to the main grid, and priority purchase, transmission and payment for RE electricity generation by grid system operators-is the main driver for solar, wind, and biomass power deployment.
Despite being covered by FiT, the uptake of run-of-river hydropower, an alternative to the highly opposed large-scale hydropower dams that can cause ecosystem damage, has been slow. Thus, the 3,760 MW installed capacity of hydropower at the end of 2019 was only marginally higher than its 3,400 MW installed capacity in 2010. In the case of geothermal, installed capacity even contracted slightly from 1,966 in 2010 to 1,928 MW in 2019. Geothermal project development has been sluggish as it is excluded from FiT, making geothermal developers more exposed to price uncertainties. Moreover, geothermal exploration and development is inherently costly and risky, with a long gestation period averaging 4-6 years and with just about 59% of drilled wells turning up to have sufficient resource for power generation [5].
Figure 1. RE-based target and actual capacity installation during NREP 2011-2019
Source of data: Table 1 [4]
In terms of actual power generation, the share of RE even decreased from 26% in 2010 to 21% in 2019. With the installed capacity of geothermal and hydropower, the main RE technologies, remaining almost the same as their 2010 levels, the increasing electricity demand in the country was met with coal power supply whose share in total power generation increased from 34% in 2010 to 55% in 2019 [6].
There had been serious hurdles to NREP 2011-2030. Between 2009-2019, the Philippine Department of Energy (DOE) approved 1,090 RE projects for a total installed RE capacity of 36,735 MW, more than twice the 15,304 MW target for 2030. However, only 17% or 183 projects were completed [4]. A major constraint to RE development was financing. Only major RE developers belonging to conglomerates could readily access loans as large banks were generally reluctant to lend to smaller independent power producers [5]. Large-scale RE investments, on the other hand, were hampered by capacity limitations of existing grid infrastructure and delays in grid expansion projects of the government, thereby delaying their commercial operations [7]. A factor that burdened both large and small RE developers was the lengthy and tedious permitting process [8]. Interviews with RE investors revealed that the permitting process could take up to three years because of the numerous permits and signatures required from different agencies, the varying interpretation of the rules by national and local government permitting offices, and changes in guidelines and policies [9].
Nonetheless, with the recent progress in the formulation and implementation of RE enabling policy mechanisms – the issuance of rules on Renewable Portfolio Standards (RPS) and Green Energy Option Program (GEOP) in 2017-2018, and the establishment of the Renewable Energy Market (REM) in 2019 [4], the Philippine government is hopeful to further advance its RE transition. In 2022, it updated its National Renewable Energy Program to NREP 2020-2040 where the targets have been calibrated to a RE share in the power generation mix of at least 35% by 2030, and at least 50% by 2040. NREP 2020-2040 presents the RE power supply expansion plan on a per technology basis. The 50% target share of RE in 2040 requires a total of 52,826 MW of new installed RE capacities, which are to be sourced from solar (27,162 MW), wind (16,650 MW), hydropower (6,150 MW), geothermal (2,500 MW), and biomass (364 MW) [4].
To realize this even more ambitious NREP 2020-2040 targets, with the bulk of the increase to be sourced from solar, followed by wind, and with much less dependence on the current primary RE sources (hydropower and geothermal), adequate understanding of people’s perceptions and preferences not only for RE, in general, but also for specific RE technologies [10-12], is crucial. As the 2020-2040 plan is largely based on supply efficiency considerations and on a top-down approach to program and policymaking, empirical evidence on demands for different RE technologies would be useful in coming up with effective implementation strategies. Further, the updated RE policy framework includes voluntary mechanisms, one of which is the GEOP, a provision that gives end-users or electricity buyers the option to choose RE technology from which their energy supply will come from (Section 9 Chapter III of RA 9513). Thus, specific RE technology deployment must closely match demand. Information on people’s preferences and demand for individual RE technologies will provide valuable inputs to the updated NREP 2020-2040’s Resource-Specific Programs (RSP), the plan’s component that will define the strategies to promote and develop specific RE resources and technologies.
In this study, a choice experiment survey was done to investigate Metro Manila (MM) households’ preferences for each of the RE technologies, relative to the current primary RE technologies – large-scale hydropower and geothermal. This paper presents survey results on knowledge and attitudes on different RE technologies and estimates of the WTP for increases in RE shares in electricity generation from each of the following RE types – solar, wind, small-scale hydropower, and biomass. The survey and the analysis in the paper will inform policymakers as to which RE technology would be most acceptable, and for which more information campaign must be undertaken to raise awareness and acceptance.
An earlier paper used the contingent valuation (CV) method to come up with an estimate of the WTP for an increase in the share of RE from 30% to 50% [2]. In that study, the RE technology to be utilized to realize the additional 20% share of RE in installed capacity for electric power generation was not specified. This study extends the analysis to WTP for each RE technology by employing the attribute-based choice experiment (CE) method, a stated-preference technique to arrive at WTP for alternative RE programs, not just one program. Further, the study considered lower levels of additional RE share – 5%, 10%, and 15%. To the authors’ knowledge, this study provides the first estimates of the comparative WTP for each of the RE technologies available in the Philippines – solar, wind, small-scale hydropower, biomass, as alternatives to geothermal and large-scale hydropower. Do MM households have higher WTP for the new and unconventional RE sources – solar, wind, biomass, and small-scale hydropower over the traditional geothermal and large-scale hydropower?
WTP is a measure of the benefits that an individual perceives to derive from a good. For marketed goods, the price at which the good is purchased is an indicator of the person’s WTP. In the case of public goods and programs or goods with extensive externalities, gains and losses extend beyond the private individuals making purchase decisions, and hence cannot be observed and measured completely from market outcomes. CE is a stated-preference approach to non-market valuation. The stated preference approach entails eliciting people’s WTP for a non-market good or public program through a survey. There are two survey-based non-market valuation methods: CV and CE. In CV, the respondents are asked to state their WTP for a certain level (or change in the level) of a non-market good. In CE, respondents are asked to choose one among several alternatives in a choice set. Each alternative is described in terms of attributes with different levels. A monetary value (price of the good or cost of the program) is included as one of the attributes. In making choices, respondents are implicitly trading off money against the different levels of the attributes in a set of alternatives. WTP for attributes of the good, rather than the good itself, is estimated indirectly based on these trade-offs. CE may be considered more efficient than CV as it collects more valuation information from each respondent. The number of respondents multiplied by the number of choice sets presented to each respondent gives the total number of observations that can be generated and used in the regression analysis. Further, CE allows the researcher to estimate WTP for many different versions of the program through different combinations of attributes’ levels in the choice sets, thus avoiding large split samples that would be required in CV studies [13]. Nonetheless, there appears to be a preponderance of CV over CE studies in past WTP for RE literature. In Oerlemans et al. [14]’s search for academic papers on WTP for green electricity, they gathered a sample of 57 papers, 42 of which utilized CV, and only 15 used CE.
2.1 Survey instrument and choice scenario
This study is part of a multi-country (Thailand, Malaysia, Philippines, Vietnam, Laos, Myanmar) CE survey on WTP for RE. Focus group discussions (FGD) and pre-tests with representative segments of the target population – households from different income classes in MM – were conducted to adapt the standard questionnaire developed for the multi-country study to the Philippine setting. Findings from the FGD and pre-tests were used to formulate background questions relevant to the Filipino households, determine the range of numerical and categorical answers to the questions, formulate the valuation scenario, and determine the relevant attribute levels. The RE technologies, RE shares and percent price increases of electricity were set according to Philippine circumstances.
Specifically, the following details for the choice scenario and other parts of the Philippine survey instrument were informed by FGD and pre-test results. One, the status quo RE technologies for the choice scenario were set to geothermal and large-scale hydropower, and large-scale hydropower was distinguished from small-scale hydropower. Two, the minimum (non-status quo) and maximum levels for the price attribute were set at 5% and 30%, respectively. Three, the household electricity consumption part of the instrument included questions on small-scale business operations at home and on shared electricity connections with other households as these turned out to be prevalent in the Philippines. Four, the list of environmental problems in the awareness questions included only those which were found to be relevant in the Philippine setting. Five, awareness and opinion statements on electricity pricing and subsidies in the Philippines were added to the questionnaire. Finally, the categories of answers to socio-economic questions (e.g.: income brackets, educational attainment) were set according to FGD findings.
The final survey instrument consisted of four parts. Part 1 asked detailed questions about monthly electricity consumption and payments of the household. Part 2 contained the valuation scenario and the choice sets. Part 3 consisted of awareness and attitudinal questions in relation to environmental issues, CC, RE, electricity power sources and pricing, and carbon dioxide removal technology. Part 4 included demographic, and socio-economic questions about the respondents and their households. All questions were provided with answers or ranges of values (except for age) from which respondents could choose, to make the task manageable for the respondent and the responses to all questions quantifiable. Respondents were informed that the survey could take about 20-30 minutes, and they were asked to sign a written consent form before the start of the survey.
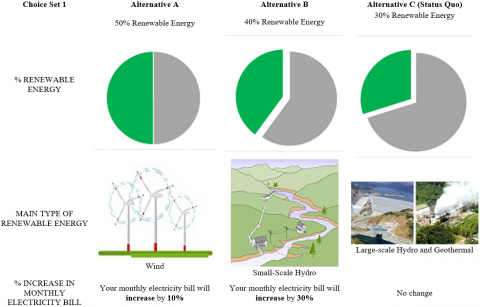
The valuation scenario started with a discussion of the currently installed electric power capacity in the Philippines broken down into coal, gas and oil-based (approximately 70% in 2019) and RE-based (30%), and the government’s plan to increase the RE share to 50% by 2030 as part of the country’s commitment to the Paris Agreement 2015. The above breakdown of the electric power capacity was presented using pie charts to facilitate quick and better absorption of information. The scenario also gave short descriptions of the different RE technologies currently available and utilized in the Philippines, namely, solar, wind, large-scale and small-scale hydropower, geothermal, and biomass. Likewise, to facilitate understanding and stimulate enthusiastic engagement of the respondents, pictures for each of the RE technology were presented after the brief explanations.
The RE program alternatives in the choice sets were described in terms of three attributes: (1) share of RE in electric power generation capacity, (2) RE technology, and (3) rate of increase in monthly electricity charge, the cost attribute. So as not to complicate the choice task and to determine the WTP for each RE type, the increase in the share of RE was assumed to be achieved by a single type of energy. The attribute levels (Table 1) were set based on the results of a pre-test with a sample size of 50.
Each choice set presented the “status quo” and two alternative RE programs. Figure 2 gives a sample choice set. Visual aids, particularly pie charts for RE share, pictures of RE technology for the RE type, and different font sizes corresponding to the relative extent of the price increase, were utilized to facilitate understanding of the trade-offs among the attributes. Using Matlab’s cordexch function, a D-optimal design comprising of 87 choice sets grouped into 11 blocks of 7-8 choice sets (10 blocks with 8 choice sets and one block with 7 choice sets) was generated. Each respondent was presented a block. Each block was randomly assigned to a similar number of respondents.
Table 1. Attributes levels used in the choice sets
|
Attribute |
Levels |
|
Share of RE in electric power supply |
30% (status quo) 35% 40% 45% 50% |
|
Type of RE |
Large-scale hydropower & geothermal (status quo) Solar Wind Biomass Small-scale hydropower |
|
Price/Cost: Rate of increase in monthly electricity bill |
0% (status quo) 5% 10% 15% 20% 30% |
Figure 2. Sample choice set (choice set 1 in Block 1)
2.2 Sampling and survey implementation
The formula used to calculate the desired sample size, n, for the CE was [15]:
$\frac{n t a}{c}>500$ (1)
with t=7, the minimum number of tasks or choice sets for each respondent; a=2, the number of alternatives excluding the “status quo” alternative; and c=5, the largest number of attribute levels excluding the “status quo” attribute level; the number of respondents, n, must be greater than 179. A total of 250 respondents were gathered for this study, 23 respondents for blocks 1-10 and 20 respondents for block 11.
The target respondents for the study were MM resident households with metered connection to the Manila Electric Company (MERALCO). MM, also referred to as the National Capital Region, is the political, economic, social, and cultural center of the Philippines. MM is one of the more modern metropolises in Southeast Asia and is among the world’s 30 most populous regions. The region accounts for a substantial one-third of the Philippines’ gross domestic product. MM households comprise a fourth of total household income and expenditures in the country. While it is the smallest of the country’s 17 regions with an area of only 620 km2, MM is the second most populous (13.5 million in 2020, 12.4% of the entire Philippine population), and the most densely populated with 21,749 people per km2 in 2020 [16].
The study employed multi-staged stratified sampling procedure. The four districts of MM (namely, Capitol, Eastern Manila, Northern Manila, and Southern Manila) comprised the first-stage stratification of the population. Each district was then stratified into its cities (second-stage strata). For each district, a representative city was selected from which the district sample was drawn. The number of respondents in each of the four cities was proportional to the share of the city in MM’s population. The survey respondents were gathered from predominantly residential areas with a mix of low-, middle-, and high-income households using systematic sampling. The survey was implemented in December 2021-February 2022 through in-person interviews conducted by CE-trained enumerators.
2.3 Analytical framework
Choices made by respondents in a CE survey are analyzed based on the random utility theory where an individual’s utility (U) is specified as additively separable in observable or systematic (V) and unobservable or stochastic (ε) preferences [17]:
$\mathrm{U}=\mathrm{V}+\varepsilon$ (2)
Following the Lancasterian theory of value that posits that utility is derived from the attributes or characteristics of a good, rather than from the good in itself [18], the observable component of the utility function is specified in terms of a vector of monetary and non-monetary attributes (X):
$U=V(X)+\varepsilon$ (3)
Presented with a choice set consisting of k alternatives, the individual will select the alternative that yields the greatest utility. With the random part of the preference unknown, only probability statements about the choices can be made. The probability that the individual chooses alternative j over any other alternative k is the probability that the utility derived from alternative j is greater than the utility derived from k, or the probability that the difference between the unobserved utility of alternatives k and j is less than the difference between the observed utility of alternatives j and k [19]:
$P(j$ over $k)=P\left(U_j>U_k\right), \quad j \neq k$ (4)
$=P\left(V_j+\varepsilon_j>V_k+\varepsilon_k\right), \quad j \neq k$ (5)
$=P\left(\varepsilon_k-\varepsilon_j<V_j-V_k\right), \quad j \neq k$ (6)
Assuming that the stochastic components are independently and identically distributed (IID) Gumbel random variables, this probability function can be estimated using the conditional logit model to arrive at the parameters of the utility function–the vector of coefficients β of the monetary and non-monetary attributes. The regression was implemented using the software STATA.
Marginal willingness to pay (MWTP) for each non-monetary attribute Xi is the marginal rate of substitution between the non-monetary attribute and the monetary attribute or the price variable, and is mathematically defined as the negative of the ratio of the coefficient of the non-monetary attribute βi and the marginal utility of money or the coefficient of the price variable βP:
$\mathrm{MWTP}_i=-\beta_i / \beta_P$ (7)
3.1 Respondents’ socio-economic profile
Table 2 presents the profile of survey respondents. The average respondent was 47 years of age. Only a fourth of the respondents were male. The average respondent had some vocational or college education. Average monthly household income of the sample was PHP39,680, only slightly higher than actual mean monthly household income in the National Capital Region of PhP34,821 in 2021 [20]. The average monthly electricity consumption of each household was 289 kWH, and the average monthly electricity bill was PhP2,612, almost 7% of household income.
3.2 Knowledge, attitudes, and opinions regarding climate change and renewable energy sources
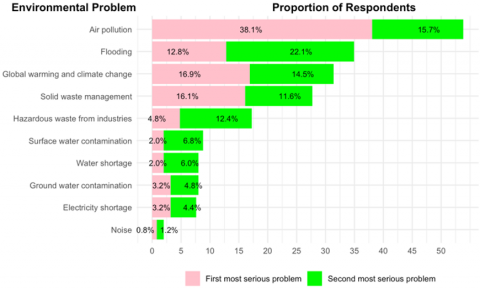
Questions on prior exposure of respondents to issues related to the valuation task were included in the questionnaire. First, respondents were asked to indicate which among ten environmental problems would he/she consider to be the two most serious. Figure 3 reveals that CC was not perceived to be the two most serious environmental problems by the majority of survey respondents. Less than a third of respondents put CC in the top two ranks (16.9% for first, and another 14.5% for second rank). Nonetheless, air pollution, which is chiefly caused by carbon dioxide emissions from non-RE sources in the case of MM, was considered by the greatest proportions of respondents as the first most serious problem (38.1%). It cannot be inferred from the results of the survey, however, if the respondents were able to relate air pollution with the non-renewable sources of energy.
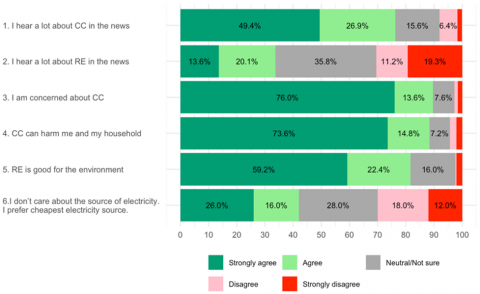
Second, respondents were asked to agree or disagree with statements that reflect exposure and attitudes relating to CC, RE, and electricity pricing. Figure 4 reveals that respondents were more exposed to CC than RE. More respondents claimed to hear a lot about CC (proportion of “strongly agree” and “agree” answers: 76%) than RE (34%) in the news. Most respondents were concerned about CC (90%) and believed that CC could have harmful consequences on their households (88%). A substantial majority (81%) of respondents considered RE to be good for the environment. Yet, nearly half of respondents (42%) indicated they prefer the cheapest electricity source, regardless of the source.
Table 2. Respondents’ profile
|
Variable |
Description, Unit |
Min |
Max |
Mean |
Std dev |
|
Respondent’s age |
Years |
21 |
78 |
47.3 |
12.9 |
|
Respondent’s sex |
1 if male, 0 if female |
0 |
1 |
0.252 |
0.435 |
|
Respondent’s education |
=0 if no formal schooling =1, elementary =2, high school =3, vocational =4, college =5, post-graduate |
1 |
5 |
3.1 |
1.2 |
|
Monthly household income |
Philippine pesos - PhP (US$) |
5,000 (103) |
225,000 (4,639) |
39,680 (818) |
43,076 (888) |
|
Average monthly electricity consumption volume |
Kilowatt-hour |
20 |
3,142 |
289 |
273 |
|
Average monthly electricity bill amount |
Philippine pesos - PhP (US$) |
50 (1) |
32,000 (660) |
2,612 (54) |
2,763 (60) |
Note: Exchange rate: PhP48.5/USS1.
Figure 3. Perceived two most serious environmental problems
Figure 4. Awareness and opinions about climate change and renewable energy
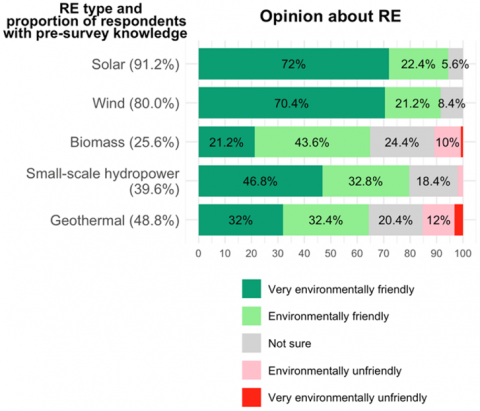
Figure 5. Respondent’s knowledge and opinions about renewable energy types
Third, respondents were asked to assess their knowledge and perceived impact of each RE type on the environment (Figure 5). Solar energy was the most known RE type (91%), followed by wind (80%), geothermal (49%), and small-scale hydropower (40%). The least known was biomass with only a quarter (26%) of the respondents with knowledge about this RE type before the survey. The greatest proportions of respondents considered solar energy (96%) and wind energy (92%) to be environmentally friendly. While still a majority, the proportions of respondents who considered small-scale hydropower, biomass, and geothermal as environmentally friendly were lower at 80%, 65%, and 64%, respectively. Consistent with the relatively lower self-assessed knowledge response, relatively higher proportions of respondents were not sure about the environmental impact of biomass (24%), geothermal (20%), and small-scale hydropower (18%).
3.3 Willingness to pay
Results of the conditional logistic regression of the respondents’ choice decisions in terms of the attributes of the alternatives are presented in Table 3. The estimated coefficients of the RE share and price attributes are significantly positive and negative, respectively. Consistent with economic intuition, MM households are likely to choose an alternative with higher RE share and lower increase in the electricity bill. The significant positive coefficients of solar, wind, biomass and small-scale hydropower imply that these RE sources are preferred over large-scale hydropower and geothermal, the main RE sources prevailing at the time of the study (status quo). The relative magnitudes of the coefficients of the RE types reveal that, among the four alternatives to the prevailing main RE technologies in use, solar is the most preferred, followed by biomass, wind, and small-scale hydropower. The marginal WTP for solar is substantially higher than the marginal WTP for the other RE alternatives. The strong preference for solar energy may be due to the high awareness and perceived positive environmental impacts of solar energy.
Of all RE types, solar is the most known among the respondents, and it is considered to be the most environmentally friendly (please refer to Figure 5). In recent years, the Philippine government has come up with the net metering policy and a low-interest loan package (through the government’s Home Development Mutual Fund) for roof-top solar power systems. These incentives have led to the recent surge in roof-top solar systems. Many residential areas in MM now have a few houses with roof-top solar power systems, making most MM residents directly exposed to solar energy.
Remarkably, biomass, the least known RE technology prior to the survey and considered to be environment-friendly by the smallest proportion of respondents (partly due to a substantial “not sure” answers), is valued more than wind, which closely follows solar in terms of people’s knowledge and perceived positive environmental impact. It is conceivable that the explanation on biomass in the survey instrument has drawn respondents to this RE technology that also offers a solution to the waste management problem. Since the late 1990s, solid waste has been a major environmental concern in the country, most particularly in MM, leading to the enactment of Republic Act (RA) 9003 or the Ecological Solid Waste Management Act of 2000. Hence, apart from CC mitigation, biomass can address the associated problems with solid waste management in the country, namely, the increasing amount of solid wastes, scarcity of sanitary landfills, and improper waste disposal [21].
Table 3. Conditional logistic regression
|
Attribute |
Coefficient |
Std Error |
Marginal WTP |
|
Price – increase in the monthly electricity bill (%) |
-0.0635*** |
0.0046 |
|
|
Share of renewable energy (%) |
0.0161*** |
0.0062 |
0.25% |
|
Solar |
0.9057*** |
0.1264 |
14.26% |
|
Wind |
0.3455*** |
0.1292 |
5.44% |
|
Biomass |
0.4345*** |
0.1280 |
6.84% |
|
Small-scale hydro |
0.3028** |
0.1297 |
4.77% |
|
No of respondents |
250 |
||
|
No of observations |
5954 |
||
|
Log likelihood |
-3197.349 |
||
Table 4 presents the estimated WTP for a specified additional share of RE from each source. For an additional 20% share of RE, WTP ranges from 9.84% to 19.33% increase in the monthly electricity bill. Respondents are willing to pay an amount equal to 9.84% of the monthly electricity bill (PhP257 or US\$5.30) for an additional 20% share of RE sourced from small-scale hydropower. If the additional share of RE is sourced from wind/biomass, WTP is slightly higher at 10.51% (PhP275 or US\$5.67) and 11.51% (PhP301 or US\$6.21), respectively. WTP is highest at 19.33% (PhP505 or US\$10.41) when the additional 20% of RE is sourced from solar. An earlier study using the CV method arrived at a mean WTP of 10.6% of the monthly electricity bill (PhP197-283) for an additional 20% share of RE where the RE technologies to bring about the increase in share was not specified [2]. This paper’s estimates using the CE method are close to the previous estimate, particularly for wind, biomass, and small-scale hydropower. However, for solar, WTP is much higher. This points to substantial variations in preferences among the alternative RE sources, which the discrete CE approach can unravel.
Table 4. Willingness to pay for renewable energy (% increase in monthly electricity bill)
|
RE Type |
Additional RE Share |
|||
|
5% |
10% |
15% |
20% |
|
|
Solar |
15.53 |
16.80 |
18.07 |
19.33 |
|
Wind |
6.71 |
7.98 |
9.24 |
10.51 |
|
Biomass |
8.11 |
9.38 |
10.65 |
11.91 |
|
Small-scale hydro |
6.04 |
7.30 |
8.57 |
9.84 |
WTP estimates for smaller additional shares of RE, namely, 5%, 10% and 15%, are presented in columns 2, 3, and 4, respectively, of Table 4. It can be noted that WTP does not change proportionally with the levels of additional RE share. This highlights the advantage of CE over CV. Estimate of the WTP for the 20% additional RE share in an earlier study [2] cannot be simply adjusted proportionally with the WTP for other levels of additional RE share.
To check on the respondent’s response consistency and the influence of respondent’s socio-economic characteristics, as well as respondents’ awareness and opinions about RE and CC on their preference for additional RE share, separate binary logit regressions of the decision to choose or not to choose either of the two non-status quo alternatives (with additional RE share) over the status quo (no increase in RE share) were run. Table 5 presents the results of the regressions. The results for the socio-economic variables are shown in the first panel of the table. Age has no statistically significant influence on the probability of choosing an alternative with additional RE share. The significant negative coefficient of Gender implies that women are more likely to choose alternatives with additional RE share. Both ElectricityConsumptionVolume and ElectricityBill have significant negative coefficients, suggesting that households that consume more electricity are less likely to prefer additional RE share that entails even larger electricity bills. Likewise, LnHouseholdIncome, has a significant negative coefficient. This may be because income is positively correlated with electricity consumption. Higher income households have higher electricity consumption. Thus, although household income is an indicator of capacity to pay for what may be considered the “greater” or “better” good – positive environmental impacts (such as CC mitigation) of RE-sourced electricity, the further increase in their already high electricity bills makes them less likely to choose alternatives with additional RE share.
Table 5. Separate binary probit regression results
|
Predictors of the Probability of Choosing an Alternative with Additional RE Share |
Coefficient |
|
Socio-economic variables |
|
|
Age |
0.0017 |
|
Gender |
-0.1721*** |
|
ElectricityConsumptionVolume |
-0.00004*** |
|
ElectricityBill |
-0.00001*** |
|
LnHousholdIncome |
-0.1334*** |
|
Awareness and opinion variables |
|
|
CCTop2EnvironmentalProblem |
0.0016 |
|
S1 I hear a lot about RE in the news. |
-0.4829*** |
|
S2 I hear a lot about CC in the news. |
0.2755*** |
|
S3 I am concerned about CC. |
0.8516*** |
|
S4 Climate change can harm me and my household. |
0.6449*** |
|
S5 Renewable energy is good for the environment. |
1.3323*** |
|
S6 I don’t care about the source of electricity. I prefer cheapest electricity source. |
-1.0243*** |
Results for the awareness and opinion variables (second panel of Table 5) generally reflect response consistency and validity of the choices. Coefficients for Statements 2 to 5 are all significantly positive, implying that those who hear a lot about CC in the news (S2), who are concerned about CC (S3) and its harmful impacts (S4), and who believe that RE is good for the environment (S5) are more likely to prefer an additional RE share in electricity generation. On the other hand, S6 has a significant negative coefficient, suggesting that those who prefer the cheapest electricity source are less likely to choose alternatives with additional RE share as they entail an increase in electricity payment. The coefficient of S1 is unexpectedly significantly negative – those who hear a lot about RE in the news are less likely to prefer an increase in RE share. It is conceivable that news about RE, apart from being scarce, is more focused on the cost issues, and not on RE’s CC change mitigation impact and other favorable environmental effects. A quick Google search of news about RE in 2020 when the survey was conducted revealed very few results, which were mainly on the highly technical NREP 2011-2030 document [1], the kind of news to which people generally pay very little attention. Finally, considering CC to be one of the top two most serious environmental problems in the country is found to have no significant bearing on the probability to choose the alternatives with additional RE share. This may be due to inadequate knowledge and appreciation of MM residents about the connection between RE and CC, specifically the role of RE in CC mitigation, as was also found in the earlier CV study [2]. Even in recent years, MM households have limited direct experience of RE, as most are not aware of or do not care about where their electricity is being sourced. On the other hand, people experience in increasing frequency and severity the damages caused by CC – destructive typhoons and flooding, prolonged drought, etc.
The choice experiment survey of this study reveals a much greater preference for solar power as a renewable source of electric power supply. Marginal WTP for solar power-sourced electricity is 2.1 times that of biomass, 2.6 times that of wind, and 3 times that of small-scale hydropower. On average, MM households are WTP an additional 19.3% of their electricity bill for an additional 20% share of RE in electric power capacity that is sourced from solar power. The corresponding WTP for the other RE technologies are substantially lower – 11.9% for biomass, 10.5% for wind, and 9.8% for small-scale hydro. The much greater preference for solar power is also revealed in the responses to knowledge and opinion questions. The greatest proportion of respondents claimed to have knowledge about solar energy prior to the survey and believed that it is environmentally friendly.
The skewed preference and much higher WTP for solar-based RE found in this study augurs well for the government’s updated renewable energy plan which stipulates that the bulk of additional RE supply will be sourced from solar. The positive marginal WTP for the new and unconventional RE technologies found in this study also provide some demand-side evidence for a RE plan that is much less focused and dependent on geothermal and large-scale hydropower, the traditional RE sources in the Philippines. Finally, the slightly higher WTP for biomass over wind and small-scale hydropower indicates the viability of increasing waste-to-energy projects. Thus, there appears to be some scope for intensifying support for biomass and expanding its contribution to the RE mix.
The results of the study highlight the importance of appropriate information campaigns to increase citizenry support for the government’s RE program. Information campaigns must be focused on RE technologies that are not yet so well known to people such as biomass and small-scale hydropower. The study suggests that even the short explanation on biomass as recycling waste materials to produce energy could have induced higher preference for the RE technology. Information campaigns must also be more targeted to female household heads over male as the former group appears to currently have lower WTP for RE. Further, there is a need to raise awareness on RE as a CC mitigation measure since MM residents appear to have a fuller understanding of the harmful effects of CC. These recommendations may also inform RE programs in other developing countries where information about RE and CC is still limited.
This study focused on MM, a highly urbanized region in the Philippines. Future research can extend this research to less urbanized as well as predominantly rural areas. In non-urban areas, the form of RE utilization may be substantially different. For instance, community- or individual-level RE systems may be more appropriate to rural areas due the absence of transmission lines, and people may not have the capacity to make monetary payments, thus requiring a completely different CE set-up or approach.
The conduct of the survey for this study was funded by the Economic Research Institute for ASEAN and East Asia. Writing of the manuscript was undertaken through a grant from the University Research Council of the Ateneo de Manila University.
[1] [DOE] Department of Energy, Republic of the Philippines. (2011). National renewable energy plan: Renewable energy plans and programs 2011-2030. DOE, Taguig City. https://policy.asiapacificenergy.org/sites/default/files/NREP_red.pdf, accessed on Jan. 18, 2024.
[2] Palanca-Tan, R., Sugiyama, M., del Barrio Alvarez, D., Castillo, G.B., Tan, N.M.P. (2023). Metro Manila households’ willingness to pay for renewable energy as a climate change mitigation measure: A CVM study. Sustainability Science, 1-16. https://doi.org/10.1007/s11625-023-01403-3
[3] Pacudan, R. (2014). Electricity price impacts of feed-in tariff policies: The cases of Malaysia, the Philippines, and Thailand. In Energy market integration in East Asia: Energy Trade, Cross Border Electricity, and Price Mechanism. ERIA, Jakarta, pp. 283-319, https://www.eria.org/RPR_FY2013_No.29_Chapter_11.pdf, accessed on Jan. 18, 2024.
[4] [DOE-REMB & NREB] Department of Energy-Renewable Energy Management Bureau & National Renewable Energy Board. (2022). National renewable energy program 2020-2040. DOE, Taguig City, https://www.doe.gov.ph/sites/default/files/pdf/announcements/nrep_2020-2040.pdf, accessed on Jan. 18, 2024.
[5] ESCAP, U. (2020). Regional energy trends report 2020: Tracking SDG 7 in the ASEAN region. United Nations. https://hdl.handle.net/20.500.12870/2999.
[6] [DOE-EPIMB] Department of Energy-Electric Power Industry Management Bureau. (2020). 2019 power situation report. DOE, Taguig City, https://www.doe.gov.ph/sites/default/files/pdf/electric_power/2019-power-situation-report.pdf, accessed on Jan. 18, 2024.
[7] Farley, W., Williams. (2018). The Philippines: Key issues for developing renewable energy project, August 2018 Briefing. https://www.wfw.com/wp-content/uploads/2018/08/WFWBriefing-Renewable-energy-Philippines.pdf, accessed on Jan. 18, 2024.
[8] [NARUC] National Association of Regulatory Utility Commissioners. (2014). Encouraging Renewable Energy Development: A Handbook for International Energy Regulators. USAID. https://www.naruc.org/international/what-we-do/clean-energy/regulating-clean-energy-handbook/, accessed on Jan. 18, 2024.
[9] Rosellon, M.A.D. (2017). The renewable energy policy debate in the Philippines. PIDS Discussion Paper Series No. 2017-17, Philippine Institute for Development Studies, Quezon City, https://www.pids.gov.ph/publication/discussion-papers/the-renewable-energy-policy-debate-in-the-philippines, accessed on Jan. 18, 2024.
[10] Ayyoub, S.A.S., Radaydeh, N.M.M. (2021). The knowledge of people about the use of renewable energy and environmental awareness in their area, Irbid governorate as a case study. International Journal of Sustainable Development and Planning, 16(2): 365-371. https://doi.org/10.18280/ijsdp.160216
[11] Mutani, G., Usta, Y. (2022). Design and modeling renewable energy communities: A case study in Cagliari (Italy). International Journal of Sustainable Development and Planning, 17(4): 1041-1051. https://doi.org/10.18280/ijsdp.170401
[12] Okafor, S.O., Igwe, J.N., Izueke, E.M.C., Okoye, O.E., Okechukwu, A.B., Obiozor, E.E. (2022). Environmental knowledge and policy sustainability: A study of pro environmental policy support among the southeast Nigerian rural communities. International Journal of Sustainable Development and Planning, 17(1): 341-350. https://doi.org/10.18280/ijsdp.170135
[13] Sur, D., Cook, J., Chatterjee, S., Deen, J., and Whittington, D. (2006). Increasing the transparency of stated choice studies for policy analysis: Designing experiments to produce raw response graphs. Journal of Policy Analysis and Management, 26(1): 189-199. https://doi.org/10.1002/pam.20237
[14] Oerlemans, L.A., Chan, K.Y., Volschenk, J. (2016). Willingness to pay for green electricity: A review of the contingent valuation literature and its sources of error. Renewable and Sustainable Energy Reviews, 66: 875-885. https://doi.org/10.1016/j.rser.2016.08.054
[15] De Bekker-Grob, E.W., Donkers, B., Jonker, M.F., Stolk, E.A. (2015). Sample size requirements for discrete-choice experiments in healthcare: A practical guide. Patient Cent, 8: 373-384. https://doi.org/10.1007/s40271-015-0118-z
[16] [PSA] Philippine Statistics Authority. (2021). Highlights of the Philippine population 2020 census of population and housing. https://psa.gov.ph/content/highlights-philippine-population-2020-census-population-and-housing-2020-cph, accessed on Jan. 18, 2024.
[17] McFadden, D. (1974). Conditional logit analysis of qualitative choice behavior. In Zarembka, P. (Ed.) Frontiers in Econometrics. Academic Press: New York, pp.105–142. https://eml.berkeley.edu/~mcfadden/iatbr00.html, accessed on Jan. 18, 2024.
[18] Lancaster, K.J. (1966). A new approach to consumer theory. Journal of Political Economy, 74(2): 132-157. https://doi.org/10.1086/259131
[19] Louviere, J.J., Hensher, D.A., Swait, J.D. (2000). Stated Choice Methods: Analysis and Application. New York, USA: Cambridge University Press. https://doi.org/10.1017/CBO9780511753831
[20] [PSA] Philippine Statistics Authority. (2022). Highlights of the preliminary results of the 2021 annual family income and expenditure survey, Table 1.1. https://psa.gov.ph/content/highlights-preliminary-results-2021-annual-family-income-and-expenditure-survey, accessed on Jan. 18, 2024.
[21] Coracero, E.E., Gallego, R.J., Frago, K.J.M., Gonzales, R.J.R. (2021). A long-standing problem: A review on the solid waste management in the Philippines. Indonesian Journal of Social and Environmental Issues, 2(3): 213-220. https://doi.org/10.47540/ijsei.v2i3.144