Ken Martina Kasikoen*![]() | Sri Handoyo Mukti
| Sri Handoyo Mukti![]() | Akhmad Fauzi
| Akhmad Fauzi![]() | Suprajaka
| Suprajaka![]() | Elsa Martini
| Elsa Martini![]()
© 2023 IIETA. This article is published by IIETA and is licensed under the CC BY 4.0 license (http://creativecommons.org/licenses/by/4.0/).
OPEN ACCESS
The development of inter-urban railway transportation, especially in Greater Jakarta and its surroundings, has a significant impact on regional development. The government is developing the railway network, allowing for expansion of development in the area around the railway network, leading to urban sprawl and other negative externalities. A comprehensive study is needed to anticipate and provide policy instruments to control the negative impacts of railway expansion. This study aimed to address such an issue by developing a dynamic model of inter-urban railway transportation and its impact on the development of a region using a system dynamic modeling, by developing land-use sub-model, population sub-model, housing sub-model, and economic sub-model. The study was conducted in the Sukaraja District of Bogor Regency, part of the Greater Jakarta railway network transportation development. The study shows that within the next 50 years, the study area will be impacted significantly by the railway networks, leading to declining agricultural land availability, increasing settlement areas, and expansions of economic infrastructures. These will positively and negatively impact the regions and their neighborhood regions, such as Bogor and Jakarta.
inter-urban railway transportation, impacts of inter-urban railway transportation, regional development, dynamic modeling
As elsewhere in typical metropolitan areas of developing countries, the Greater Jakarta area, which includes an area of the City of Bogor, the capital city of Jakarta, the City of Bekasi, and the City of Tangerang, is experiencing a complex socio-economic and environmental problem, of arising from growing settlement and transportation problems. As the price of land in the capital city is skyrocketing, people who work there prefer to settle in the neighboring areas, such as Bogor Regency, and commute to the capital city. They will occupy land that is more accessible areas near railway stations and make it higher development intensity [1, 2].
Consequently, traffic congestion and other negative externalities such as pollution and loss of time have become common problems in the regions. Road transport imposes negative externalities on society, including environmental damage [3, 4]. Such issues have put additional burdens on household economics regarding extra spending for fuel consumption and other expenditures related to commuting using their vehicles or public land transportation [5].
Realizing such problems, people opt to use an inter-urban railway transportation system connecting neighborhood areas with Greater Jakarta. Inter-urban railway transportation is deemed more time-efficient and less costly than conventional land-based transport systems [6]. It is because, as in many developing countries, in Indonesia, the government heavily subsidizes the commuter train as a mass rapid transportation system. In addition, as more people use the interurban railway transportation system, the interurban railway was viewed as the key to reducing congestion, improving air quality, and providing quality transit service for the region [7] and an alternative method to solving traffic congestion in the city [8].
However, an increase in the number of people using mass rapid transport, such as inter-urban railway transportation, creates a double-edged sword. On one side, inter-urban railway transportation could ease congestion, increase commuting efficiency, and improve productivity [9-11]. Still, on the other side, it induces more and more people to live away from the capital city, preferring to settle in suburban areas, as land prices decrease with the distance from the city center [12]. It is the cease of Jakarta metropolitan and its neighboring areas of cities such as Bogor, Depok, Tangerang, Bekasi, and Bogor Regency. Nevertheless, as more and more people choose to live in suburban areas, it creates a vicious circle whereby an increase in the influx of people creates a high demand for land, and as a result, increases the price of land in suburban areas and addition of land conversing of productive land for agriculture for housing and other amenities. That is, inter-urban railway transportation could induce land use change in sub-urban areas [13]. This situation also supports the proposition that a railway transport system plays a crucial role in regional economic development and creates a domino effect on other economic activities [14], impacts economic growth [15], local economy [16], promotes regional economic development and socio-economic of communities residing in areas connected to railway system [17].
One of the crucial problems that might arise in the future in the context of urban development driven by railway networks is uncontrolled development leading to urban sprawl, uncontrolled land conversion, a sharp increase in land price, and negative environmental externalities due to uncontrolled development. Urban development can be faster in suburban areas with more reserve lands because of more opportunities for transportation infrastructure investment [18].
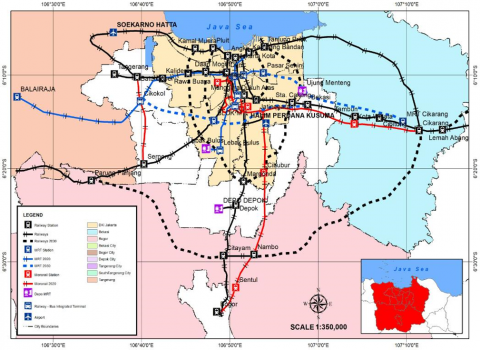
All of these might outweigh the benefits of the inter-urban railway transportation system developed in the region. In Indonesia's context, many suburban areas are now connected to inter-urban railway transportation to Greater Jakarta metropolitan areas. Suburban regions to the west, east, and south of Jakarta are planned to have an integrated railway network to the capital (Figure 1). Hence, not only will economic development growth allow these corridors, but uncontrolled development might also arise. Therefore, a study to assess the dynamic impact of inter-urban railway transportation systems on regional development is essential and is sorely needed in a developing country such as Indonesia. At this time, no such study exists. Yet, the expansion of urban areas driven by the inter-urban railway transportation system is continuing along with increasing land conversion and human settlement. With the number of inter-urban transportation railway lines in Greater Jakarta and other cities in Indonesia, it is urgent to address such problems that this study is carried out. Lessons learned from this study could be drawn as a recommendation to the government for improving inter-urban railway transportation-related development and urban development in general.
Figure 1. Masterplan of the Greater Jakarta railway network
Source: Railroad Information Book 2014. The Ministry of Transportation of The Republic of Indonesia, page 50
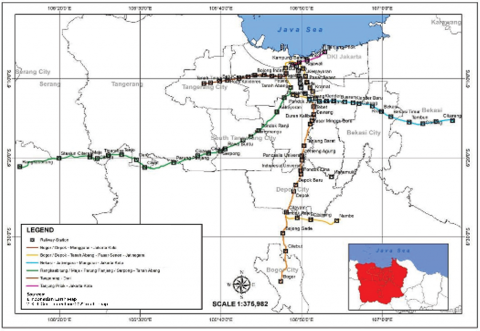
This study was carried out in a Suburban area in the Sukaraja District of Bogor Regency. Located between the capital city of Jakarta in the north and the City of Bogor in the south (Figure 2), the district has become the preferred and ideal choice among people working in Jakarta and Bogor. The district is connected with the Jakarta-Bogor railway system, and its main railway station, i.e., Cilebut train station, is the main entry for commuters to Jakarta and Bogor. Traveling to Jakarta from this station takes only 60 minutes, compared with more than 90 minutes by land transportation. From the station to the City of Bogor, it takes only 10 minutes, compared with 30-40 minutes by another public transport system.
As the preferred location for commuters, the development of settlements in Sukaraja has been expanding quite rapidly recently. Human settlements, built areas, and business infrastructures have been developing. From 2011 to 2019, population growth in the Sukaraja District had also grown around 3.70% per year. Along with the population growth, the number of people commuting from Cilebut central station to Bogor and Jakarta areas has risen 11.05% per year.
A study shows a strong correlation between population increase in the areas and an increase in train passengers along this route. Conversely, the site has been experiencing a decline in agricultural land areas and people working in agriculture-related sectors [19]. In addition, uncontrolled development in the region has also been witnessed, especially in areas surrounding the Cilebut railway station. Roads network structure tends to be sporadic or unorder, while the sign of urban sprawl is also beginning to appear in the Sukaraja District. It could become a severe consequence in the future development of the area and the surrounding areas of Greater Jakarta and Bogor.
Figure 2. Study area
Source: 1. Indonesian Earth Map; 2. KRL Commuter Line 2022 Route Map
There are various ways of modeling the relationship between inter-urban transportation railway and urban development. One of the models to address the dynamic of inter-urban transport railway and urban and regional development is using system dynamic modeling. Forrester developed a model describing the interrelationships between various components in 1969 [20]. A model that simulates a complex dynamic system [21]. A model that can be used to determine scenario planning as a strategic method in future planning [22].
Even though there are various studies on using system dynamics in relationship with transportation [23], the model can use concern with the environment [24], land use changes [25], and population [26, 27], that the urban transportation system emphasizes a complex system with multiple variables and various loops, and its interaction with other socio-economics of urban and regional development is inevitable. Therefore, one of the best approaches is using system dynamics to model the dynamic interaction between transportation and regional development.
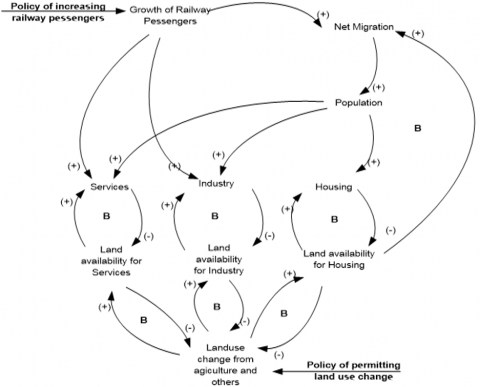
This study uses a system dynamic approach integrating transport systems with other systems such as population, land use change, housing and industries, and service sectors, as sectors in urban areas [28]. In this study, the industry and services sectors represent economic activities driven by the development of the railway network. The growth in hospitality industries, such as hotels and restaurants, and services industries, such as banks, will be used as proxied in the model. The causal loop of the conceptual model is described in Figure 3.
Figure 3. Causal loop diagram of the study
As seen in Figure 3, it is predicted that the growth of railway passengers will have a positive feedback loop on migration, industry, and services. Increases in population will affect the demand for housing, industry, and services, increasing the demand for land and eventually affecting the supply of land since the total land is fixed. The dynamic of disequilibrium between supply and demand for land will give feedback to the boundary growth of housing, service, industrial, and net migration. Loop B indicates a balance between variables, for example, between the availability of residential, service, and industrial land with changes in land permitted from agricultural or other land. Figure 3 also describes other balancing loops between service, industry, and housing activities with land availability or the balance between net migration and the availability of residential land.
The model is run with three scenarios to simulate different policy scenarios, as listed in Table 1.
Table 1. Policy scenarios for inter-urban dynamic mode
|
Scenarios |
Railway Policy |
Landuse Change Policy |
|
Scenario-0 |
Without railway |
Permitted |
|
Scenario-1 |
With railway |
Permitted |
|
Scenario-2 |
With railway and adjustment of railway capacity |
Permitted |
As can be seen from Table 1, all scenarios assume that the local government allows land use change to occur in the region. It is to mimic the uncontrollable development in the area which is currently occurring. It is also designed to project what would happen in the area if such land use change occurs with regard to other sectors such as agriculture and housing.
The conceptual causal loop of the system dynamic model of inter-urban transportation and its impact on regional development in Sukaraja District – Bogor Regency was implemented using a stock-flow diagram. The stock-flow diagram is divided into several sub-model, i.e., land use sub-model, population sub-model, housing sub-model, and economic-sub model. Each sub-model ran as an integral part of the whole model.
4.1 Land use sub-model
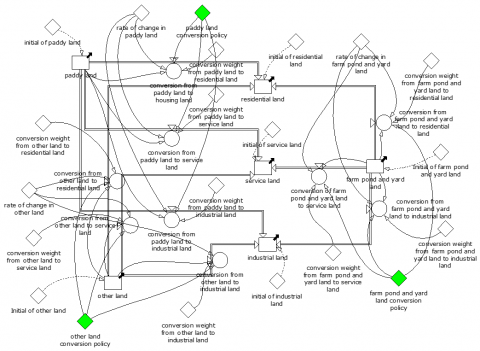
The stock-flow diagram of the land use sub-model is described in Figure 4. The impact of development due to the railway network is shown by the changed land use in the area, from non-built to built-up areas. Five coverages of land are being analyzed in this study: paddy fields, service land, residential land, industrial land, farm, pond and yardland, and other land. Existing land stock data is taken from the 1: 50,000 scale map of the earth [29] in 2011, 2015, and 2018, as shown in Figure 5.
Figure 4. Stock-flow diagram of land use change sub-model in Sukaraja District
Figure 5. Map of land use change in the study area in 2011, 2015, and 2018
Results of the simulation on land use change driven by the inter-urban railway system are depicted in Figures 6 and 7.
Figure 6. Decreasing in paddy land, other land, farm pond, and yard land
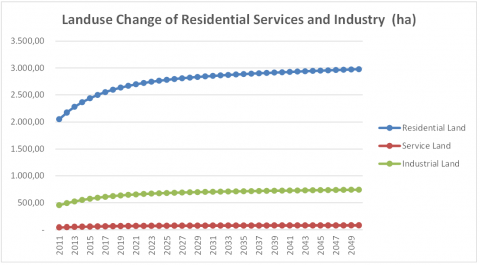
Figure 7. Increasing in residential land, service land, and industrial land
As can be seen from Figure 6, the impact of the inter-urban railway network will induce land conversion of agricultural land to other uses. As a consequence, paddy fields decline significantly in an exponential pattern, while pond and yard land tend to decline in a linear pattern. Land used for paddy fields reduced from 359 ha in 2011 to approximately 0.44 ha in the year 2050. The decline in agricultural land is attributed to an increase in residential areas, which increased from 2052 ha in 2011 to approximately 2976 ha in 2050, and land used for services (45 ha in 2011 to 82 ha in 2050) and industrial areas (455 ha in 2011 to 742 ha in 2050) as described in Figure 7.
The impacts of land use change under different policy scenarios are depicted in Figures 8, 9, 10 and 11.
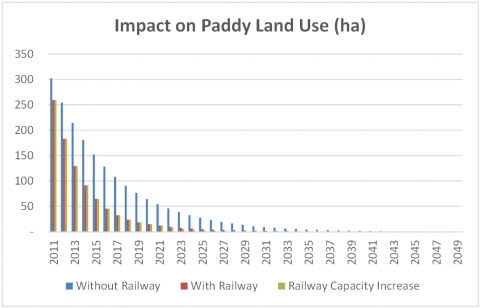
Figure 8. Impact of railway on paddy land use
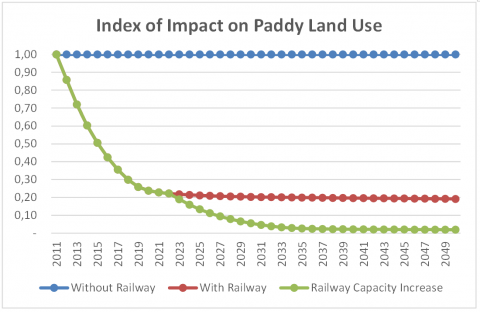
Figure 9. Index of Impact of railway on paddy land use
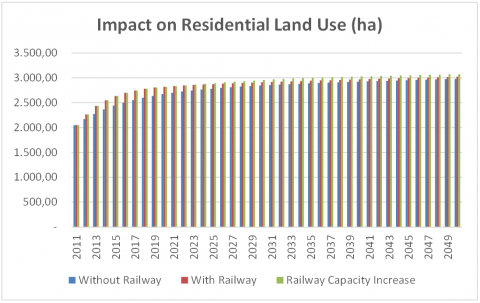
Figure 10. Impact of the railway on residential land use
Figure 11. Index of Impact of the railway on residential land use
The impact of different policy scenarios on land use change can be summarized as follows:
- Decreased paddy fields due to the expansion of economic activity triggered by the railway network are much faster than the no-railway network. The rate of the decline in paddy fields is more than double under scenario 2 when the capacity of the railway network is increased.
- Without a railway network, residential areas will increase naturally from 2052 ha in 2011 to 2976 ha in 2050 (scenario-0). The residential areas will increase significantly at a rate of 1.08 times the baseline (without a railway network) in the first five years and then decline after reaching equilibrium (under scenario 1 and scenario 2). The decline in the multiplication factor is due to the limited availability of land to support further development of residential areas.
4.2 Population sub-model
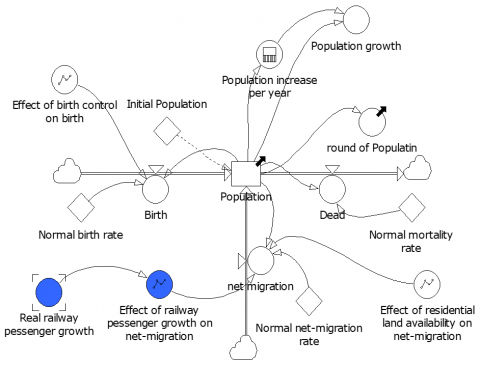
Figure 12 describes the stock-flow diagram of the population sub-model. As shown in Figure 12, the impact of the inter-urban railway network on population development is driven by the railway passenger growth variable. This variable is then assumed to impact net migration and, eventually, population growth in the region.
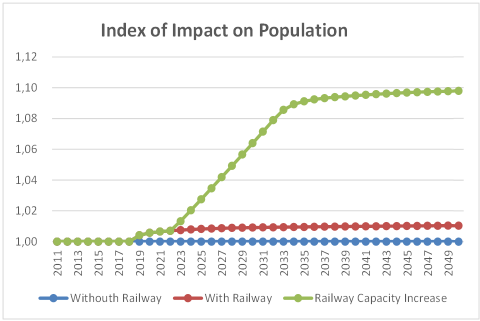
The simulation results on the railways' impact on population growth are described in Figure 13 and Figure 14.
Figure 13 and Figure 14 reveal the impact of the railway network on population growth under different scenarios. Under scenario 0 (no railway network), the population of Sukaraja will grow naturally from 177,000 people in 2011 to approximately 370,000 in 2050. Under scenario 1, the population will grow at 1.12 times the baseline (scenario 0) or 1.12 times the baseline under scenario 2. The growth of the people in the region will undoubtedly significantly impact other sectors, such as housing and economic activities, as explained in the following sections.
Figure 12. Stock flow diagram of population sub-model in Sukaraja District
Figure 13. The effect of the presence and absence of railways on population increase
Figure 14. Index of the effect of the presence and absence of railways on population increase
4.3 Housing sub-model
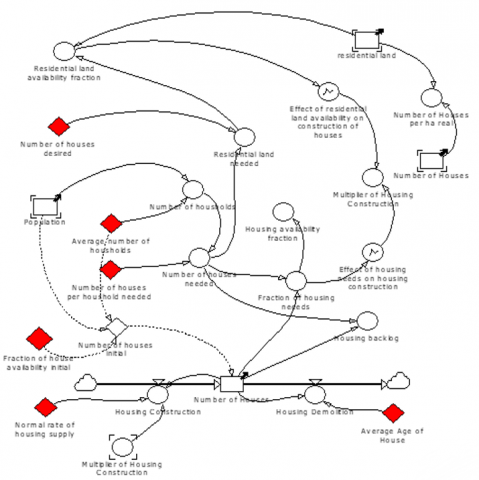
The impact of railway network development on housing is modeled through the indirect impact of the railway on the population and housing. As can be seen from the stock-flow diagram in Figure 15, the growing demand for housing will be triggered by a change in people. Eventually, it will have a domino effect on the demand for housing and land availability.
The relationship between housing demand and population is proxied within the model through the ratio of needs and demand for housing land. This ratio yields a multiplier coefficient for the land and housing simulation. If the ratio of need over demand is greater than one, then we can set the multiplier equal to 1, i.e., there is no effect on land availability. On the other, if the land is limited, the multiplier effect would be less than 1. This multiplier effect is then used to predict the number of houses built during the simulation periods. The results of the simulation on housing are described in Figure 16 and Figure 17.
Figure 15. Stock flow diagram of housing sub-model in Sukaraja District
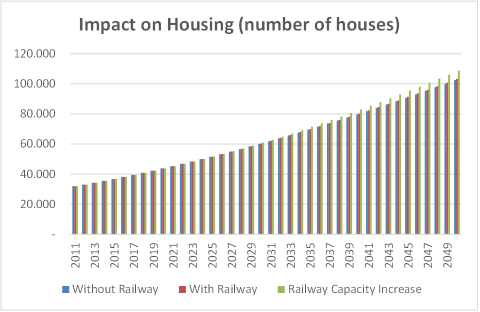
Figure 16. Impact of the railway on housing
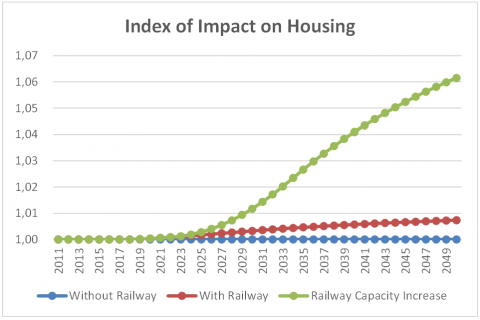
Figure 17. Index of impact of the railway on housing
Figure 16 and Figure 17 depict the effect of the railway network on housing development under different scenarios. The left part of Figure 16 and Figure 17 describes the number of houses that will expand until 2050 under various scenarios, representing the railway's multiplier effect on housing under different scenarios. As seen from Figure 17, under the no railway scenario (scenario-0), housing will grow from 3400 units in 2011 to 97,000 units in 2050. Under scenario 1, this housing will increase by 1.04 times the baseline (scenario 0), while under scenario 2, housing growth will be at 1.09 times the baseline.
4.4 Economic sub-model
The impact of the railway network on economic development in Sukaraja District was identified by the development of service activities, including hotels and inns, shopping infrastructures, and banks representing the service sector, as seen from the stock-flow diagram in Figure 18. Figure 19 and Figure 20 display the simulation results on hotels and Inns in the area, while Figure 21 and Figure 22 display the simulation for shopping facilities. Figure 19 and Figure 20 were run under the assumption of exogenous growth, i.e., it is not purely influenced by the growth of population since it is not directly correlated between the number of people residing in the area and the number of hotels.
The growth of the hotel is mainly determined by the development of network infrastructure, which in turn induces the need for amenities and MICE (meeting incentive convention and exhibition) activities.
Figure 18. Stock flow diagram of hotel, inn, and services sub-model in Sukaraja District
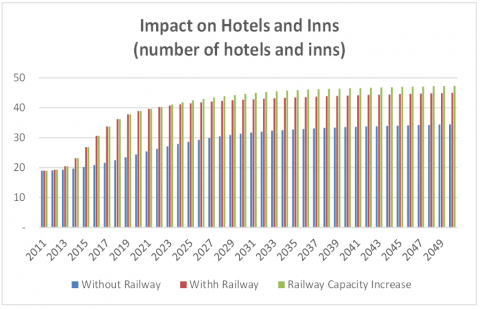
Figure 19. Impact of the railway on the number of hotels and inns
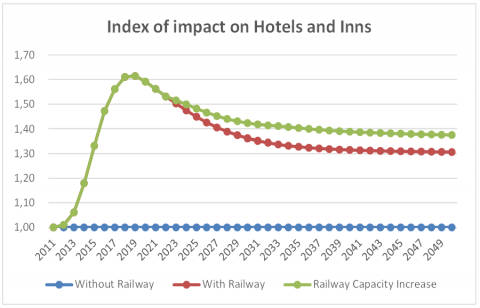
Figure 20. Index of impact of the railway on the number of hotels and inns
Based on the simulation, it is predicted that under scenario-0 (no railway network), the number of hotels and Inn will grow from 19 units in 2011 to 530 in 2050. This number will increase 1.1 times under scenario 1 and 1.15 times under scenario 2 in 2050. Again, the increase in this number is attributed to the need for MICE activities which is currently served by the areas nearby Jakarta, such as Bogor and its vicinities. Most people and government activities prefer to have meetings and conventions in nearby cities around Bogor, which offers competitive prices and a better environment (amenities) compared with Jakarta areas.
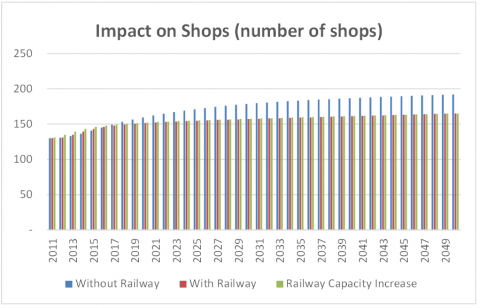
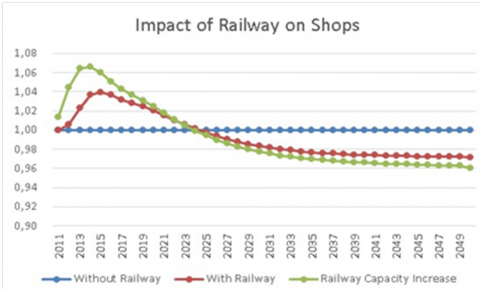
Figure 21 and Figure 22 display the growth of shopping infrastructures due to the railway's network. As seen in Figure 18, under scenario 0, the number of shopping facilities will grow from 130 units in 2011 to approximately 174 units in 2050. The number of facilities will increase in the first five years of simulation at around 1.04 times the baseline under scenario 1 and 1.07 times the baseline under scenario 2.
As competition for land intensifies, and land is getting scarce, the number of shopping facilities is predicted to decline at 0.95 times the baseline.
Figure 21. Impact of the railway on the number of shops
Figure 22. Index of impact of the railway on shopping facilities
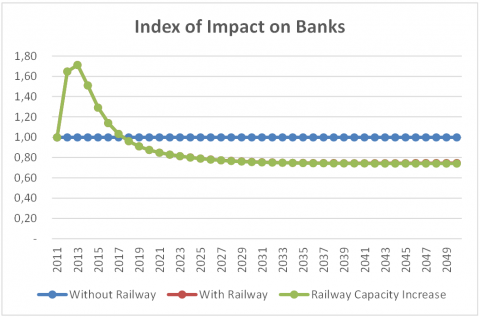
The impact of the development railway network on the service sector can be proxied through the growth of the banking sector. With the number of people, housing, and economic activities, the demand for banking services is also expected to grow. Nevertheless, establishing bank offices will be limited by the availability of land allotment. Therefore, the number of banks is expected not to grow indefinitely. This prediction is reflected in Figure 23 and Figure 24, whereby the number of bank offices peaks in the first three years of simulation and eventually will decline afterward.
Figure 23. The effect of the number of banks due to the presence or absence of railways
Figure 24. Index of the effect of the number of banks due to the presence or absence of railways
In contrast to Wijayanto et al. [30], who did dynamic modeling of prediction models for the number of passengers, the number of trains, income, and the number of subsidies for policymakers to formulate a Jabodetabek KRL management strategy in the future. In this study, dynamic modeling was carried out to determine the impact of the development of the rail network on regional development, especially in suburban areas, to provide valuable insights for policymakers. First, the dynamic simulation results will provide ex-ante predictions about how the sub-urban area will develop. Therefore, policy frameworks can be designed in advance to anticipate and offset the negative consequences of rail networks or inter-city transportation developments. That way, the benefits of building a rail network can be more sustainable. Second, uncontrolled suburban development will significantly impact economic and social factors as well as the environment. Urban shifts, waste, and pollution from increased settlements can take a toll on communities and government budgets. Therefore, the government can design adaptive steps to overcome this problem from dynamic simulation system projections. Third, the development of the future rail network can be anticipated so as not to cause a surge in the price of land and other expensive infrastructure.
Inter-urban transportation railway system plays a significant role in developing the economics of sub-urban regions. That is a more beneficial regional development that could be driven by expanding the railway network. Nevertheless, as suburban cities expand into bigger cities, it creates more burden on environment-carrying capacity. Therefore, comprehensive policies to address such issues are needed. The model presented here did not address the consequences on environmental carrying capacity, except for land availability. Nevertheless, by analyzing the possible paths of housing and economic development in the years to come, policymakers could benefit from the model to design an environmental policy in the regions.
Further research is needed to determine the development of areas around other inter-urban transportation railway stations to determine which areas have faster development than others. Furthermore, the government can provide regional development policies based on the areas urgent for spatial planning first.
[1] Sung, H., Choi, K., Lee, S., Cheon, S. (2014). Exploring the impacts of land use by service coverage and station-level accessibility on rail transit ridership. Journal of Transport Geography, 36: 134-140. https://doi.org/10.1016/j.jtrangeo.2014.03.013
[2] Zhan, Q., Jia, Y., Zheng, Z., Zhang, Q., Luo, L. (2022). Associations of land use around rail transit stations with jobs–housing distribution of rail commuters from smart-card data. Geo-spatial Information Science, 1-16. https://doi.org/10.1080/10095020.2022.2100286
[3] Delgado Jalón, M.L., Gómez Ortega, A., De Esteban Curiel, J. (2019). The social perception of urban transport in the city of Madrid: The application of the Servicescape Model to the bus and underground services. European Transport Research Review, 11(1): 1-11. https://doi.org/10.1186/s12544-019-0373-5
[4] Ganning, J., Beaudoin, M., Brewer, S., Kim, K., Park, K. (2016). The effects of commuter rail on population deconcentration and commuting: A Salt Lake City case study. http://archives.pdx.edu/ds/psu/16963
[5] Habanabakize, T. (2021). Determining the household consumption expenditure’s resilience towards petrol price, disposable income and exchange rate volatilities. Economies, 9(2): 87. https://doi.org/10.3390/economies9020087
[6] Zubair, A., Barus, L.S., Soemabrata, J. (2019). Passenger behavioral map** and station facilities design at commuter line train station (Case: Tangerang station, Indonesia). GEOMATE Journal, 16(58): 151-156. https://doi.org/10.21660/2019.58.8253
[7] Eisen Letunic. (2009). Regional bicycle plan for the San Francisco bay area. http://www.eisenletunic.com.
[8] Abd Aziz, S., Kasim, R., Masirin, M.I.H.M. (2018). Urban rail system and the impacts to surrounding area. Res. Gate. https://doi.org/10.13140/RG.2.2.11869.05600
[9] Fageda, X. (2021). Do light rail systems reduce traffic externalities? Empirical evidence from mid-size European cities. Transportation Research Part, D-92 (2021): 102731. https://doi.org/10.1016/j.jtrangeo.2021.102731
[10] Ma, L., Ye, R.N. (2019). Does daily commuting behavior matter to employee productivity? Journal of Transport Geography, 76(2019): 130-141. https://doi.org/10.1016/j.jtrangeo.2019.03.008
[11] Moyano, A. (2016). High speed rail commuting: Efficiency analysis of the Spanish HSR links. Transportation Research Procedia, 18(2016): 212-219. http://creativecommons.org/licenses/by-nc-nd/4.0/.
[12] Diao, M., Fan, Y., Zhang, X. (2019). Introduction to special issue: Rail transit development in China and beyond. Journal of Transport and Land Use, 12(1): 237-239. https://doi.org/10.5198/jtlu.2019.1571
[13] Sarri, P., Kaparias, I., Preston, J., Simmonds, D. (2023). Using land use and transportation interaction (LUTI) models to determine land use effects from new vehicle transportation technologies: A regional scale of analysis. Transport Policy, 135: 91-111. https://doi.org/10.1016/j.tranpol.2023.03.012
[14] Gadelshina, L.A., Vakhitova, T.M. (2015). The place and role of transport infrastructure in the interregional integration of the Russian Federation regions. Procedia Economics and Finance, 24: 246-250. https://doi.org/10.1016/s2212-5671(15)00655-3
[15] Yu, J., Zhou, Y., Huang, Q., Li, X., Hou, Y., Wang, X. (2021). Analysis of the impact of high-speed railway on county economic development based on the synthetic control method: The Hubei province in China. Mathematical Problems in Engineering, 2021: 1-16. https://doi.org/10.1155/2021/6727793
[16] Blanquart, C., Koning, M. (2017). The local economic impacts of high-speed railways: Theories and facts. European Transport Research Review, 9(2): 1-14. https://doi.org/10.1007/s12544-017-0233-0
[17] Lingaitis, V., Sinkevičius, G. (2014). Passenger transport by railway: Evaluation of economic and social phenomenon. Procedia-Social and Behavioral Sciences, 110: 549-559. https://doi.org/10.1016/j.sbspro.2013.12.899
[18] Yu, X., Zhong, H., Zhou, T., Zhou, Y. (2018). Rail transit development in lagging regions. Journal of Transport and Land Use, 11(1): 1003-1024. https://doi.org/10.5198/jtlu.2018.1235
[19] Kasikoen, K.M., Martini, E. (2019). Impacts of inter-urban transportation railway to regional development (Case study: Sukaraja District-Bogor Regency-West Java Province). In IOP Conference Series: Earth and Environmental Science, 340(1): 012028. https://doi.org/10.1088/1755-1315/340/1/012028
[20] Wang, L., Zhang, X. (2017). System dynamic model for simulating demand-supply interaction of railway express freight system. Mathematical Problems in Engineering, 2017: 8481708. https://doi.org/10.1155/2017/8481708
[21] Scoenenberger, L., Schmid, A., Tanase, R., Beck, M., Schwaninger, M. (2021). Simulation modelling practice and theory. Simulation Modelling Practice and Theory, 28: 73-89. https://doi.org/10.1016/j.simpat.2021.102333
[22] Mai, T., Smith, C. (2018). Scenario-based planning for tourism development using system dynamic modelling: A case study of Cat Ba Island, Vietnam. Tourism Management, 68: 336-354. https://doi.org/10.1016/j.tourman.2018.04.005
[23] Shepherd, S.P. (2014). A review of system dynamics models applied in transportation. Transportmetrica B: Transport Dynamics, 2(2): 83-105. https://doi.org/10.1080/21680566.2014.916236
[24] Procter, A., Bassi, A., Kolling, J., Cox, L., Flanders, N., Tanners, N., Araujo, R. (2017). The effectiveness of Light Rail transit in achieving regional CO2 emissions targets is linked to building energy use: Insights from system dynamics modeling. Clean Technologies and Environmental Policy, 19(5): 1459-1474. https://doi.org/10.1007/s10098-017-1343-z
[25] Xu, X., Luo, X. (2018). A system dynamics approach to integrating sustainable land use with transportation system based on access management. In Proceedings of the Asia-Pacific Conference on Intelligent Medical 2018 & International Conference on Transportation and Traffic Engineering 2018, pp. 200-207. https://doi.org/10.1145/3321619.3321663
[26] Kasikoen, K.M. (2010). Pemanfaatan Model Sistem Dinamis Dalam Memperkirakan Jumlah Penduduk Di Masa Datang Studi Kasus: Kabupaten Cilacap. Planesa, 1(2): 213238.
[27] Pitoyo, A.D., Ulhaq, M.D., Wahid, A., Taqiyyah, S. (2018). System dynamics modeling of Indonesia population projection model. In IOP Conference Series: Earth and Environmental Science, 145(1): 012117. https://doi.org/10.1088/1755-1315/145/1/012117
[28] Diemer, A., Nedelciu, C.E. (2020). System dynamics for sustainable urban planning. Sustainable Cities and Communities: Encyclopedia of the UN Sustainable Development Goals, 760-773. https://doi.org/10.1007/978-3-319-95717-3_115
[29] Geospasial. (2018). Indonesian earth map, scale 1:50,000. https://tanahair.indonesia.go.id/portal-web.
[30] Wijayanto, Y., Fauzi, A., Rustiadi, E. (2022). A system dynamics model of urban railway demand prediction for safety and security improvement: Lessons learned from Indonesian railway network. International Journal of Safety and Security Engineering, 145-157. https://doi.org/10.18280/ijsse.120202