Muthana Faaeq ALmasoodi![]() | Suraiyati Rahman*
| Suraiyati Rahman*![]() | Mohammed Basendwah
| Mohammed Basendwah![]() | Alaa N. ALfarra
| Alaa N. ALfarra![]()
© 2023 IIETA. This article is published by IIETA and is licensed under the CC BY 4.0 license (http://creativecommons.org/licenses/by/4.0/).
OPEN ACCESS
In the dynamic realm of contemporary tourism, the ancient city of Babylon in Iraq stands at a pivotal juncture. As travelers’ expectations and technology continue to advance, the city of Babylon faces the challenge of adapting to this changing landscape to remain a relevant and sought-after destination. This study aims to explore the digital transformation plans while emphasizing emerging quality dimensions and their associated consequences in the historic city of Babylon in Iraq. The digital transformation in Iraq faces challenges, primarily due to a shortage of skilled digital professionals and limited collaboration among government, industry, universities, and research institutes in the tourism sector. This slowdown is particularly concerning since the Iraqi government has identified tourism as a critical industry for the country's 21st-century growth. To investigate these issues, the study employed a quantitative research design, utilizing questionnaires to measure visitor expectations and perceptions of service quality. Data were collected through self-administered questionnaires in Babylon, resulting in 315 usable responses. The study's findings underscore the necessity for Babylon City to adapt to the evolving demands of modern travelers who anticipate seamless, personalized, and technologically enhanced experiences. Embracing digital technologies, including mobile apps, social media, and data analytics, is vital for both attracting and retaining visitors. The study outcomes lay the groundwork for developing strategies that foster a genuinely inclusive and accommodating atmosphere for tourists by Investing in digital infrastructure to position Babylon City as a technologically advanced and attractive tourist destination. Furthermore, the quality of tourism services, as well as the digital implementation in service delivery, plays a significant role not only in visitor satisfaction but also in enhancing the city's global reputation in the digital age.
tourist satisfaction, SERVQUAL, experience, digital implication, case study, Babylon City
The concept of digital transformation has evolved into a global phenomenon, reshaping various industries and sectors, including tourism, in response to the rapid evolution of digital technologies [1]. Digital transformation encompasses the comprehensive integration of these technologies into traditional business processes and models, aiming to achieve greater efficiency, innovation, and enhanced customer experiences [2, 3]. It encompasses a diverse range of technologies, from artificial intelligence and data analytics to mobile applications and the Internet of Things (IoT). The impact of digital transformation extends beyond individual organizations, as it has profound implications for how societies operate in an increasingly interconnected world.
The history of digital transformation is marked by significant milestones in the adoption of digital technologies across various sectors. While the initial phase involved the digitization of data and processes, true acceleration occurred with the advent of the internet and the proliferation of smartphones. These developments empowered individuals and organizations to access information, communicate, and conduct transactions in ways that were previously unimaginable. Recent years have witnessed the convergence of technologies, enabling businesses to leverage the power of big data, automation, and real-time connectivity [2]. This convergence has given rise to innovations such as smart cities, personalized marketing strategies, and transformative experiences, particularly in sectors like tourism [4, 5].
Babylon City has historically attracted visitors interested in its rich cultural heritage. However, with the advent of the digital age, the significance of providing excellent customer service to tourists has grown significantly. This study explores the interaction between the development of digital technologies and the imperative of providing exceptional customer service to tourists in Babylon City. Modern technologies have completely transformed travel preparation and execution, enabling travelers to research their next trip, read countless reviews, and book accommodations all from the convenience of their smartphones. Consequently, travelers now expect seamless, personalized, and memorable experiences. As Babylon City gains popularity as a tourist destination, it faces the challenge of catering to an increasing number of tech-savvy visitors. The days when a captivating historical site alone sufficed to satisfy tourists are gone. Modern travelers anticipate a comprehensive and seamless experience throughout their journey, seeking "quality tourism service" across various elements, including punctual transportation, comfortable lodgings, knowledgeable tour guides, clear navigation, and user-friendly facilities. Literature underscores that delivering quality service is a pivotal factor influencing customer satisfaction and, subsequently, their intention to return [6]. Service providers in Babylon City can no longer adhere to the status quo and offer minimal services; instead, they must embrace digital technology to remain competitive. With the ascent of digital transformation, businesses have gained numerous opportunities to engage with customers in diverse ways. Mobile applications, social media platforms, and online travel agencies have become indispensable tools to promote and facilitate tourism in Babylon City. These platforms hold the potential for personalized recommendations, real-time updates, interactive maps, and convenient booking alternatives.
Furthermore, a substantial research gap exists in studies examining the integration of digital technologies with travel experience in tourism destinations, particularly within the context of Babylon City. Previous literatures related to Babylonian tourism has predominantly focused on tourist satisfaction with tour guide services (e.g., the study of Almasoodi and Rahman [7]), satisfaction with the accommodation sector (e.g., the studys of Al-Quraishi and Gabraw [8], and Pritchard and Morgan [9]), and the assessment of health center service quality from a tourist's perspective (e.g., the study of Saranj [10]). Investigating the impact of integrating digital technologies on the tourism industry in Babylon City is thus a worthwhile endeavor. While recognizing the prevalence of digital technologies in travel preparation and execution, this study seeks to delve into the specific challenges and opportunities this integration presents for service providers and tourists in Babylon City. Addressing this research gap is pivotal for service providers to adapt to evolving traveler expectations, enhance the overall tourist experience, gain a competitive edge, and contribute to sustainable tourism practices in the modern, interconnected world.
In this study, we delve into how cutting-edge digital tools have revolutionized the provision of top-notch tourist services in ancient Babylon. We explore the challenges service providers encounter, the potential offered by digital platforms, and the most effective methods for leveraging technology to deliver exceptional experiences to visitors. This article sheds light on the strategies and approaches that can enhance visitor satisfaction, promote sustainable tourism practices, and ensure that Babylon City remains an alluring destination for future generations. We will delve into what constitutes high-quality tourism service in the modern era and what that means for tourists visiting Babylon City. To achieve this, we will analyze case studies, industry insights, and research findings to comprehensively understand this dynamic landscape and propose concrete solutions for the tourism industry.
In recent years, digital technologies have substantially influenced the tourism industry, enabling new chances for tourism service providers to expand their services and attract new consumers. Going digital is now the norm, and digitization impacts every economic sector, including the travel and tourist sectors. Over the past five years, various world regions have experienced significant changes in the tourism industry driven by digital transformation. For example, there has been a substantial shift towards online booking platforms and mobile applications, making it easier for travelers to plan and customize their trips [11]. The rise of peer-to-peer accommodation services has disrupted the traditional hotel industry, with platforms like Airbnb gaining popularity. This shift has compelled hotels to adopt digital technologies for improved guest experiences, including mobile check-in and concierge services. Moreover, technological advancements empower the accommodation sector and travel destinations to harness the capabilities of data analytics and location-based services to understand tourist behavior, which has undergone dramatic changes in the digital age [12].
Tourist research and booking habits have seen remarkable transformations in recent years, primarily due to the widespread integration of digital technologies into the travel industry. One of the most notable changes is the dominance of online platforms [11]. The internet has become the go-to source for travelers when conducting research for their trips. Utilizing search engines, travel websites, and social media platforms, tourists now have unprecedented access to information about various destinations, accommodations, activities, and transportation options. This digital landscape offers the convenience of comparing prices, reading reviews, and accessing a vast pool of firsthand experiences, empowering tourists to make informed decisions about their travel plans.
Another significant shift is the mobile-first approach that tourists have adopted. The proliferation of smartphones has revolutionized the way people plan and book their journeys. Mobile applications provided by online travel agencies (OTAs), airlines, and hotel chains have made the entire process more accessible and convenient [13]. Travelers can now research, book, and manage their trips on-the-go, thanks to the flexibility offered by these apps. Moreover, mobile devices play a crucial role in navigation, accessing digital tickets, and discovering local attractions and services while traveling.
Digital transformation has led to increased collaboration between the public and private sectors to create smart tourism destinations. Several destinations have implemented digital solutions to manage tourist flows, reduce overcrowding, and enhance sustainability [14]. Additionally, the proliferation of online travel agencies and metasearch engines has intensified competition among service providers, prompting them to focus on delivering exceptional customer experiences. However, the advent of technology in tourism has significantly intensified competition among service providers in the tourism sector, emphasizing the need to increase service quality to remain competitive in the current competitive tourism market.
The importance of providing high-quality services for destinations cannot be overstated. With the rapid evolution of technology, travelers have become more discerning and connected than ever before. They have access to a wealth of information at their fingertips, enabling them to research, plan, and customize their travel experiences to a remarkable degree. As a result, destinations must prioritize the delivery of exceptional services to meet the rising expectations of modern travelers. Quality services play a pivotal role in attracting and retaining tourists. In an era defined by digital connectivity, travelers expect seamless, personalized, and memorable experiences throughout their journeys. Service providers that excel in delivering top-notch services satisfy their customers and create positive word-of-mouth marketing, which can significantly impact a destination's reputation and desirability. A satisfied tourist is more likely to become a repeat visitor and a brand ambassador, promoting the destination to others through social media and online reviews [15]. Accordingly, travel destinations actively seek to invest in technology to maintain their competitive positions and enhance service quality for tourists, which leads to a satisfactory travel experience. These investments are not only geared toward satisfying the rising expectations of modern travelers but also to ensure long-term sustainability and attractiveness in an era defined by digital connectivity and personalized experiences.
Travel destinations are incentivized to invest in tourism due to its substantial contribution to boosting the country's economy. According to the World Tourism Organization's Annual Report, tourism climbed 6% in 2018 over 2017 [16]. The tourism industry has become a subset of all businesses that have received goods and services directly to facilitate interaction, pleasure, and leisure activities. While tourism has benefited the country financially and culturally, it has also been hailed as one of the most important economic engines for growth and development [17]. However, with the changes brought about by digital technology, conventional tourism service providers are failing to match the needs of modern-day tourists [18-20]. As a result, the quality of tourism services has become crucial in attracting and maintaining visitors, and tourism service providers must deliver high-quality services to fulfill tourists' expectations. In this environment, Babylon City, a major tourist destination, must adapt to the changing demands of tourists and provide high-quality tourism services to remain competitive.
Consequently, this research aims to examine the effect that providing tourists with high-quality services in this age of digital transformation has had on Babylon [21]. The study's specific objectives are to identify the digital transformation trends in the tourism industry, explore the impact of digital transformation on tourists' expectations and behavior, assess the quality of tourism services provided in Babylon City, analyze the relationship between the quality of tourism services and tourists' satisfaction, and provide recommendations for improving the quality of tourism services in Babylon City in the era of digital transformation.
More than 10% of worldwide GDP and employment are directly or indirectly attributable to tourism [22-24]. However, new digital technology has reshaped the travel industry, influencing how and what people travel. Modern travelers use their devices to research destinations, book accommodations, and customize every aspect of their trips. In this light, the standard of hospitality offered to tourists is more important than ever [25, 26]. Unfortunately, like many other popular tourist attractions in today's digital age, Babylon City struggles to suit the needs of today's vacationers.
Consequently, this research aims to examine the effect that providing tourists with high-quality services in this age of digital transformation has had on Babylon. This research aims to examine the digital transformation in the tourism industry, evaluate the standard of service offered to visitors in Babylon, and dissect the connection between service quality and customer happiness. The results of this research may be used by policymakers and service providers in Babylon City to better prepare for the digital transformation of the tourism industry.
Overall, this study's findings can give insights into the influence of digital transformation on the tourism industry and the significance of quality tourism service in achieving visitors' expectations. Furthermore, the study's recommendations can enable tourism service providers in Babylon City to enhance the quality of their services to satisfy the needs of modern-day tourists and policymakers to build policies and strategies to support the tourism industry in the digital transformation era.
2.1 Aims and objectives
This study's primary goal is to investigate how visitors to Babylon City are affected by high-quality tourist services in the age of digital transformation. The study's particular goals are as follows:
(1) To determine the tourist sector's digital transformation tendencies.
(2) To investigate how changing technology has affected traveler expectations and behavior.
(3) To evaluate the level of tourist services offered in Babylon.
(4) To provide suggestions on enhancing Babylon City's tourism offerings in the age of the digital revolution.
2.2 Problem statemen
Due to the rapid development of digital technology, the tourism industry in Babylon City confronts several difficulties. Conventional tourism service providers have difficulty providing the smooth and individualized experiences that today's travelers seek. As a result, Babylon City's ability to deliver high-quality tourism services has become essential for drawing in and keeping tourists. Hence, it is necessary to look at how visitors to Babylon City are affected by high-quality tourism services in the age of digital transformation. Since the primary offering in the tourist sector is a service, intangibility is a distinguishing feature of the sector [27, 28]. Attraction qualities of a destination are multifaceted tourist offerings with various contexts and dimensions. Therefore, the information provided to tourists by the sector must be of high quality. More and more travelers are turning to the internet for travel research because digital information is integral to modern life. An integral element of modern life for the vast majority of individuals.
2.3 Study rationale
The study is critical because it shows how the digital revolution has affected the tourism sector and how well-run tourism operations contribute to exceeding visitors' expectations. The results of this study can assist Babylon City's tourism service providers in raising the caliber of their offerings to satisfy the needs of contemporary tourists. Moreover, the study might offer policymakers suggestions for crafting plans and strategies to help the tourism sector in the age of digital transformation. Overall, this research can help the tourism sector in Babylon City thrive sustainably.
3.1 Digital impacts in tourism
Rapid developments in digital technology have profoundly impacted the travel industry. The digital transformation trends in the tourism industry include the usage of mobile devices, social media, big data, artificial intelligence (AI), and the Internet of Things (IoT) [29-31].
The utilization of digital technologies, including mobile devices, social media, big data, artificial intelligence (AI), and the Internet of Things (IoT), has the potential to significantly impact the tourism industry. These technologies offer avenues for market identification, the creation of novel tourism products, the adaptation of existing offerings, and the establishment of innovative customer connections [32]. Such innovations are made feasible through digitalization, with various technological tools such as AI, IoT, robotization, gamification, big data, and cloud computing enabling diverse forms of transformation [32].
Digital technology also plays a crucial role in fostering sustainable development in tourist attractions, especially natural geomorphosites [33]. A sophisticated methodology centered on identifying criteria influencing geomorphosite tourism development can be employed to evaluate the current degradation status and formulate sustainable development proposals from a geomorphological perspective.
Another noteworthy impact of digital transformation in the tourism sector, particularly within the food industry, pertains to its influence on food as a cultural phenomenon for destination branding and stakeholder engagement in culinary tourism [32]. This technological shift allows for the expansion of the existing framework on stakeholder causal scope analysis in culinary tourism, facilitating an examination of the current landscape and exploration of future research agendas and practical implications. However, the following are the significant conclusions from the literature review:
(1) Mobile Devices: The growing usage of mobile devices has revolutionized how tourists plan and schedule their vacations. Tourists utilize mobile devices to look for travel information, make bookings, and discuss their trip experiences on social media platforms [34].
(2) Social Media: Social media platforms have become vital to the tourism industry; tourists utilize social media platforms to discuss their travel experiences, seek advice from other travelers, and communicate with tourism service providers [35].
(3) Big Data: Big data and AI are used to evaluate tourists' behavior and preferences, giving tourism service companies insights to design tailored client experiences. Tourism service providers may utilize AI and big data to study travelers' behavior and interests, delivering tailored suggestions for tourist sites, housing, and cuisine [36].
(4) Artificial Intelligence (AI): AI is utilized in the tourism industry to deliver customized suggestions to tourists [30]. AI-powered chatbots may give tourists real-time support, helping them plan their travels, make bookings, and obtain information about tourist attractions.
(5) Internet of Things (IoT): The IoT is utilized to develop intelligent tourism destinations where tourists may get real-time information on tourist sites and services. Intelligent tourism destinations may assist tourists in making their way through new regions and give customized suggestions based on tourists' tastes [25].
The literature analysis reveals that digital transformation trends in tourism alter visitors' expectations and behavior. Therefore, tourism service providers must leverage digital technology to tailor their services to satisfy tourists' expectations. Therefore, the study's findings can give insights into the influence of digital transformation trends in the tourism industry on visitors to Babylon City and aid tourism service providers and policymakers in designing strategies to improve the quality of tourism services in Babylon City.
3.2 Changing tourist behaviors
The influence of digital transformation on visitors' expectations and behavior has been extensively researched in the literature. For example, digital transformation has altered tourists' behavior in the tourism sector. Mobile devices have become indispensable tools for travelers, serving various purposes such as information retrieval, reservations, and social media sharing [37, 38]. The pervasive use of mobile devices holds the potential to revolutionize the entire tourism industry by creating new opportunities across all sectors of the economy [37]. The Technology Acceptance Model (TAM) offers valuable insights into the relationship between travelers using smartphone travel applications (Apps) and their perceived usefulness, ease of use, usage attitude, usage intentions, and information search behavior [37]. However, the following are the significant conclusions from the literature review:
(1) Personalization: Tourists want individualized experiences, and digital technologies enable tourism service providers to create tailored services to fit tourists' requirements and preferences. Tourists utilize digital technology to search for information, make bookings, and discuss their trip experiences [39]. Therefore, tourism service providers may use this data to customize their services.
(2) Seamless experiences: Tourists want seamless experiences where they may access information and services smoothly across numerous devices and platforms. Tourists utilize mobile devices and social media platforms to obtain travel information, make bookings, and discuss their experiences [40]. Therefore, tourism service providers must create seamless experiences across these platforms to match tourists' expectations.
(3) Real-time information: Tourists want real-time information on tourist sites, hotels, and cuisine, and digital technologies enable tourism service providers to give this information. Intelligent tourism destinations employ the IoT to give real-time information on tourist attractions and services [41].
(4) Social sharing: Social media platforms have become a vital element of the tourism experience, enabling tourists to share their experiences with others and seek advice from other travelers. Social media platforms enable tourists to share their experiences, seek advice, and communicate with tourism service providers [42]. Therefore, tourism service providers must engage with tourists on social media platforms to enhance their services.
(5) Internet reviews: Online reviews have become a crucial source of information for tourists, impacting their decisions on tourist sites, housing, and cuisine. Internet reviews impact travelers' decisions, and tourism service providers must manage their online reputation to attract tourists [43].
The literature analysis reveals that digital technologies have affected visitors' expectations and behavior. Therefore, tourism service providers must employ digital technologies to deliver personalized and seamless experiences and give real-time information to match tourists' expectations. The study's findings can give insights into the influence of digital transformation in the tourism industry on visitors to Babylon City and aid tourism service providers and policymakers in designing strategies to improve the quality of tourism services in Babylon City.
3.3 Tourism service quality
The quality of tourism services has been thoroughly investigated in the literature. Tourism service quality is a crucial aspect of the travel and hospitality industry, encompassing various dimensions that directly impact travelers' experiences. These dimensions, as identified in the literature, include tangibles, dependability, responsiveness, assurance, and empathy [44]. These serve as fundamental benchmarks for evaluating and enhancing the quality of tourism services. Customer happiness and satisfaction are at the core of this assessment, as higher service quality is intrinsically linked to increased customer satisfaction [44]. Ensuring that tourists' needs and expectations are not only met but exceeded is imperative for tourism service providers [45]. Furthermore, service recovery mechanisms play a vital role in preserving customer satisfaction, as they enable providers to address and rectify service failures promptly [45]. Beyond these internal factors, the perception of a destination's image also influences travelers' impressions of service quality [46]. For destinations to thrive in the competitive tourism landscape, they must manage and control their image effectively to attract and retain visitors [45, 46]. Ultimately, a focus on tourism service quality is not only a strategic imperative for service providers but also a key factor in enhancing the overall experience of tourists and promoting sustainable tourism growth [44, 46]. Travelers use mobile devices to look for information, make reservations, and post about their experiences on social media [47, 48]. The use of mobile devices can revolutionize the tourism industry by creating new opportunities for every sector of the economy [47]. However, the following are the significant conclusions from the literature review:
(1) Service quality dimensions: The service quality dimensions constitute a significant aspect in assessing the quality of tourism services. The five pillars of service quality in the tourism industry are tangibles, dependability, responsiveness, assurance, and empathy [49].
(2) Customer happiness: Customer satisfaction is essential in determining the quality of tourism services. Consumer satisfaction is determined by the quality of tourism services, and tourism service providers need to focus on enhancing service quality to boost customer satisfaction [50].
(3) Service recovery: Service recovery is vital in preserving client happiness in tourism. Service recovery may allow tourism service providers to regain consumers' confidence following service failures, and it is vital for increasing the quality of tourism services [51].
(4) Employee training: Employee training is vital for increasing the quality of tourism services. Employee training may increase the quality-of-service delivery and enhance customer satisfaction [52].
(5) Destination image: The destination image is a significant aspect of assessing the quality of tourism services. The destination image impacts travelers' impressions of the quality of tourism services, and tourism service providers need to control the destination image to attract tourists [53].
The literature review shows that the quality of tourism services is affected by factors such as customer satisfaction, service recovery, staff training, and the destination's reputation. Therefore, the study's results can help tourism service providers and policymakers build strategies to improve the quality of tourism services in Babylon City, which can give insights into the value of quality tourism services in improving the experience of visitors to Babylon City.
The most commonly used measure of how customers feel about a company's service is the SERVQUAL instrument developed by Parasuraman et al. [54]. SERVQUAL is a multi-item instrument designed to quantify the gap between a customer's perception of the quality of service they received and their expectations. Parasuraman et al. [54] proposed ten dimensions of service quality as shown in Table 1:
Table 1. The ten dimensions of service quality
|
No. |
Dimension |
Definition |
|
1 |
Reliability |
Dependability and consistency of service performance |
|
2 |
Security |
Freedom from danger, risk, or doubt |
|
3 |
Tangibles |
Physical evidence of the service |
|
4 |
Responsiveness |
Employee's readiness to render services |
|
5 |
Creditability |
Honesty, reliability, and plausibility |
|
6 |
Competence |
Having the abilities and expertise necessary |
|
7 |
Access |
Accessibility and simplicity of contract |
|
8 |
Courtesy |
Employee's politeness, respect, concern, and friendliness |
|
9 |
Communications |
Providing information to clients in a language they can understand and paying attention to them |
|
10 |
Understanding |
Understanding customer needs, providing individualized attention |
The SEVQUAL model analyses the quality of the services provided by various tourism-related industries, including the airline, sports, and dining sectors. These gaps were:
Gap 1: Customer expectation - management perception gap
Sometimes, service providers may lack the information necessary to provide their customers with the features and levels of performance they expect. Customers' perceptions of the quality of those services are affected.
Gap 2: Management perception - service quality specification gap
A chasm forms between a business and its customers when the latter knows what the latter wants but fails to provide it. Several factors may have contributed to this discrepancy, including insufficient resources, bad market conditions, or apathetic management. The client's perceptions of value may be skewed in light of these considerations.
Gap 3: Service quality specifications – service delivery gap
Companies may have policies for handling consumer complaints and providing superior service, but this does not guarantee quality. Even if providing a good impression of the service to customers is crucial, it is impossible to standardize employee performance. This affects how services are delivered, affecting how customers rate those services.
Gap 4: Service delivery – external communications gap
External messaging can affect both the expectations of and satisfaction with customer service. If customers are not aware of the extra steps a business takes to guarantee the high quality of its products and services, they may have different ideas about the value of those measures.
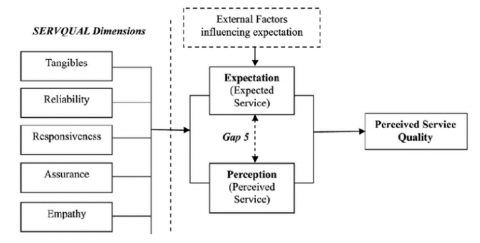
Gap 5: Expected service – perceived service gap
They concluded that the secret to offering high-quality services is doing everything it takes to meet or surpass customers' expectations. The quality of service is judged based on how clients rate its performance relative to their expectations. The SERVQUAL model, developed by Parasuraman et al. [54] in 1988, is a multi-item scale used to evaluate how well a business is doing in terms of its customers' views of the quality of the service they receive. The scale classifies businesses based on how well they perform in five categories related to customer care: sympathy, confidence, dependability, and promptness. It is predicated on the idea that a customer's overall satisfaction is directly proportional to the degree to which their expectations exceed, or are at parity with, their actual experiences. To a greater extent than SERVQUAL, the SERVPERF model implicitly analyses customer experience based on the same criteria as SERVQUAL, consistent with the implications of satisfaction and attitude research [55]. Furthermore, Teas [56] later developed the assessed performance model to deal with problems caused by the conceptualization gap of service quality [54]. However, Figure 1 shown below illustrates the service quality measurement using SERVQUAL model.
Figure 1. Measuring service quality using SERVQUAL model [57]
The SERVQUAL methodology was developed to analyze customer service quality ratings [54]. Moreover, this is critical for long-term growth and profitability. They also require that we attempt to quantify the relative importance of each dimension when implementing the model. Parasuraman et al. [54] advise that a corporation use this model thrice to assess its service quality over time, identify differences between perceived and actual services, and determine the appropriate response. Additionally, they urge that the model be used in conjunction with other models. For example, in a retail organization, another model may be used to assess employees' perceptions of service quality and elicit recommendations from these employees on enhancing the quality of their services. Although some needs are difficult (or possibly impossible) to examine because they are outside the conscious consciousness of the investigated person (Oliver's Expectancy Disconfirmation and Attribution), the Choice of Theories and techniques helps try to understand the complexity of human wants.
Numerous theoretical models for evaluating consumer satisfaction have been proposed in the tourist literature [58]. The expectancy confirmation model by Oliver [59] is one such model that compares consumer expectations to performance. Emotional satisfaction occurs when performance exceeds expectations; if the contrary is true, emotional discontent results. If tourists' expectations about a destination match what they see, feel, and accomplish when they arrive, they will be satisfied [60]. Chon [60] found that the degree to which a tourist's expectations match what they see, feel, and accomplish at their destination will determine their satisfaction. In the tourism and hospitality industries, the performance-based approach has a better association with tourist satisfaction when it comes to tourism [61]. Empirical investigations have demonstrated that the performance-only technique is more reliable and valid than other approaches, such as disconfirmation and expectation performance, which require expectation. Furthermore, this method optimizes predicting future consumer behavior and overall Satisfaction [62].
Additionally, importance performance analysis is the primary technique utilized in this study to examine the components of the tourism industry, as consumer happiness is a consequence of expectations about specific critical attributes and judgments about attribute performance. Additionally, several academics evaluated the standards used to assess service quality and satisfaction. As a result, they developed alternative service quality and satisfaction measures [63]. Satisfaction must be a fundamental criterion for evaluating tourism products and services. Satisfaction has been a critical factor in developing tourism products and services. Tourism satisfaction is critical for successful destination marketing since it affects destination selection, product and service consumption, and the decision to return [64].
This study examines the factors influencing whether service delivery meets, exceeds, or falls short of expectations. For example, the expectancy disconfirmation hypothesis describes the quality of service. The study aims to investigate attribution theory to understand the causes or factors that lead to a particular outcome for a service to determine the underlying reason or explanation for a particular result or incident. Service users act as psychologists in an attribution study. In other words, attributions are human descriptions of things in a non-scientific language known as naive psychology. According to Heider [65], who says that it considers the concepts related to positioning behaviour within a cause-and-effect relationship, attribution theory may be traced back to that year. When we interpret events as arising from specific elements within a relatively consistent environment, as mentioned in reference [65], it can be considered as engaging in the process of attribution. As a result, the attribution theory outlines a scenario in which the person is "driven to gain a cognitive mastery of the causal structure to his environment". For these reasons, the ten-item original SERVQUAL model's dimensions are used in the current study.
3.4 Relationship between the quality of tourism services and tourists' satisfaction
Numerous studies have examined the correlation between service quality in the tourism industry and customer happiness. The most important findings of the research are as follows:
(1) Contentment with the service received: A tourist's satisfaction is directly related to the quality of the services they receive. Therefore, service quality is a significant factor in how satisfied a tourist is [66]. Customer satisfaction levels rise as service quality improves and fall when it declines.
(2) Dimensions of service quality and clients' happiness: Customer happiness is heavily impacted by the various characteristics of service excellence [67] claim that tangibles, reliability, responsiveness, assurance, and empathy are the five characteristics of service quality that matter most to customers in the tourism business. When these aspects of service are excellent, customers are more satisfied overall.
(3) Destination image and customer satisfaction: The destination image also significantly impacts customer satisfaction. According to Hossain et al. [68], the destination image influences tourists' perceptions of the quality of tourism services and is positively related to customer satisfaction. A favorable destination image leads to increased consumer satisfaction, whereas a negative image leads to lower customer satisfaction.
(4) Service recovery and customer satisfaction: Service recovery is critical in maintaining customer satisfaction in tourism. According to Kelley and Davis [69], good service recovery may boost customer satisfaction following service failures, whereas poor service recovery can lead to reduced customer satisfaction.
(5) Employee training and customer satisfaction: Employee training is vital for increasing the quality of tourism services and raising consumer happiness. Employee training may increase the quality-of-service delivery and enhance customer satisfaction [52].
Previous literature reveals that the quality of tourism services is critical in determining tourists' pleasure. The service quality dimensions, destination image, service recovery, and employee training are critical factors influencing tourist satisfaction. The study's findings can provide insights into the relationship between the quality of tourism services and tourists' satisfaction in Babylon City and help tourism service providers and policymakers to develop strategies to improve the quality of tourism services and enhance customer satisfaction in Babylon City.
Lastly, based on the review of the literature written in this section, it can be concluded that while previous literature discusses various aspects of tourism service quality and its relationship with customer satisfaction, there is a limited exploration of the role of technology and digital platforms in influencing tourists' satisfaction and service quality. Specifically, the impact of digital transformation, such as mobile apps or online reviews, on tourists' perceptions of service quality remains unaddressed. In addition, there is a lack of emphasis on the influence of cultural and societal factors on tourists' satisfaction, which highlights a research gap in how cultural differences and societal norms affect tourists' expectations and evaluations of service quality, particularly in a diverse and multicultural tourism environment like Babylon City. Based on the provided information, the conceptual framework of the study has been designed as depicted in Figure 2.
Figure 2. The framework of the study
This research delves into the role of quality tourism services during the era of digital transformation, mainly focusing on local visitors to Babylon City. The study aims to investigate the impact of digital transformation on the quality of tourism services and to examine the relationship between the quality of these services and visitors' satisfaction. This empirical investigation adapted the SERVQUAL model. Considering the SERVQUAL model, data collection was divided into two stages. The first phase involves gathering data from respondents before they visit the destination. During this phase, participants share their expectations regarding statements representing ten service quality dimensions: Reliability, Security, Tangibles, Responsiveness, Credibility, Competence, Access, Courtesy, Communications, and Understanding. The second stage entails collecting data from the same group of tourists about their perceptions of the same set of statements under the ten SERVQUAL dimensions. Some respondents completed the expectation part (data collection phase one) just before arriving at the destination, while others did so after their arrival. The performance data collection phase (data collection phase two) occurred after the respondents' visits were completed. In the following, the SERVQUAL questionnaire tablet is presented in Figure 3.
Figure 3. SERVQUAL questionnaire template
This study primarily relies on gathering primary data using a self-administered questionnaire. Convenience sampling was chosen for this study, as it involves selecting willing and easily accessible participants. The measurement items used in this study were constructed based on existing literature, specifically adopted from previous studies, to evaluate the expectations and experiences related to ten dimensions of service quality. A Likert scale of 1 to 5 was used for all items to measure the visitors' Perceptions and expectations of the quality of tourism services in Babylon City. A score of 1 indicates an inferior quality of service, while a score of 5 indicates a very high quality of service. Both data collection phases took place in Babylon between February 2022 and December 2022. The study included male and female tourists aged 18 years old and above as participants. A total of 423 surveys were distributed, out of which 403 were returned, and 315 participants completed the questionnaires accurately. Although the number of useful responses is considered low, this response rate is 74.5 percent, which is considered a satisfactory response rate for survey research [70]. However, Table 2 below displays the response rate from the questionnaire distribution.
Table 2. Rate of questionnaire distribution
|
Response Frequency/Rate |
Data |
|
Distributed questionnaires |
423 |
|
Returned |
403 |
|
Returned and usable |
315 |
|
Returned and unusable |
108 |
|
Response rate % |
95.3% |
|
Rate of usable responses % |
74.5% |
The data analysis in the current study was conducted using SPSS software. SPSS was utilized for various purposes, including performing the reliability test to assess Cronbach's alpha for the measurement items. Additionally, SPSS was employed for conducting frequency analysis on the demographic profiles of the respondents. The remaining data analysis techniques, as outlined in the following sections, such as paired-sample t-tests, one-sample t-tests, and others, were also carried out using SPSS software.
Table 3. Demographic statistics of the respondents
|
Variable |
Frequency |
Percentage (%) |
|
Gender |
||
|
Male Female Total |
230 85 315 |
73.0 27.0 100.0 |
|
Age |
||
|
(18–24) (25–34) (35–44) (45–54) (55–64) Total |
4 75 129 72 35 315 |
1.3 23.8 41.0 22.9 11.1 100.0 |
|
Married status |
||
|
Single Married Divorced |
62 241 12 |
19.7 76.5 3.8 |
|
Education |
||
|
Primary School Intermediate School Secondary School Certificate Diploma Bachelor's degree Master's degree / Ph.D. Total |
17 35 130 3 99 31 315 |
5.4 11.1 41.3 1.0 31.4 9.8 100.0 |
|
Frequency of visits |
||
|
1st time 2nd time 3rd time 4th time and above Total |
62 109 70 74 315 |
19.7 34.6 22.2 23.5 100.0 |
The data shown in the Table 3 describes the population concerning gender, age, marital status, level of education, and the number of visits. Meanwhile, 73% of the sample is male and 27% female, suggesting that men make up most local travelers. Respondents aged 35-44 equals 41.0%, which is considered the highest among all the age categories. Conversely, the percentage of respondents aged 18-24 was the lowest, with only 1.3% of the total respondents. Those between the ages of 25 and 34 account for 23.8%, while participants aged 45-54 make up 22.9%. However, the percentage of respondents aged 55 and more was 11.1%. However, the frequency of single respondents is 62, which corresponds to a percentage of 19.7%. This means that out of the total sample of 315, 62 individuals reported being single. The frequency of divorce among respondents is 12, corresponding to a percentage of 3.8%. Lastly, most of the sample reported being married with 241 individuals, which equals a percentage of 76.5%. In terms of education, most respondents hold a secondary school qualification, comprising 41.3% of the total sample. Following closely behind are those with a bachelor's degree, constituting 31.4% of the sample. The data also reveal that a significant portion of respondents possess an intermediate school education (11.1%), while a smaller percentage have completed primary school (5.4%). Additionally, there are respondents with certificate diplomas (1.0%) and those with master's or Ph.D. degrees (9.8%). This educational breakdown underscores the diversity within the sample, reflecting a range of educational backgrounds. Lastly, the table showcases the number of times respondents have visited the destination. Remarkably, the largest group of tourists, comprising 34.6% of the sample, has visited Babylon for the second time. The second most common category of visitors includes those on their fourth visit or more, accounting for 23.5%. Meanwhile, 22.2% of respondents have visited Babylon for the third time, while 19.7% are first-time visitors. This distribution highlights the prevalence of repeat visitors to Babylon, suggesting that the destination holds a strong appeal for individuals who choose to return. Overall, the table provides valuable insights into the education levels and travel behaviors of the surveyed individuals, offering a comprehensive snapshot of the sample's demographic characteristics and their relationship with their visitation patterns.
5.1 Expected versus perceived service quality of tourists
The service quality offered to tourists was evaluated using ten dimensions: reliability, security, tangibles, responsiveness, credibility, competence, access, courtesy, communications, and understanding. In addition, the reliability test was used to examine the degree of agreement between separate measurements of the study's variables. The alpha value of 0.8335 suggests that the items in the survey are internally consistent and measure the same construct, as shown in Table 4. The table provides reliability statistics for different service quality dimensions in a study. Reliability is an essential aspect of research, as it reflects the consistency and stability of the measurements. In this study, the researchers have used Cronbach's alpha as a measure of reliability. Indicating how well the items on a scale or instrument assess the same construct, Cronbach's alpha is a statistical measure of internal consistency. The value can be anywhere from 0 to 1, with 1 representing perfect consistency.
Table 4. Reliability statistics of study dimensions
|
Dimensions |
Alpha Value |
No of Items |
|
Expected |
0.890 |
30 |
|
Perception |
0.777 |
30 |
|
Total |
0.8335 |
60 |
The service quality of pre-arrival services was measured using the ten sub-dimensions of Expectations before visiting (with 30 items) and perception after visiting (with 30 items). Unfortunately, all perceived service quality parameters have mean values below the expected level, as shown in Table 4. Consequently, there is a statistically significant gap between the two service quality measures, as shown by the results of an independent sample t-test. This table shows that the expected dimension has the highest reliability, with an alpha value of .890. This indicates that the items in this dimension are highly consistent in measuring the same construct: the customers' expectations of the service they receive. On the other hand, the perception dimension has a slightly lower reliability, with an alpha value of .777. This suggests that the items in this dimension may not be as consistent in measuring the customers' actual perception of the service.
The total dimension, which combines both expected and perception dimensions, has an alpha value of 0.8335. This indicates that the overall reliability of the scale is good, as it reflects the consistency of the measurements across both dimensions. It is also worth noting that the number of items in each dimension is the same, with 30 items in each. This suggests that the researchers have tried to maintain consistency in the number of items across dimensions, which helps to ensure that each dimension is measured with equal precision. Overall, this table provides valuable information about the reliability of the measurements taken in this study, which is essential for understanding the validity and generalizability of the results.
5.2 SERVQUAL tourist expectations and perceptions
Table 5 displays the respondents' views on what constitutes high-quality service. The table of SERVQUAL scores shows that six items have negative signals, indicating that expectations are higher than performance, leading to a service quality gap and, ultimately, less-than-satisfactory perceived quality. The table shows the descriptive statistics of 30 items (10 variables). Deviation shows the data's degree of variability or dispersion around the mean.
Even though the SERVQUAL score for items credibility, responsiveness, competence, communication, and understanding are harmful, according to the paired samples t-test, means of perception and expectation do not significantly differ in the reliability, access, courtesy, security, and security tangibles. Babylon tourist destinations fall short of expectations.
Table 5 shows the mean scores for various attributes, comparing the expected mean with the perception means and the difference between them. The t-value and significance level are also provided, which can indicate whether the mean difference is statistically significant. Attributes included in the table: There is a discrepancy of 0.1085 between the mean perceived score of 3.8354 and the mean predicted score of 3.9439 for reliability. In this case, the t-value of 1.638 is significant (at the 0.05 level). There is a discrepancy of 0.0317 between the mean perceived score of 2.7937 and the mean predicted score of 2.8254 for responsiveness. The t-value of 0.589 is significant at the 5% level of probability. The gap between the expected and observed means of competence is -0.0043 (or 2.9407 and 2.945, respectively). The t-value of -0.032 is insignificant at the 5% confidence level. There is a discrepancy of 0.0138 between the expected and perceived means of access (mean = 3.563, median = 3.5492). At the 5% significance level, the t-value of 0.085 is insignificant. There is a discrepancy of 0.0222 between the mean perceived score and the mean predicted score for courtesy (3.3365 versus 3.3143). At the 5% significance level, the t-value of 0.559 is insignificant. The mean score for communication (2.9503) and the mean score for perception (3.0709) is -0.1206, indicating poor communication. The t value of -2.079 is insignificant at the 5% confidence level. Regarding believability, the average perceived score is 3.0593, whereas the predicted score is 2.8571 (a difference of -0.2022). At the 5% significance level, the t-value of -3.483% is significant. There is a discrepancy of -0.3322 between the predicted and perceived mean scores of 2.1556 and 2.4878 in safety and security. The t-value of -5.76 is significant at the 05 level of analysis. The average score for perception was 3.1206, whereas the average score for understanding/knowing was 3.0466, for a difference of -0.074. At the 5% significance level, the t-value of -1.167 is insignificant. The average perceived score is 2.4317, while the average expected score is 2.1471. This yields a discrepancy of -0.2846. In this case, the t-value of -3.913 is significant (at the 0.05 level).
MTOTAL: The expected mean score for MTOTAL is 2.9766, while the mean perception score is 3.0608, indicating a difference of -0.0842. The t-value is -2.552, which is not statistically significant at the 0.05 level. The table suggests differences between the expected mean and perception mean scores for specific attributes. Statistically significant differences can indicate areas where improvements are made. However, for each variable, descriptive statistics provide information on the central tendency and spread of the data. These statistics can be used to compare variables and draw inferences about the characteristics of the data. For example, if the data are widely dispersed about the mean, the standard deviation will be considerable; if the observations are densely grouped around the mean, then the standard deviation will be slight. Using the table, we can see how each variable is distributed among the whole data set. The table is helpful since it summarizes the data distribution for each variable and allows us to rapidly compare and contrast them in terms of central tendency and variability.
Table 5. Expectation versus perception service quality in Babylon
|
Attributes |
Expectation |
Perception |
Means Difference |
t-value |
Sig |
|
Reliability |
3.9439 |
3.8354 |
0.1085 |
1.638 |
0.000 |
|
Responsiveness |
2.8254 |
2.7937 |
0.0317 |
0.589 |
0.002 |
|
Competence |
2.9407 |
2.945 |
-0.0043 |
-0.032 |
-0.015 |
|
Access |
3.563 |
3.5492 |
0.0138 |
0.085 |
0.000 |
|
Courtesy |
3.3365 |
3.3143 |
0.0222 |
0.559 |
0.000 |
|
Communication |
2.9503 |
3.0709 |
-0.1206 |
-2.079 |
0.176 |
|
Credibility |
2.8571 |
3.0593 |
-0.2022 |
-3.483 |
-0.294 |
|
Safety and Security |
2.1556 |
2.4878 |
-0.3322 |
-5.765 |
0.000 |
|
Understanding/Knowing |
3.0466 |
3.1206 |
-0.074 |
-1.167 |
0.416 |
|
Tangibles |
2.1471 |
2.4317 |
-0.2846 |
-3.913 |
0.000 |
|
MTOTAL |
2.9766 |
3.0608 |
-0.0842 |
-2.552 |
0.453 |
The t-value for reliability is 1.638, which is positive, indicating that it is a statistically significant factor in the evaluation. A higher score suggests that the dimension may be counted on to deliver steady performance. In contrast to the reliability, responsiveness (t-value: 0.589) is statistically significant, albeit to a lower extent. It implies that the organization quickly responds to visitors' questions and concerns.
In summary, this analysis provides insights into the significance and impact of various attributes based on their respective t-values. It reveals the areas where the dimensions excel (reliability, responsiveness, courtesy) and the areas that require improvement (communication, credibility, safety, security, understanding/knowing, tangibles). Nevertheless, the subsequent Figure 4 offers insights into the variability of t-values across the ten dimensions under consideration.
Figure 4. t-value of paired sample t-test
5.3 One-sample test of expectation
Table 6 shows the results of a one-sample test for various dimensions of tourist satisfaction with service. The test value for each dimension is 3, which means the null hypothesis is that the mean satisfaction score for that dimension equals 3. The "t" column shows the calculated t-statistic for each dimension, which measures the difference between the observed mean score and the hypothesized mean score (in this case, 3) in terms of the standard error of the mean. The larger the absolute value of the t-statistic, the more evidence there is against the null hypothesis. The "df" column represents the degrees of freedom, the number of observations minus the estimated parameters. In this case, it appears there are 314 degrees of freedom.
Table 6. One-sample test of expectation
|
|
Test Value = 3 |
|||||
|
Dimension |
T |
Df |
Sig. (2-tailed) |
Mean Difference |
95% Confidence Interval of the Difference |
|
|
Lower |
Upper |
|||||
|
Reliability |
17.063 |
314 |
.000 |
.94392 |
.8351 |
1.0528 |
|
Responsiveness |
-3.091 |
314 |
.002 |
-.17460 |
-.2857 |
-.0635 |
|
Competence |
-1.043 |
314 |
.298 |
-.05926 |
-.1711 |
.0526 |
|
Access |
10.010 |
314 |
.000 |
.56296 |
.4523 |
.6736 |
|
Courtesy |
7.286 |
314 |
.000 |
.33651 |
.2456 |
.4274 |
|
Communication |
-.850 |
314 |
.396 |
-.04974 |
-.1649 |
.0654 |
|
Credibility |
-2.463 |
314 |
.014 |
-.14286 |
-.2570 |
-.0287 |
|
Safety and Security |
-13.852 |
314 |
.000 |
-.84444 |
-.9644 |
-.7245 |
|
Understanding |
.713 |
314 |
.477 |
.04656 |
-.0820 |
.1751 |
|
Tangibles |
-17.042 |
314 |
.000 |
-.85291 |
-.9514 |
-.7544 |
|
MTOTAL |
-.656 |
314 |
.512 |
-.02339 |
-.0935 |
.0467 |
The "Sig. (2-tailed)" column shows the p-value associated with each t-statistic, which is the probability of observing a t-value as extreme or more extreme than the observed t-value, assuming the null hypothesis is actual. A small p-value (typically less than 0.05) indicates strong evidence against the null hypothesis and suggests that the observed mean score significantly differs from the hypothesized mean score of 3. The "Mean Difference" column shows the difference between the observed mean score and the hypothesized mean score (in this case, 3), which is positive for dimensions where the observed mean score is higher than three and negative for dimensions where the observed mean score is lower than 3.
The "95% Confidence Interval of the Difference" column shows the range of values likely to contain the actual difference between the observed and the hypothesized mean scores with 95% confidence. If this interval does not include 0, the difference is statistically significant at 0.05. Overall, customer satisfaction scores appear significantly higher than the hypothesized value of 3 for most dimensions, except for Competence and Understanding/Knowing. However, it is essential to consider the context and specific details of the study to understand and interpret these results fully.
5.4 One sample t-test of perception
Table 7 presents the results of a one-sample t-test, a statistical test used to determine whether a sample mean is significantly different from a known or hypothesized value. In this case, the known or hypothesized value is 3, and the sample means represent participants' perceptions of various aspects of service.
Table 7. One-sample t-test perception
|
|
Test Value = 3 |
|||||
|
Dimension |
T |
Df |
Sig. (2-tailed) |
Mean Difference |
95% Confidence Interval of the Difference |
|
|
Lower |
Upper |
|||||
|
Reliability |
15.425 |
314 |
.000 |
.83545 |
.7289 |
.9420 |
|
Responsiveness |
-3.680 |
314 |
.000 |
-.20635 |
-.3167 |
-.0960 |
|
Competence |
-1.011 |
314 |
.313 |
-.05503 |
-.1622 |
.0521 |
|
Access |
9.925 |
314 |
.000 |
.54921 |
.4403 |
.6581 |
|
Courtesy |
6.727 |
314 |
.000 |
.31429 |
.2224 |
.4062 |
|
Communication |
1.229 |
314 |
.220 |
.07090 |
-.0426 |
.1844 |
|
Credibility |
1.020 |
314 |
.308 |
.05926 |
-.0550 |
.1736 |
|
Safety and Security |
-8.087 |
314 |
.000 |
-.51217 |
-.6368 |
-.3876 |
|
Understanding |
1.880 |
314 |
.061 |
.12063 |
-.0056 |
.2469 |
|
Tangibles |
-13.129 |
314 |
.000 |
-.56825 |
-.6534 |
-.4831 |
|
MTOTAL |
1.896 |
314 |
.059 |
.06085 |
-.0023 |
.1240 |
Test Value: This is the hypothesized value, which is 3 in this case. T: This column shows the calculated t-value for each test. A larger absolute t-value indicates a greater difference between the sample mean, and the hypothesized value, and a smaller p-value (see below) indicates stronger evidence against the null hypothesis. Df: This column shows the degrees of freedom for each test. Degrees of freedom represent the number of independent observations in the sample and are used to calculate the t-value. Sig. (2-tailed): This column shows the p-value for each test, representing the probability of obtaining a t-value as extreme or more extreme than the observed value, assuming the null hypothesis is true. A p-value less than .05 is typically considered statistically significant, indicating that the sample mean differs significantly from the hypothesized value.
Mean Difference: This column shows the difference between the sample mean and the hypothesized value. 95% Confidence Interval of the Difference: This column shows the range of values within which the actual population mean difference is likely to fall, with 95% confidence. The results show that several of the tests have very low p-values, indicating strong evidence that the sample mean is significantly different from the hypothesized value of 3. Specifically, the tests for Reliability, Responsiveness, Competence (second test), Courtesy, Security, Understanding/Knowing, and Tangibles all have p-values less than .05, indicating participants' perceptions of these aspects of the service are significantly different from the hypothesized value.
On the other hand, the tests for Competence (first test), Communication, and Credibility all have p-values greater than .05, indicating that there is no strong evidence that participants' perceptions of these aspects of the service are significantly different from the hypothesized value. Finally, the test for MTOTAL has a p-value of .059, which is just above the typical threshold for statistical significance. This suggests that there may be some evidence of a difference between participants' overall perception of the service and the hypothesized value of 3. However, it is not strong enough to reach statistical significance at the .05 level.
Table 8. Differences between the frequency of visits and sample response during the expected period
|
Dimension |
|
Sum of Squares |
Df |
Mean Square |
F |
Sig. |
|
Reliability |
Between Groups |
16.238 |
3 |
5.413 |
5.877 |
.001 |
|
Within Groups |
286.438 |
311 |
.921 |
|
|
|
|
Total |
302.676 |
314 |
|
|
|
|
|
Responsiveness |
Between Groups |
2.290 |
3 |
.763 |
.758 |
.519 |
|
Within Groups |
313.329 |
311 |
1.007 |
|
|
|
|
Total |
315.619 |
314 |
|
|
|
|
|
Competence |
Between Groups |
4.362 |
3 |
1.454 |
1.435 |
.233 |
|
Within Groups |
315.199 |
311 |
1.014 |
|
|
|
|
Total |
319.560 |
314 |
|
|
|
|
|
Access |
Between Groups |
9.440 |
3 |
3.147 |
3.226 |
.023 |
|
Within Groups |
303.395 |
311 |
.976 |
|
|
|
|
Total |
312.835 |
314 |
|
|
|
|
|
Courtesy |
Between Groups |
2.120 |
3 |
.707 |
1.052 |
.370 |
|
Within Groups |
208.877 |
311 |
.672 |
|
|
|
|
Total |
210.997 |
314 |
|
|
|
|
|
Communication |
Between Groups |
.911 |
3 |
.304 |
.279 |
.840 |
|
Within Groups |
337.977 |
311 |
1.087 |
|
|
|
|
Total |
338.887 |
314 |
|
|
|
|
|
Credibility |
Between Groups |
2.616 |
3 |
.872 |
.821 |
.483 |
|
Within Groups |
330.178 |
311 |
1.062 |
|
|
|
|
Total |
332.794 |
314 |
|
|
|
|
|
Safety and Security |
Between Groups |
6.427 |
3 |
2.142 |
1.845 |
.139 |
|
Within Groups |
361.173 |
311 |
1.161 |
|
|
|
|
Total |
367.600 |
314 |
|
|
|
|
|
Understanding |
Between Groups |
11.542 |
3 |
3.847 |
2.914 |
.035 |
|
Within Groups |
410.664 |
311 |
1.320 |
|
|
|
|
Total |
422.206 |
314 |
|
|
|
|
|
Tangibles |
Between Groups |
2.524 |
3 |
.841 |
1.067 |
.363 |
|
Within Groups |
245.216 |
311 |
.788 |
|
|
|
|
Total |
247.740 |
314 |
|
|
|
|
|
MTOTAL |
Between Groups |
.742 |
3 |
.247 |
.616 |
.605 |
|
Within Groups |
124.831 |
311 |
.401 |
|
|
|
|
Total |
125.573 |
314 |
|
|
|
5.5 Differences between the frequency of visits and sample response during the expected period
Frequency of visits and traits such as reliability, responsiveness, competence, courtesy, communication, credibility, safety and security, understanding/knowing, tangibles, and overall satisfaction are analyzed. The results are displayed in Table 8. The sum of squares, mean square, F-value, and significance level are all dimension-specific statistics (Sig). Variability in answers that may be attributed to varying values of the independent variable is quantified by the sum of squares (SS) (in this case, the various service quality dimensions). The Df is equal to the independent variable's level count minus one. You get the mean square if you divide the SS by the Df. Finally, the F-value is calculated by dividing the variance in replies across all service quality characteristics by the variance in those same responses from the same groups (i.e., the variability in responses not attributable to the different service quality dimensions). If the F-value is large and the Sig. Value is little (less than 0.05), then there is a statistically significant difference between the groups; this suggests that different aspects of service quality are linked to varying degrees of satisfaction among visitors or customers.
Based on the reported F-statistics and significance levels, it appears that there are significant differences between groups for the reliability factor (p < .001), understanding/knowing factor (p = .035), and competence factor (p = .023). For the remaining factors, there are no significant differences between groups (all p-values > .05). The F-values for these dimensions are relatively high (ranging from 1.435 to 5.877), and their significance levels are all less than 0.05, indicating that the differences are statistically significant. For the other dimensions, including courtesy, communication, credibility, safety and security, and tangibles, the F-values are lower, and the significance levels are higher, suggesting that there may not be significant differences in customer or client responses across these dimensions. However, it is essential to note that the significance level is just one indicator of statistical significance, and it should be interpreted in conjunction with other factors such as effect size, sample size, and research context.
5.6 Differences between frequency of visits and sample response during the perceived period
Table 9 shows the results of a statistical analysis of survey responses related to perceived service quality. Specifically, it presents the analysis of variance results, which examines whether the mean differences among groups are statistically significant. The table provides a sum of squares (SS), degree of freedom (df), mean square (MS), F-value (F-statistic), and associated significance level for each dimension of service quality, such as responsiveness, reliability, competence, courtesy, communication, credibility, security, understanding/knowing, and tangibles (Sig). Both the variation between groups and within groups contribute to the SS, representing the total variety in the data. The df value specifies the total number of analyzed classes. The MS is the standard deviation (SS) divided by the number of categories (df), and it is a measure of the typical amount of variation attributable to each classification.
Table 9. Differences between the frequency of visits and sample response during the perceived period
|
Dimension |
|
Sum of Squares |
Df |
Mean Square |
F |
Sig. |
|
Reliability |
Between Groups |
.891 |
3 |
.297 |
.329 |
.804 |
|
Within Groups |
230.103 |
255 |
.902 |
|
|
|
|
Total |
230.994 |
258 |
|
|
|
|
|
Responsiveness |
Between Groups |
3.147 |
3 |
1.049 |
1.125 |
.339 |
|
Within Groups |
237.818 |
255 |
.933 |
|
|
|
|
Total |
240.965 |
258 |
|
|
|
|
|
Competence |
Between Groups |
2.488 |
3 |
.829 |
.881 |
.451 |
|
Within Groups |
239.938 |
255 |
.941 |
|
|
|
|
Total |
242.426 |
258 |
|
|
|
|
|
Access |
Between Groups |
1.595 |
3 |
.532 |
.555 |
.646 |
|
Within Groups |
244.551 |
255 |
.959 |
|
|
|
|
Total |
246.147 |
258 |
|
|
|
|
|
Courtesy |
Between Groups |
3.818 |
3 |
1.273 |
1.812 |
.145 |
|
Within Groups |
179.130 |
255 |
.702 |
|
|
|
|
Total |
182.948 |
258 |
|
|
|
|
|
Communication |
Between Groups |
1.213 |
3 |
.404 |
.408 |
.747 |
|
Within Groups |
252.497 |
255 |
.990 |
|
|
|
|
Total |
253.710 |
258 |
|
|
|
|
|
Credibility |
Between Groups |
3.103 |
3 |
1.034 |
1.044 |
.373 |
|
Within Groups |
252.584 |
255 |
.991 |
|
|
|
|
Total |
255.687 |
258 |
|
|
|
|
|
Safety and Security |
Between Groups |
2.637 |
3 |
.879 |
.717 |
.543 |
|
Within Groups |
312.881 |
255 |
1.227 |
|
|
|
|
Total |
315.519 |
258 |
|
|
|
|
|
Understanding |
Between Groups |
7.871 |
3 |
2.624 |
2.125 |
.097 |
|
Within Groups |
314.842 |
255 |
1.235 |
|
|
|
|
Total |
322.714 |
258 |
|
|
|
|
|
Tangibles |
Between Groups |
.272 |
3 |
.091 |
.190 |
.903 |
|
Within Groups |
121.715 |
255 |
.477 |
|
|
|
|
Total |
121.987 |
258 |
|
|
|
|
|
MTOTAL |
Between Groups |
1.001 |
3 |
.334 |
1.049 |
.371 |
|
Within Groups |
81.086 |
255 |
.318 |
|
|
|
|
Total |
82.086 |
258 |
|
|
|
The F-value is a ratio of the between-group variability to the within-group variability. It indicates the magnitude of the differences among the groups relative to the variation within the groups. A larger F-value suggests a more significant difference among the groups. If the null hypothesis is true, the Sig. The value represents the probability of obtaining the observed F-value by chance of a smaller Sig. The value indicates more substantial evidence against the null hypothesis and supports the alternative hypothesis that at least one group differs. In summary, Table 9 shows that for most aspects of service quality, the mean differences among groups are not statistically significant, as evidenced by the high Sig. Values. However, for understanding/knowing, the F-value is relatively large, and the Sig. Value is close to the conventional threshold of .05, indicating some evidence of group differences.
To sum up, the findings of this study carry significant implications for Babylon City's digital transformation efforts and its standing in the global tourism landscape. Firstly, the study underscores the pressing need for Babylon City to align with the evolving expectations of modern travelers. These tourists increasingly demand seamless, personalized, and technologically advanced experiences. To remain competitive and attractive in the tourism sector, Babylon City must embrace digital technologies such as mobile apps, social media, and data analytics. Furthermore, within the scope of the ten dimensions under examination, a noteworthy observation is that six of them exhibited a negative disconfirmation, signifying that the perceived service quality fell below the visitors' initial expectations. Widespread negative perceptions were observed in over half of the assessed dimensions, echoing findings from earlier studies that applied the SERVQUAL model in the tourism context (e.g., the studys of Bhat [71] and Fick and Brent Ritchie [72]). As a result, it becomes increasingly vital to confront the challenges faced during the journey of digital transformation, with a specific focus on addressing the negative disconfirmations within these six critical dimensions. Such an approach is imperative for expediting progress and unlocking the substantial economic potential embedded within the tourism industry.
Furthermore, the research emphasizes the pivotal role of service quality and effective digital implementation in enhancing visitor satisfaction and shaping the city's global reputation. Babylon City has an opportunity to improve its image by ensuring that its tourism services not only meet but exceed tourists' expectations. By investing in digital infrastructure and adopting innovative solutions, the city can position itself as a technologically advanced and inclusive tourist destination. This, in turn, can lead to positive visitor experiences and favorable word-of-mouth recommendations facilitated by digital platforms and ultimately contribute to the city's economic growth and prominence on the global tourism stage. In summary, the study provides a roadmap for Babylon City to navigate the digital age successfully and thrive in the competitive world of modern tourism.
The conclusion of the study emphasizes the critical importance of addressing service quality elements within the context of Babylon City's tourism industry. The analysis conducted by Abdulaziz et al. [45], ten comprehensive dimensions of service quality, highlights how bridging the gap between visitor expectations and perceptions is paramount. Notably, several authors (e.g., the studies of Parasuraman et al. [54] and Avkiran [73] have conducted extensive research on service quality aspects of tourism.
As the global tourism market continues to evolve and become increasingly competitive, this study suggests that visitor expectations are on the rise, shaping their satisfaction and retention. The SERVQUAL model employed in the research serves as a pivotal tool in defining tourist satisfaction, as evidenced by the gap analysis. This analytical approach illustrates how tourism organizations can enhance their service quality effectively, positioning it as a fundamental and effective strategy for the tourism sector in the modern age. Furthermore, the study provides valuable insights into descriptive statistics and one-sample t-tests, offering a comprehensive understanding of these statistical measures' relevance and applications.
In the era of the digital revolution, the role of quality tourism services in attracting visitors to destinations such as Babylon City has become increasingly vital. Modern tourists, armed with easy access to information and online booking tools, now have heightened expectations for seamless, personalized experiences tailored to their preferences. To meet these expectations and stand out in a competitive landscape while improving credibility, quality tourism service providers can effectively leverage digital technology. Strategies encompassing social media engagement, digital marketing, and data analytics enable these providers to align their offerings with customer expectations and attract new clientele.
Taking full advantage of digital technology, quality tourism service providers can optimize operational costs and further enhance their appeal to tourists. Digital platforms and mobile applications offer the potential to streamline booking processes, automate customer service inquiries, and provide real-time event updates, thereby enriching the overall visitor experience. By delivering individualized, technology-enabled services, Babylon City's tourism service providers can not only attract more visitors but also position themselves as industry leaders, contributing to the city's growth.
Prioritizing the delivery of high-quality digital services to meet modern visitor expectations is essential for the tourism industry in Babylon City to foster growth. This requires substantial investments in digital infrastructure and ongoing training for tourism service providers, enabling them to leverage technology effectively and enhance the overall tourism experience. In the era of digital transformation, these efforts can lead to a significant increase in visitor numbers, as contemporary travelers heavily rely on digital channels for trip planning. Offering high-quality digital services, such as user-friendly booking platforms and immersive virtual tours, allows Babylon City not only to meet but exceed visitor expectations, ultimately enhancing its reputation as a cutting-edge tourist destination.
It is worth noting that while the study primarily focused on exploring the impact of digital transformation on tourism service quality in Babylon City, it also delved into specific dimensions of service quality and their disconfirmations. Although this dimension-focused analysis may not directly align with the broader objectives, it offers valuable insights into the destination's understanding and improvement of its tourism services.
In light of these findings, stakeholders in Babylon City's tourism industry are recommended to invest in digital training programs for tourism professionals involving local government bodies, educational institutions, and tourism service providers. These programs aim to enhance digital literacy, equip professionals with skills to manage customer relationships in the digital space and provide training on utilizing data analytics to meet evolving traveler expectations. Additionally, stakeholders must prioritize the enhancement of digital infrastructure within Babylon City. This includes expanding Wi-Fi coverage, developing user-friendly mobile applications for tourists, and creating interactive online platforms offering real-time updates, maps, and convenient booking options. Such investments will establish Babylon City as a technologically advanced tourist destination and significantly elevate the overall visitor experience.
For future research, it is recommended to extend the study's scope to include the perceptions of international tourists, who often possess a broader perspective and extensive travel experiences, providing valuable insights into Babylon's successful digital implementation. Furthermore, future studies could enhance the existing framework by incorporating variables such as tourists' behavioral intentions, likelihood to recommend Babylon City, and their propensity to revisit the destination. Existing literature consistently demonstrates a positive relationship between visitor satisfaction and destination loyalty, suggesting that higher satisfaction levels during a visit contribute to increased repeat visits and positive word-of-mouth recommendations [74, 75]. Expanding research in these directions will contribute to a deeper understanding of the factors influencing tourist behavior and its implications for Babylon City's tourism industry.
[1] Pesonen, J. (2020). Management and leadership for digital transformation in tourism. In Handbook of e-Tourism, pp. 1-34. https://doi.org/10.1007/978-3-030-05324-6_68-1
[2] Paavola, R., Hallikainen, P., Elbanna, A. (2017). Role of middle managers in modular digital transformation: The case of Servu. In the 25th European Conference on Information Systems (ECIS), Guimarães, Portugal, pp. 887-903.
[3] Feroz, A.K., Zo, H., Chiravuri, A. (2021). Digital transformation and environmental sustainability: A review and research agenda. Sustainability, 13(3): 1530. https://doi.org/10.3390/su13031530
[4] Hämäläinen, M. (2020). A framework for a smart city design: Digital transformation in the Helsinki smart city. In Entrepreneurship and the Community, pp. 63-86. https://doi.org/10.1007/978-3-030-23604-5_5
[5] Tomičić Pupek, K., Pihir, I., Tomičić Furjan, M. (2019). Smart city initiatives in the context of digital transformation–scope, services and technologies. Management: Journal of Contemporary Management Issues, 24(1): 39-54. https://doi.org/10.30924/mjcmi.24.1.3
[6] Calisir, F., Gumussoy, C.A., Bayraktaroglu, A.E., Kaya, B. (2012). Effects of service quality dimensions on customer satisfaction and return intention in different hospital types. In the 2012 International Conference on Industrial Engineering and Operations Management, Istanbul, Turkey, pp. 518-522. https://doi.org/10.1504/IJAOM.2014.066829
[7] ALmasoodi, M.F., Rahman, S. (2023). Tourists' satisfaction with tour guide's service quality at Babylon archaeological site. International Journal of Sustainable Development & Planning, 18(1): 17-28. https://doi.org/10.18280/ijsdp.180102
[8] Al-Quraishi, K.A.A., Gabraw, R.Y. (2021). The basics of identifying training needs for human resources management and its impact on the hotel service quality (An experimental study in Babylon hotel). PalArch's Journal of Archaeology of Egypt/Egyptology, 18(4): 7763-7788.
[9] Pritchard, A., Morgan, N. (2006). Hotel Babylon? Exploring hotels as liminal sites of transition and transgression. Tourism Management, 27(5): 762-772. https://doi.org/10.1016/j.tourman.2005.05.015
[10] Saranj, S. (2014). Examining tourist's perception about the role of quality health center services in tourist satisfaction: Case of five star hotels in Montreal, Canada. Doctoral Dissertation, Eastern Mediterranean University (EMU)-Doğu Akdeniz Üniversitesi (DAÜ).
[11] Siguencia, L.O., Marzano, G., Gródek-Szostak, Z. (2018). Online booking: The case of booking a hotel in ogrodzieniec using the booking. com platform. In Proceedings of the 8th International Conference "Economics and Management-Based on New Technologies, Vrnjaþka Banja, Serbia, pp. 203-209.
[12] David-Negre, T., Almedida-Santana, A., Hernández, J.M., Moreno-Gil, S. (2018). Understanding European tourists' use of e-tourism platforms. Analysis of networks. Information Technology & Tourism, 20: 131-152. https://doi.org/10.1007/s40558-018-0113-z
[13] Im, J.Y., Hancer, M. (2014). Shaping travelers' attitude toward travel mobile applications. Journal of Hospitality and Tourism Technology, 5(2): 177-193. https://doi.org/10.1108/JHTT-11-2013-0036
[14] Tan, E., Law, R. (2016). mLearning as a softer visitor management approach for sustainable tourism. Journal of Sustainable Tourism, 24(1): 132-152. https://doi.org/10.1080/09669582.2015.1049610
[15] Song, H., Li, G., Van Der Veen, R., Chen, J.L. (2011). Assessing mainland Chinese tourists' satisfaction with Hong Kong using tourist satisfaction index. International Journal of Tourism Research, 13(1): 82-96. https://doi.org/10.1002/jtr.801
[16] Hernández Sánchez, N., Oskam, J. (2022). A “new tourism cycle” on the Canary Islands: Scenarios for digital transformation and resilience of small and medium tourism enterprises. Journal of Tourism Futures. https://doi.org/10.1108/JTF-04-2022-0132
[17] Lutfi, A., Alsyouf, A., Almaiah, M.A., et al. (2022). Factors influencing the adoption of big data analytics in the digital transformation era: Case study of Jordanian SMEs. Sustainability, 14(3): 1802. https://doi.org/10.3390/su14031802
[18] Baran, Z., Baran, H. (2022). The future of digital tourism alternatives in virtual reality. In Handbook of Research on Digital Communications, Internet of Things, and the Future of Cultural Tourism, pp. 58-84. https://doi.org/10.4018/978-1-7998-8528-3.ch004
[19] Buhalis, D., Leung, D., Lin, M. (2023). Metaverse as a disruptive technology revolutionising tourism management and marketing. Tourism Management, 97: 104724. https://doi.org/10.1016/j.tourman.2023.104724
[20] Frenzel, F., Giddy, J., Frisch, T. (2022). Digital technology, tourism and geographies of inequality. Tourism Geographies, 24(6-7): 923-933. https://doi.org/10.1080/14616688.2022.2142843
[21] Rigelský, M., Gavurova, B., Nastišin, L. (2022). Knowledge and technological innovations in the context of tourists' spending in OECD countries. Journal of Tourism and Services, 13(25): 176-188. https://doi.org/10.29036/jots.v13i25.460
[22] Lee, C.G. (2021). Tourism-led growth hypothesis: International tourism versus domestic tourism-Evidence from China. International Journal of Tourism Research, 23(5): 881-890. https://doi.org/10.1002/jtr.2450
[23] Moreno-Luna, L., Robina-Ramírez, R., Sánchez, M.S.O., Castro-Serrano, J. (2021). Tourism and sustainability in times of COVID-19: The case of Spain. International Journal of Environmental Research and Public Health, 18(4): 1859. https://doi.org/10.3390/ijerph18041859
[24] Sultana, S., Islam, T., Islam, M. (2020). Impact of COVID-19 pandemic on top tourist destinations in the world. Journal of Tourism, Hospitality and Sports, 50: 41-50. http:// doi.org/10.7176/JTHS/50-07
[25] Pencarelli, T. (2020). The digital revolution in the travel and tourism industry. Information Technology & Tourism, 22(3): 455-476. https://doi.org/10.1007/s40558-019-00160-
[26] Rashideh, W. (2020). Blockchain technology framework: Current and future perspectives for the tourism industry. Tourism Management, 80: 104125. https://doi.org/10.1016/j.tourman.2020.104125
[27] Custódio Santos, M., Ferreira, A., Costa, C., Santos, J.A.C. (2020). A model for the development of innovative tourism products: From service to transformation. Sustainability, 12(11): 4362. https://doi.org/10.3390/su12114362
[28] Opute, A., Irene, B., Iwu, G. (2020). Tourism service and digital technologies: A value creation perspective. African Journal of Hospitality, Tourism and Leisure, 9(2): 5.
[29] Muça, E., Boboli, I., Kapaj, I., Mane, A.K. (2022). Smart technology effecting tourism development in Albania. Journal of Environmental Management & Tourism, 13(8): 2113-2121. https://doi.org/10.14505/jemt.v13.8(64).04
[30] Rodriguez-Rodriguez, I., Rodriguez, J.V., Shirvanizadeh, N., Ortiz, A., Pardo-Quiles, D.J. (2021). Applications of artificial intelligence, machine learning, big data and the internet of things to the COVID-19 pandemic: A scientometric review using text mining. International Journal of Environmental Research and Public Health, 18(16): 8578. https://doi.org/10.3390/ijerph18168578
[31] Trung, N.D., Huy, D.T.N., Le, T.H. (2021). IoTs, machine learning (ML), AI and digital transformation affects various industries-principles and cybersecurity risks solutions. Management, 18: 501-513. https://doi.org/10.14704/WEB/V18SI04/WEB18144
[32] Vijayabanu, C., Karthikeyan, S. (2021). Digital transformation and the competitive advantage of global tourism. In Impact of New Media in Tourism, pp. 308-326. https://doi.org/10.4018/978-1-7998-7095-1.ch018
[33] Pugachev, P.S., Gusev, A.V., Kobyakova, O.S., Kadyrov, F.N., Gavrilov, D.V., Novitsky, R.E., Vladzimirsky, A.V. (2021). Global trends in the digital transformation of the healthcare industry. National Health Care (Russia), 2(2): 5-12. https://doi.org/10.47093/2713-069X.2021.2.2.5-12
[34] Garibaldi, R. (2022). The role of technology in wine tourism. In Routledge Handbook of Wine Tourism, pp. 557–566. Routledge International.
[35] Kindzule-Millere, I., Zeverte-Rivza, S. (2022). Digital transformation in tourism: Opportunities and challenges. In the 2022 International Conference, Jelgava, LLU ESAF, pp. 476-486. https://doi.org/10.22616/ESRD.2022.56.047
[36] Chaudhery, J., Maniktala, J. (2022). Digital platforms and future challenges of tourism in Asian countries. In Event Tourism in Asian Countries, pp. 373-383. Apple Academic Press.
[37] Lin, S.Y., Juan, P.J., Lin, S.W. (2020). A tam framework to evaluate the effect of smartphone application on tourism information search behavior of foreign independent travelers. Sustainability, 12(22): 9366. https://doi.org/10.3390/su12229366
[38] Kim, M.J., Kim, W.G., Kim, J.M., Kim, C. (2016). Does knowledge matter to seniors' usage of mobile devices? Focusing on motivation and attachment. International Journal of Contemporary Hospitality Management, 28(8): 1702-1727. https://doi.org/10.1108/IJCHM-01-2015-0031
[39] Cheng, X., Xue, T., Yang, B., Ma, B. (2023). A digital transformation approach in hospitality and tourism research. International Journal of Contemporary Hospitality Management, 35(8): 2944-2967. https://doi.org/10.1108/IJCHM-06-2022-0679
[40] Udovita, P.V.M.V.D. (2020). Conceptual review on dimensions of digital transformation in modern era. International Journal of Scientific and Research Publications, 10(2): 520-529. http://doi.org/10.29322/IJSRP.10.02.2020.p9873
[41] Buhalis, D., Sinarta, Y. (2019). Real-time co-creation and nowness service: Lessons from tourism and hospitality. Journal of Travel & Tourism Marketing, 36(5): 563-582. https://doi.org/10.1080/10548408.2019.1592059
[42] Nezakati, H., Amidi, A., Jusoh, Y.Y., Moghadas, S., Aziz, Y.A., Sohrabinezhadtalemi, R. (2015). Review of social media potential on knowledge sharing and collaboration in tourism industry. Procedia-Social and Behavioral Sciences, 172: 120-125. https://doi.org/10.1016/j.sbspro.2015.01.344
[43] Inversini, A., Cantoni, L., Buhalis, D. (2009). Destinations' information competition and web reputation. Information Technology & Tourism, 11(3): 221-234. https://doi.org/10.3727/109830509X12596187863991
[44] Kachwala, T., Bhadra, A., Bali, A., Dasgupta, C. (2018). Measuring customer satisfaction and service quality in tourism industry. SMART Journal of Business Management Studies, 14: 42-48. http://doi.org/10.5958/2321-2012.2018.00005.2
[45] Abdulaziz, T.A., Ammar, S.A., Abd El-latief Ahmed, M., Zeina, M., Elwardany, W. (2023). Service quality in tourism and hospitality industry and tourist destination loyalty post-COVID-19: The role of tourism destination image and tourist trust. The International Journal of Tourism and Hospitality Studies, 5(1): 26-50. https://doi.org/10.21608/ijthsx.2023.211274.1057
[46] Duong, L.T., Van, N.T., Linh, N.T. (2023). Post-pandemic tourist behavior in the context of the industrial revolution 4.0: An empirical study in Vietnam. VNU University of Economics and Business, 3(4): 66-76. https://doi.org/10.57110/vnujeb.v3i4.179
[47] Anand, K., Arya, V., Suresh, S., Sharma, A. (2023). Quality dimensions of augmented reality-based mobile apps for smart-tourism and its impact on customer satisfaction & reuse intention. Tourism Planning & Development, 20(2): 236-259. https://doi.org/10.1080/21568316.2022.2137577
[48] Robina-Ramírez, R., Leal-Solís, A., Medina-Merodio, J., Estriegana-Valdehita, R. (2022). From satisfaction to happiness in the co-creation of value: The role of moral emotions in the Spanish tourism sector. Quality & Quantity, 57: 3783-3804. https://doi.org/10.1007/s11135-022-01528-0
[49] Abdulquadri, A., Mogaji, E., Kieu, T.A., Nguyen, N.P. (2021). Digital transformation in financial services provision: A Nigerian perspective to the adoption of chatbot. Journal of Enterprising Communities: People and Places in the Global Economy, 15(2): 258-281. https://doi.org/10.1108/JEC-06-2020-0126
[50] Marković, S., Lončarić, D., Lončarić, D. (2014). Service quality and customer satisfaction in the health care industry-towards health tourism market. Tourism and hospitality management, 20(2): 155-170. https://doi.org/10.20867/thm.20.2.1
[51] Lee, J.L.M., Siu, N.Y.M., Zhang, T.J.F. (2020). Face, fate and brand equity: Service recovery justice and satisfaction. Journal of Consumer Marketing, 37(7): 843-854. https://doi.org/10.1108/JCM-01-2019-3037
[52] Waqanimaravu, M., Arasanmi, C.N. (2020). Employee training and service quality in the hospitality industry. Journal of Foodservice Business Research, 23(3): 216-227. https://doi.org/10.1080/15378020.2020.1724850
[53] Akter, S., Hossain, M.I., Lu, S., Aditya, S., Hossain, T.M.T., Kattiyapornpong, U. (2019). Does service quality perception in omnichannel retailing matter? A systematic review and agenda for future research. Exploring Omnichannel Retailing, pp. 71-97. https://doi.org/10.1007/978-3-319-98273-1_4
[54] Parasuraman, A.P., Zeithaml, V.A., Berry, L.L. (1988). SERVQUAL: A multiple-item scale for measuring consumer perceptions of service quality. Journal of Retailing, 64(1): 12-40.
[55] Cronin Jr, J.J., Taylor, S.A. (1992). Measuring service quality: A reexamination and extension. Journal of Marketing, 56(3): 55-68. https://doi.org/10.1177/002224299205600304
[56] Teas, R.K. (1993). Consumer expectations and the measurement of perceived service quality. Journal of Professional Services Marketing, 8(2): 33-54. https://doi.org/10.1300/J090v08n02_05
[57] Nakhai, B., Neves, J.S. (2009). The challenges of six sigma in improving service quality. International Journal of Quality & Reliability Management, 26(7): 663-684. https://doi.org/10.1108/02656710910975741
[58] Basendwah, M.A., Rahman, S., Khalufi, N. (2022). Measuring holiday satisfaction: Why and how. International Journal of Social Science Research, 4(2): 10-27.
[59] Oliver, R.L. (1980). A cognitive model of the antecedents and consequences of satisfaction decisions. Journal of Marketing Research, 17(4): 460-469.
[60] Chon, S. (1980). The impact of a growth center on an agricultural Hinterland: A case study of Taegu, Korea. The Geographical Bulletin, 19: 27.
[61] Crompton, J.L., Love, L.L. (1995). The predictive validity of alternative approaches to evaluating quality of a festival. Journal of Travel Research, 34(1): 11-24. https://doi.org/10.1177/004728759503400102
[62] Mishra, R.S., Sabberwal Prakash, S.J. (1984). Evaluation of solar cooker thermal performance using different insulating materials. International Journal of Energy Research, 8(4): 393-396. https://doi.org/10.1002/er.4440080410
[63] Ekinci, Y., Riley, M., Chen, J.S. (2001). Chapter twenty a review of comparison standards used in service quality and customer satisfaction studies: Some emerging issues for hospitality and tourism research. Consumer Psychology of Tourism, Hospitality, and Leisure, 2: 321-332. https://doi.org/10.1079/9780851995359.0321
[64] Kozak, M., Rimmington, M. (2000). Tourist satisfaction with Mallorca, Spain, as an off-season holiday destination. Journal of Travel Research, 38(3): 260-269. https://doi.org/10.1177/004728750003800308
[65] Heider, F. (1958). The Psychology of Interpersonal Relations. New York Wiley.
[66] Do, Q.H., Kim, T.Y., Wang, X. (2023). Effects of logistics service quality and price fairness on customer repurchase intention: The moderating role of cross-border e-commerce experiences. Journal of Retailing and Consumer Services, 70: 103165. https://doi.org/10.1016/j.jretconser.2022.103165
[67] Kuo, Y.F., Wu, C.M., Deng, W.J. (2009). The relationships among service quality, perceived value, customer satisfaction, and post-purchase intention in mobile value-added services. Computers in Human Behavior, 25(4): 887-896.
[68] Hossain, M.S., Mostafa, M.G., Hossain, M.A. (2021). Modeling tourists' satisfaction in the nature-based tourist destination using structural equation modeling technique. Geo Journal of Tourism and Geosites, 37(3): 814-822. https://doi.org/10.30892/gtg.37311-713
[69] Kelley, S.W., Davis, M.A. (1994). Antecedents to customer expectations for service recovery. Journal of the Academy of Marketing Science, 22(1): 52-61. https://doi.org/10.1177/0092070394221005
[70] Parekh, A.D., Bates, J.E., Amdur, R.J. (2020). Response rate and nonresponse bias in oncology survey studies. American Journal of Clinical Oncology, 43(4): 229-230. https://doi.org/10.1097/COC.0000000000000665
[71] Bhat, M.A. (2012). Tourism service quality: A dimension-specific assessment of SERVQUAL. Global Business Review, 13(2): 327-337. https://doi.org/10.1177/097215091201300210
[72] Fick, G.R., Brent Ritchie, J.R. (1991). Measuring service quality in the travel and tourism industry. Journal of Travel Research, 30(2): 2-9. https://doi.org/10.1177/004728759103000201
[73] Avkiran, N.K. (1999). An application reference for data envelopment analysis in branch banking: Helping the novice researcher. International Journal of Bank Marketing, 17(5): 206-220.
[74] Abuamoud, I., Ibrahim, A., Alrousan, R.M. (2018). Measuring tourists' satisfaction and loyalty: A perception approach. Quality Management Journal, 25(2): 101-107. https://doi.org/10.1080/10686967.2018.1436352
[75] El-Said, O., Aziz, H. (2019). Egypt’s competitiveness: Empirical examination of the relationship between destination attributes, tourist satisfaction and behavioral intentions among hotel guests. Tourism and Hospitality Management, 25(1): 53-73. https://doi.org/10.20867/thm.25.1.2