Ammar Jreisat![]()
© 2023 IIETA. This article is published by IIETA and is licensed under the CC BY 4.0 license (http://creativecommons.org/licenses/by/4.0/).
OPEN ACCESS
This study assesses the dynamic interconnectedness and transference of effects among burgeoning stock exchanges in Sub-Saharan Africa and between African and developed markets following the Ukrainian crisis in February 2022. In addition, the paper presents a comparative analysis of return and volatility during three distinct subperiods. These are the 2008 financial crisis, the COVID-19 pandemic in 2020, and the ongoing Ukrainian conflict. This paper conducts research using the Bai-Perron test for multiple structural breaks and the spillover index of Diebold and Yilmaz (2012), alongside the innovation accounting analysis test. The findings of this paper indicate that the resilience and isolation of stock markets in Africa to external financial shocks (volatility shock) have been weakened in the wake of the Ukrainian crisis and the COVID-19 pandemic as compared to the GFC sub-period. The results affirm that stock markets on the African continent have become more sensitive to structural changes and shocks in developed countries. This study has significant implications for investors and policymakers in Africa. Future investors need to genuinely diversify their investment portfolios to minimize future losses generated by shock transmission among markets. Policymakers might have to introduce fully fledged policies to diversify their economies and attract international investments.
Ukrainian crisis, African stock markets, financial connectedness, Diebold and Yilmaz (2012), spillover
The study of financial connectedness and cross-market linkages has emerged as an important topic in financial lexicon. It has been widely demonstrated in empirical work that financial crises are not the only channels through which exogenous shocks are transmitted to financial systems in the globe, however the political, economic, and health catastrophes also create transmission mechanisms and threatening economies and financial systems.
The examination of financial connectedness among financial markets through return and risk spillovers provides a significant overview of information transmission between stock markets, where a shock or an abrupt change in one stock market might affect the price and risk levels in another markets [1]. Over the last two decades, academics, research scholars, and investors have had heated discussions over the financial connectedness among stock markets across the globe. Indeed, this issue has provided an impetus for much empirical analysis that aimed at investigating the degree of interdependence between regional and international stock markets.
The financial theory suggests that the interdependence and connectedness among financial markets can enhance efficiency of capital allocation and increase the potential benefits from portfolio diversification [2]. Nonetheless, it has been argued that the increased level of co-movements among stock markets due to technological innovation and improvement posed risks and shocks spillover across emerging and developed stock markets alike. Consequently, the issue of financial contagion and volatility spillover has become a ubiquitous topic in the financial lexicon especially during crises that befell due to financial and geopolitical instability. It is imperative for policy makers in developing economies nowadays to maintain a minimum level of traction of their financial systems during the crises periods, and this will most likely necessitate a constant vigil on the degree of financial connectedness of and expected volatility spillovers to domestic stock markets.
The presence of a dominant role of certain markets in creating and transmitting spillover effects diachronically has gained increased importance during the crises periods since stock markets contribute to crises transmission through financial contagion and volatility spillovers. The ongoing Ukrainian crisis is blanketing the world economic outlook and financial forecasts since February 2022. The repercussions and consequences of this crisis are expected to have a perilous aggregate impact on financial markets co-movements across the world.
In the last fifty years, the developing economies in the African continent have received tremendous amounts of foreign development aids (amounted to almost 1 trillion dollar) [3]. Although foreign aid flows to Africa have failed to achieve full poverty alleviation and high level of economic prosperity. However, it has been noticed that the development aid utilization accompanied with full-fledged reform policies in some African countries has exhibited significant positive effect on the financial landscape and FDI flows in African region, where the adoption of new technology and automated trading systems enabled for noticeable improvement in the stock market platforms and investment toolkits [4]. Moreover, a sharp increase in the number of operating stock markets can be witnessed in Africa as the number of operating stock exchanges rose from eight in 1989 to 23 in 2007, and then to 38 stock markets by the end of 2020. The stock markets in the majority of African countries have been characterized by weak integration with international counterparts. The partial segmentation of the African stock exchanges from major international markets has instigated further investigation on potential role of African stocks in enhancing the risk/return tradeoffs of international investment portfolios especially during the periods of financial turmoil and political unrests. Henceforth, the research in this paper aims to answer the following research questions: First: what are the main alterations and changes, if any, in dynamic integration among main stock markets in the African region and developed markets in the wake of the Ukrainian crisis? Second: did this crisis lead to more significant effects on connectedness and spillover among these markets as compared to the crises of COVID-19 and global financial crisis in 2008? Third: do political, economic, and health crises lead to structural change in stock markets behavior in the African continent?
This paper aims to investigate the interconnectivity between African stock markets and major stock markets in both emerging and developed countries. Specifically, it focuses on three key aspects. Firstly, the study examines the relationships between African stock markets and global markets during the ongoing Ukrainian crisis. Secondly, it compares the impact of significant financial, health, and political crises in the new millennium, namely the Global Financial Crisis in 2008, the COVID-19 pandemic in 2020, and the Ukrainian crisis, on the transmission of returns and volatility among African and developed stock market indices. Lastly, the research conducts a comparative analysis to explore the role of domestic and international events in initiating structural shocks and sudden changes in stock markets across the African continent.
For these aims, research in this paper covers time windows of three main crises, 2008 financial crisis (GFC), the outbreak of pandemic of COVID-19 in early 2020, and the ongoing crisis in Ukraine. The present study employs Bai-Perron [5] techniques to identify the dates and times at which major changes in the stock market performance of African nations have occurred during times of crisis. This paper proposes the multiple structural breaks test that has been applied to major stock markets in Africa for the last fifteen years.
Diebold and Yilmaz [6] spillover index is also utilized to measure the financial connectedness and spillover of return and risk from developed market indices to their counterparts in African continent. This paper also utilizes the impulse response analysis to capture the dynamic response patterns of African stock indices to shocks in global markets.
The contribution of this study is mainly derived from its prompt response to the need for comprehensive investigation for safe and resilient investment conduits through which investors could diversify their investment portfolios in the wake of the ongoing Ukrainian crisis. In addition, this paper is one of the earliest, if not the first, attempts that assess the potential role of African stock markets in international portfolio diversification during the ongoing Ukrainian crisis. The remainder of the paper is organized as follows: part two demonstrates literature review. Part 3 encompasses data and method of study. Part 4 illustrates the outcomes of this study, and part 6 concludes the paper.
Previous literature on regional and global connectedness and spillovers among stock markets encompasses a wide array of empirical works that used a variety of methods to measure connectedness and spillover. For instance, cointegration and causality methods to measure the long-run equilibrium among international stock markets have been employed by several studies [7-15]. Diebold and Yilmaz [6] outlined a method for finding the spillover index among stock markets based on the results of a more recent strand of literature. This method allows us to identify the direction in which shocks are transmitted among different markets and can be applied to the analysis of financial markets to obtain useful insights. Furthermore, this method can be used to measure changes in the level of risk in the markets over time and to identify potential sources of contagion.
The D&Y method [6] has been applied by several researchers [1, 16-26] to investigate the impact of returns and volatility in stock markets, as well as the direction of transmission among them. The empirical outcomes of these studies highlighted the main net transmitters and net receivers of the stock markets under consideration.
In parallel, a group of studies have focused on measuring the degree of financial integration and connectedness among different groups of developing stock markets. For instance, the VAR framework including Granger Causality and Johansen-Juselius approaches [27] have been used to test the cointegration among developed and BRICS stock markets in the wake of the global financial crisis [2, 23-26]. The outcomes of these empirical studies, in general, affirmed the increased connectedness among stock markets of the BRICS bloc with developed indices. Within the context of African and Middle East (MENA) stock markets, the co-movements among MENA stock markets during different eras have been investigated by several studies [28-34]. Briefly, their results indicate increased connectedness among MENA, and between MENA and developed markets.
In the case of African stock markets, the volatility spillover percentages among stock markets in the Middle East and North Africa region and the US market have been calculated [35]. The outcomes of this study affirmed that higher spillover and volatility transmission occur among MENA and US markets during periods of high volatility. In addition to stock markets, an emerging bulk of literature has searched for risk and volatility spillovers among various types of financial markets and commodities. For instance, the financial connectedness through spillover effects among various groups of financial assets has been studied by several researchers [36-40].
The impact of the coronavirus has sparked debate about the connections between the stock markets of developed and developing nations. This is because investors tend to look for investments that are not linked to international markets during difficult times, in order to protect their assets. The GFC in 2008 has caused significant damages to the world economy, prompting a considerable amount of research on the impact of Asian cross-country financial integration. Moreover, the magnitude of connectedness and spillover among regional and international stock markets has been extensively studied, with a focus on the changes in connectedness levels due to the COVID-19 outbreak [41-45]. The outcomes of these empirical works confirmed the lucid effect of the pandemic on the dynamic correlations and co-movements among international and regional stock markets alike. The outbreak of the Ukrainian crisis is expected to affect the degree of financial linkages among stock markets in Africa. The findings of Federle et al. [46] suggested that the outbreak of the Ukrainian crisis in February 2022 had a negative impact on the stock markets of countries in close proximity to Ukraine. They found evidence of a "proximity penalty" for equity returns, meaning that the closer a country was to Ukraine, the greater the decline in its equity market. This study provides support for the notion that geo-political shocks can have a significant effect on stock market linkages and co-movements.
The existing literature has undoubtedly provided a comprehensive overview of the nature of linkage among regional and international equity markets and their outcomes have been insightful to international investors and policy makers alike. Moreover, the previous literature has employed a variety of econometric techniques to capture the dynamic effects that exist among these markets. Nevertheless, the financial markets worldwide have been subject to multiple shocks that belong to different causes and origins such as financial (GFC) health (COVID-19), and political (Ukrainian crisis). Hence, a need for concurrent and comprehensive investigation is necessitated in order to provide comparisons among the impacts of these events on the degree of integration/segmentation among stock markets in general, and indices in developing countries in particular. These comparisons are expected to provide addition and more up to date insights to enhance the awareness of the investment society, research scholars, and policy markets as well to the main channels through which international crises can approach financial markets.
There is limited evidence to support the assumption that political turmoil has had a significant impact on financial contagion and spillovers between African stock markets and between developed markets and African markets. For this aim, this paper aims to compare the volatility transmission and financial connectedness among main African stock markets with major stock markets in developing and developed countries during GFC of 2008, COVID-19 in 2020. This study contributes to the existing literature as one of the pioneering empirical investigations into the volatility spillover and financial connectedness of the African stock markets. The research focuses on major events and shocks from the 2008 global financial crisis to the current Ukrainian crisis, including the 2020 intensification of the COVID-19 pandemic.
This study analysis the daily stock prices for a sample of six stock markets in Africa, in addition to a group of developed countries. The sample of African markets including Egypt, South Africa, Namibia, Morocco, Nigeria, Cote D’ Ivoire. The stock markets in Egypt, Morocco, and South Africa, respectively, are the oldest stock exchanges in the region, while the markets in Namibia, Nigeria, and Cote D’ Ivoire are in top ten list of performers in last few years. The Asian Composite is selected to proxy for developing markets, whereas the Euronext 100 and S&P indices represent advanced markets.
This study assesses the implications of the Global Financial Crisis of 2008, the COVID-19 pandemic of 2020, and the Ukrainian crisis of 2022 on African markets using the MSCI indices from the DataStream. We apply daily data to gain an understanding of the short-term alterations in the markets. The Bai-Perron [5] test for multiple structural breaks is employed in our data range from July 2008 to July 2022. The Diebold and Yilmaz [6] spillover index is utilized to measure the interconnectedness of the markets for the three sub-periods, and an Impulse Response Analysis is administered to assess the response of African markets to shocks in other markets.
3.1 Testing for multiple structural breaks: Bai-Perron (2003)
In this paper, we employ Bai-Perron [5] to investigate the existence of multiple structural breaks in African and developed stock market indices. Despite the fact that this test does not allow for a clear depiction of the most significant structural break in a time series, which can be argued as one of its main limitations, nevertheless this model is recognized as more desirable than other tests for structural changes as it allows for determination of number structural break points as well as the simultaneous estimation of multiple break dates [47]. In this paper, the utilization of the Bai-Perron test is expected depict if political, economic, and health crises can equally lead to structural change in stock markets behavior in the African continent?
In accordance with Pai-Perron, the multi-linear regression model with m breaks and (m+1) regimes is presented as follows:
$x_t=y_t^{\prime} \beta+z_t^{\prime} \delta_j+u_t\left(t=T_{j-1}+1, \ldots ., T_j\right)$
where, $j=1, \ldots, m+1$, $T_0=0$ and $T_{m+1}=T$. xt is dependent variable at time t. $y_t(p \times 1)$ and $z_t(q \times 1)$ are vectors of covariance. $\beta$ and $\delta_j(j=1, \ldots, m+1)$ represent the corresponding vectors of coefficients. $\left(T_1, \ldots, T_m\right)$ are unknown break points, and ut is disturbance at time t. Using the matrix form of multiple linear regression described above, we can obtain the following:
$X=Y \beta+\bar{Z} \delta_j+U$
where, $X=\left(x_1, \ldots \ldots, x_T\right)^{\prime}$, $Y=\left(y_1, \ldots . ., y\right)^{\prime}$, $U=\left(u_1, \ldots \ldots, u_T\right)^{\prime}$, $\delta=\left(\delta_1^{\prime}, \delta_2^{\prime}, \ldots, \delta_{m+1}^{\prime}\right)^{\prime}$, and $\bar{Z}$ is matrix which diagonally partition Z at $\left(T_1, \ldots, T_m\right)$, i.e., $\bar{Z}$ = diag $\left(Z_1, \ldots, Z_{m+1}\right)$. The $\delta^0=\left(\delta_1^{0 \prime}, \delta_2^{0 \prime}, \ldots, \delta_{m+1}^{0 \prime}\right)^{\prime}$ and $\left(T_1, \ldots, T_m\right)$ used to denote the true values of $\delta$ and the true break points.
A structural stability test against a fixed number of breaks (examining whether or not there will be no structural breaks), a structural stability test against an unknown number of breaks, and a structural stability test against a set of breaks (which is test of $\ell$ versus $(\ell+1)$ breaks. The test amounts to the application of $(\ell+1)$ tests of the null hypothesis of $\ell$ break against the alternative hypothesis of $(\ell+1)$ breaks).
3.2 Testing for return and volatility spillovers: Diebold and Yilmaz (2012)
To test the conditional heteroskedasticity of time series variables in this study, Engle [48] also suggests using Dynamic Conditional Correlation (DCC) of the GARCH model. We then use the generalized VAR method and variance decomposition theorem to construct the connectedness and spillover index introduced by Diebold and Yilmaz (2012) to show how returns and volatility are spilled over between stock market indices. The covariance stationary VAR(p) is presented by Diebold and Yilmaz (2012) as follows:
$K_t=\sum_{i=1}^p \Psi_i K_{t-1}+\varepsilon_t$
where, Kt represents the n×1 vector of the endogenous variables, $\Psi_i$ are the n×n autoregressive coefficient matrices, $\varepsilon_t$ represents a vector of the serially uncorrelated errors. The moving average representation is written as $K_t=\sum_{j=0}^{\infty} \mathrm{B}_j \varepsilon_t$, $\mathrm{A}_j$ satisfies the recursion of the form $\mathrm{B}_j=\Psi_1 \mathrm{~B}_{j-1}+\Psi_2 \mathrm{~B}_{j-2}+\cdots .+\Psi_p \mathrm{~B}_{j-p}$ with B0 is the identity matrix of n×n, and $\mathrm{B}_j$ for $j<0$. The H-step ahead of generalized error forecast variance decomposition is:
$\varphi_{i j}(H)=\frac{\sigma_{j j}^{-1} \sum_{h=0}^{H-1}\left(e_i^{\prime} B_h \Sigma_{e_j}\right)^2}{\sum_{h=0}^{H-1}\left(e_i^{\prime} B_h \Sigma B_h^{\prime} e_i\right)}$
The $\Sigma$ denotes the variance matrix of errors vector, and the $\sigma_{i j}$ represents the standard deviation of the error terms of the jth equation. The $e_i$ denotes n×1 vector on the ith component and zero otherwise. The connectedness index encompasses n×n matrix c$\varphi(H)$ = $\left[\varphi_{i j}(H)\right]_{i, j=1,2}$, where where entries provide the contribution of the variable j to the forecast error variance of variable i. In a generalized decomposition of the variance, each entry of the variance decomposition matrix is normalized based on its row sum since, in the generalized decomposition, the contributions of both own and cross variables do not sum to one.
$\widetilde{\varphi_{\imath \jmath}}(H)=\frac{\varphi_{i j}(H)}{\sum_{j=1}^n \varphi_{i j}(H)}$
The $\sum_{j=1}^n \varphi_{i j}(H)$ = 1 and $\sum_{j=1}^n \varphi_{i j}(H)$ = n by construction. The $\widetilde{\varphi_{\imath \jmath}}(H)$ allows testing of the pairwise directional connectedness from j to i at H horizon. The transmission of the effect from j to i can be represented by $C_{i \leftarrow j}(H)$, while he opposite direction causality from i to j is presented by $C_{j \leftarrow i}(H)$. The net pairwise directional connectedness is presented as:
$C_{i j}=C_{i \leftarrow j}(H)-C_{i \leftarrow j}(H)$
Based on the above, the total directional spillover index from all variables to i is indicated for by C_(i←.) (H), is calculated as:
$\begin{aligned} C_{i \leftarrow .}(H)=\frac{\sum_{j=1, j \neq i}^N \widetilde{\varphi_{\imath \jmath}}(H)}{\sum_{i, j=1}^N \widetilde{\varphi_{\imath \jmath}}(H)} \times 100 =\frac{\sum_{j=1, j \neq i}^N \widetilde{\varphi_{\imath \jmath}}(H)}{N} \times 100\end{aligned}$
Hence, the net total connectedness is defined as:
$C_i(H)=C._{\leftarrow i}(H)-C_{i \leftarrow .}(H)$
Lastly, the aggregation of variance decomposition across variables in the system (stock market indices in our example) indicate for the total connectedness index that can be found by:
$\begin{aligned} C(H)=\frac{\sum_{i, j=1, i \neq j}^N \widetilde{\varphi_{\imath \jmath}}(H)}{\sum_{i, j=1}^N \widetilde{\varphi_{\imath \jmath}}(H)} \times 100 =\frac{\sum_{i, j=1, i \neq j}^N \widetilde{\varphi_{\imath \jmath}}(H)}{N} \times 100\end{aligned}$
According to Diebold and Yilmaz (2012), the technique can show the immediate impact of the current political situation on the transmission of financial shocks between African and developed economies.
3.3 Impulse response analysis
The utilization of impulse response function aims to depict the dynamic patterns and trajectory of series variables over the period of time under examination. In other words, this test enables for investigating the response of variables in the system to one impulse (shock) in other variable. The impulse response analysis is conducted using the Vector Autoregressive (VAR) theorem to allow for interactions among variables in the system. The simple bivariate VAR model is:
$\begin{gathered}\mathrm{a} t=110-112 \mathrm{~b} t+\gamma 11 \mathrm{a} t-1+\gamma 12 \mathrm{~b} t-1+\varepsilon \mathrm{a} t \\ \mathrm{~b} t=120-121 \mathrm{a} t+\gamma 21 \mathrm{~b} t-1+\gamma 22 \mathrm{a} t-1+\varepsilon \mathrm{b} t\end{gathered}$
where, l10 and l20 represent intercept terms while b and a denote the time series. As at and bt affect each other, -l12 and -l21 are the simultaneous influence of unit change of bt on at, and γ12 and unit change in bt-1 on at, respectively. The εyt and εzt represent white-noise disturbances to highlight innovations or shocks in at and bt respectively in response to one standard deviation shock in other variables. γ11 reflect the influence of bt-1 on at and γ22 the effect of bt-1 on bt.
The moving average representation system in VAR can be represented by:
$\left[\begin{array}{l}a_t \\ b_t\end{array}\right]=\left[\begin{array}{l}\bar{a} \\ \bar{b}\end{array}\right]+\sum_{i=0}^{\infty}\left[\begin{array}{ll}\mho_{11}(i) & \mho_{12}(i) \\ \mho_{21}(i) & \mho_{22}(i)\end{array}\right]\left[\begin{array}{l}\varepsilon_{a t-i} \\ \varepsilon_{b t-i}\end{array}\right]$
This moving average enables for interaction among sequences of variables. Coefficient Ʊi demonstrates the shock effect of error terms on the time path of dependent variables in the equation above. The functions Ʊ11(i), Ʊ12(i), Ʊ21(i) and Ʊ22(i) show impulse response functions that represent the behaviour variable in response to various impulses and shocks in other variables in the system.
This paper seeks to examine the changes in African stock markets in the past fifteen years, and the effects of various global events, such as financial and health crises, on these markets. Table 1 of the paper provides the results of the Bai-Perron test, which was used to observe the structural breaks in African stock markets between June 2008 and June 2022.
The tests $U D_{\max }$ for African stock indices show that the null hypothesis of no structural break can be rejected, indicating at least one break in the time series we apply the sequential test $(\ell+1 \mid \ell)$. This suggests that the sequential test should be applied. In contrast, the $U D_{\max }$ tests for the stock market in Morocco are insignificant, meaning that the null hypothesis of no breaks cannot be rejected. Therefore, the sequential test is not applied to the Moroccan stock market [5].
The results in Table 1 reveal that all African stock markets under examination (except for Morocco) are subject to structural break in 2020 (and 2019 in case of Nigeria). This can be attributed to the outbreak of COVID-19 pandemic where the majority of African countries have imposed lock downs and applied strict sanitary measures in an attempt to leash the spread of the pandemic. It can be also noticed that the stock markets in South Africa, Namibia, Nigeria, and COTE D'IVOIRE exhibit significant break points between 2008 and 2010, and this can be clearly substantiated by the global financial crisis that reverberated to emerging markets by the end of 2008 and beginning of 2009. The estimated break points in 2012 in stock markets of Namibia and Nigeria seems to be somewhat plausible since this coincides with the debt crisis that took place in European countries during 2012, given that the European countries encompass the main donors and development aid providers to the African Continent. Overall, the results in Table 1 demonstrates that the majority of the African stock indices in this study witnessed multiple structural breaks in the last fifteen years (except for Morocco). Moreover, the results indicate that the financial and health crises occurred in 2008 and 2020, respectively, have caused to a structural break in African stock markets, whereas the ongoing geopolitical crisis of Ukraine does not seem to pause a structural change in these markets.
This paper examines the financial interconnectedness among African stock markets and between African, developing (represented by the Asian stock markets composite index), and developed markets (represented by EuroNext100 and S&P500 indices) during three major events: global financial crisis, COVID-19 pandemic, and Ukrainian crisis. To measure the spillover effect of each event, Diebold and Yilmaz's (2012) spillover indices for return and volatility are employed in this research for the three specified sub-periods.
The results in Table 2 demonstrate that the total return spillover index during the Ukrainian conflict was 63.1%, which was slightly higher than the total return spillovers in the GFC and COVID-19 periods. The table comprises panels A, B, and C, which demonstrate the return spillovers for the GFC, COVID-19, and Ukrainian crisis, respectively.
The spillover of shock in returns within the African region indicates that stock indices in Code D’Ivoire, Egypt, and Morocco are main transmitters of return shocks to their African counterparts especially in GFC and Ukrainian crises, and this might be explained by the fact that stock markets in Egypt and Morocco are amongst the highest capitalization, while the market index of Cote D’Ivoire is considered as a fast growing market in terms of liquidity capitalization.
Table 2 also indicate that the change in returns of Asian indices exhibit larger effect on returns in African markets during the political crisis of Ukraine, and this indicates for increased level of financial connectedness among African and Asian markets, which in turn reflects the similarities, even in part, in main macroeconomic fundamentals of the developing countries in both continents in terms of role of FDIs and remittances flows in supporting economic activities. Last but not least, the results also indicate that the degree of return transmission from developed to African indices varies based on the nature of the crisis, where the US stock market indicator exhibited higher return spillover to African markets in the wake of the ongoing Ukrainian conflict (almost by 60%), whereas the shock in European composite index was more influential on African markets during the COVID-19 pandemic, and this could be explained by the magnitude of trade and development aids frows from EU countries to the African continent, which was almost seized during the global pandemic.
There is a considerable amount of evidence that is presented in Table 3 regarding the volatility spillovers and transmissions among the stock markets of interest. According to Table 2, the stock market indexes contributed significantly to the risk transmission in relation to the return spillovers in the system, which increased the risk transmission. As compared to the spillover indices of the Global Financial Crisis and the Ukrainian Crisis of 2012, the total volatility spillover index during the COVID-19 period was significantly higher (82.5%) during the COVID-19 period.
This paper examines the impact of external shocks on African stock markets during crisis periods and how this affects their exogenous and endogenous statuses. Notable outcomes include a transformation in the exogenous and endogenous statuses of the African stock markets in response to volatility spillover. This discrepancy between the net transmitters and net receivers implies that the influence of one market on other markets in the system is greater than the influence of other variables in the system on the market in question, while the net receivers suggest that the influence of other variables on the market is greater than the market's own influence on the other variables.
The results from Table 3 Panel A suggest that African stock markets exhibited a considerable degree of exogeneity during the Global Financial Crisis (GFC). This implies that during periods of stock market volatility, African markets had a greater tendency to transmit volatility and instability generated from within their own indices than to absorb oscillations produced by other markets, with the exception of Egypt.
However, it can be clearly noticed in panels B and C of Table 3 that during COVID-19 pandemic and Ukrainian crisis, the African stock indices (except for Nigerian market) are net receivers of shocks generated and transmitted from other markets. The results of Table 3 suggest that African stock markets became more endogenous to fluctuations in other emerging and developing markets, particularly during the Ukrainian crisis and the Global Financial Crisis (GFC). In particular, the influence of European and Asian stock markets on African markets was greater during the Ukrainian crisis, while the influence of US markets was more prominent during the GFC. This indicates that emerging African markets are becoming increasingly interconnected with other emerging and developed markets.
Overall, the results of Dieblod and Yilmaz (2012) spillover test demonstrate that the resilience of stock markets in Africa to external financial shocks (volatility shock) has been weakened in the wake of the Ukrainian crisis as compared to resilience to shocks during GFC and COVID-19 sub-periods. This indicate that the financial connectedness of African stock indices with the rest of the world (represented by developing and developed markets) is increasing over time, and this contradicts with the findings of Ampomah [49] and Ncube et al. [33] who claimed that African markets seem to remain segmented from the global financial shocks, whereas the outcomes are in line with recent literature on financial connectedness [41, 45].
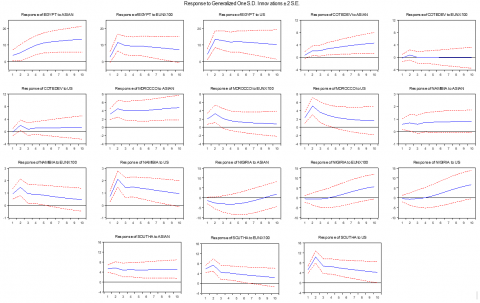
This empirical analysis uses the generalized impulse response analysis to examine the dynamic interactions between African stock markets and shocks from other international markets, namely Asia, Europe, and the United States. The results from this empirical analysis can be used to inform portfolio allocation decisions and to assess the risk of African stock markets. The graph in Figure 1 demonstrates the response of African indices to shocks in standard deviations in the markets of developing and developed countries during the Global Financial Crisis, on a 10-week timeline. It has been observed that African markets are highly sensitive to external shocks, with a rapid response time, when compared to other markets. Furthermore, a stimulus in the markets of Asia, the European Union, and the United States often leads to a positive response in African indices, with the notable exception of the Nigerian stock market, which typically displays a negative response before eventually turning positive after five weeks.
Figure 2 illustrates the responsiveness of African indices to shocks other markets in the course of the COVID-19 pandemic. It is evident from the fact that the Egyptian market does not respond to changes in Asian composite index, the Namibian and Nigerian markets, however, are negatively affected by a one-standard deviation shock to the US market. The results of the impulse response analysis conducted during the Ukrainian crisis are presented in Figure 3. The empirical results illustrated in Figure 3 indicate that, with the exception of Nigeria, the African stock indices have a positive correlation with the shocks in other markets. This suggests that African markets are not completely insulated from global market shocks.
The findings of the impulse response function suggest that the stock markets in Africa are not immune to fluctuations and influences from global equity markets. They exhibit a tendency to react promptly to external shocks, irrespective of the long-term course of the response. These results align with the research conducted by Diebold and Yilmaz in 2012, which highlights a diminishing potential for international portfolio diversification through African stock markets over time. This implies that the ability to spread investment risk across different markets in Africa is gradually decreasing.
Table 1. Bai-Perron (2003) test for multiple structural breaks
|
Variable |
$U D_{\max }$ |
$W D_{\max }$ |
$F_T(2 \mid 1)$ |
$F_T(3 \mid 2)$ |
$F_T(4 \mid 3)$ |
$F_T(5 \mid 4)$ |
Optimal Number of Breaks |
Break Dates |
|
(1) |
(2) |
(3) |
(4) |
(5) |
(6) |
(7) |
(8) |
(9) |
|
Egypt |
13.23*** |
15.94*** |
2.86 |
- |
- |
- |
1 |
04/2020 |
|
South Africa |
9.13** |
14.19** |
8.57* |
6.99 |
- |
- |
2 |
03/2009, 09/2020 |
|
Namibia |
31.83*** |
44.58*** |
18.74*** |
10.01* |
8.74 |
- |
3 |
07/2008, 09/2012, 05/2020 |
|
Morocco |
7.42 |
12.50** |
- |
- |
- |
- |
- |
- |
|
Nigeria |
15.10*** |
17.91*** |
14.91*** |
15.09*** |
3.14 |
- |
3 |
04/2008, 09/2012, 05/2019 |
|
COTE D'IVOIRE |
14.83*** |
24.36*** |
14.22*** |
7.51 |
- |
- |
2 |
10/2010, 04/2020 |
Notes: The $U D_{\max }$ critical values equal 12.37, 8.88 and 7.46 at 1, 5 and 10% significance levels, respectively. The $W D_{\max }$ critical values equal 13.83, 9.91 and 8.20 at 1, 5 and 10% significance levels, respectively. For critical values of $F_T(2 \mid 1)$, $\ell$ =1,…, $F_T(5 \mid 4)$ please refer to Bai and Perron (2003).
Table 2. Diebold and Yilmaz test results for return spillovers during the three sub-periods
|
Panel A: Return Spillovers During Global Financial Crisis (Total Spillover = 60.8%) |
||||||||||
|
|
ASIAN |
COTEDEV |
EGYPT |
EUNX100 |
MOROCCO |
NAMIBIA |
NIGIRIA |
SOUTHA |
US |
Contribution from others |
|
ASIAN |
29.3 |
17.7 |
13.3 |
5.3 |
1.6 |
4.1 |
12.2 |
10.3 |
6.2 |
70.7 |
|
COTEDEV |
2.3 |
54.1 |
3.5 |
1.6 |
7.5 |
1.7 |
5.4 |
19.2 |
4.8 |
45.9 |
|
EGYPT |
3.6 |
10.6 |
63.1 |
7.9 |
3.3 |
2.4 |
4.8 |
2.3 |
2.0 |
36.9 |
|
EUNX100 |
19.8 |
9.1 |
14.2 |
25.9 |
3.0 |
4.4 |
8.1 |
1.8 |
13.6 |
74.1 |
|
MOROCCO |
24.8 |
17.1 |
8.5 |
1.3 |
28.3 |
1.8 |
6.6 |
8.7 |
2.9 |
71.7 |
|
NAMIBIA |
9.1 |
11.3 |
7.7 |
5.1 |
2.8 |
44.6 |
10.7 |
0.8 |
8.0 |
55.4 |
|
NIGIRIA |
5.2 |
3.1 |
1.4 |
1.0 |
11.8 |
0.6 |
67.0 |
8.5 |
1.4 |
33.0 |
|
SOUTHA |
15.6 |
16.6 |
10.8 |
4.5 |
1.7 |
15.5 |
14.2 |
13.8 |
7.3 |
86.2 |
|
US |
14.0 |
13.8 |
12.9 |
19.0 |
2.5 |
3.6 |
8.2 |
2.8 |
23.3 |
76.7 |
|
Contribution to others |
94.5 |
99.2 |
72.2 |
45.7 |
34.2 |
34.1 |
70.2 |
54.3 |
46.2 |
550.6 |
|
Panel B: Return Spillovers During COVID-19 Pandemic (Total Spillover = 49.1%) |
||||||||||
|
|
ASIAN |
COTEDEV |
EGYPT |
EUNX100 |
MOROCCO |
NAMIBIA |
NIGIRIA |
SOUTHA |
US |
Contribution from others |
|
ASIAN |
12.2 |
2.5 |
0.3 |
77.1 |
3.2 |
0.2 |
1.4 |
1.4 |
1.7 |
87.8 |
|
COTEDEV |
7.7 |
15.6 |
0.5 |
67.5 |
4.1 |
0.5 |
1.4 |
0.9 |
1.8 |
84.4 |
|
EGYPT |
8.6 |
3.2 |
5.0 |
75.5 |
3.1 |
0.3 |
1.3 |
1.2 |
1.7 |
95.0 |
|
EUNX100 |
8.3 |
2.7 |
0.3 |
81.3 |
2.9 |
0.3 |
1.1 |
1.2 |
2.0 |
18.7 |
|
MOROCCO |
9.4 |
4.0 |
0.6 |
74.4 |
7.4 |
0.5 |
1.0 |
1.0 |
1.6 |
92.6 |
|
NAMIBIA |
5.9 |
4.4 |
1.2 |
66.2 |
2.4 |
15.3 |
0.8 |
1.4 |
2.5 |
84.7 |
|
NIGIRIA |
3.7 |
2.3 |
0.8 |
73.8 |
1.6 |
0.7 |
14.4 |
0.8 |
1.8 |
85.6 |
|
SOUTHA |
7.4 |
2.8 |
1.1 |
79.8 |
2.3 |
0.5 |
1.4 |
3.0 |
1.9 |
97.0 |
|
US |
8.6 |
3.0 |
0.5 |
77.5 |
3.2 |
0.3 |
1.5 |
1.5 |
3.8 |
96.2 |
|
Contribution to others |
59.7 |
25.0 |
5.3 |
591.9 |
22.9 |
3.2 |
9.9 |
9.4 |
15.0 |
742.2 |
|
Panel C: Return Spillovers During Ukrainian Crisis (Total Spillover = 63.1%) |
||||||||||
|
|
ASIAN |
COTEDEV |
EGYPT |
EUNX100 |
MOROCCO |
NAMIBIA |
NIGIRIA |
SOUTHA |
US |
Contribution from others |
|
ASIAN |
52.0 |
2.7 |
3.1 |
16.5 |
1.1 |
2.3 |
4.6 |
2.8 |
14.8 |
48.0 |
|
COTEDEV |
10.0 |
56.8 |
3.5 |
6.2 |
7.5 |
1.8 |
5.3 |
3.9 |
5.0 |
43.2 |
|
EGYPT |
21.5 |
6.0 |
53.3 |
4.9 |
5.0 |
1.4 |
2.0 |
4.3 |
1.6 |
46.7 |
|
EUNX100 |
21.3 |
4.5 |
6.8 |
38.4 |
4.5 |
4.3 |
2.8 |
5.4 |
11.9 |
61.6 |
|
MOROCCO |
10.6 |
5.6 |
3.6 |
13.2 |
52.6 |
1.5 |
4.7 |
4.5 |
3.8 |
47.4 |
|
NAMIBIA |
9.7 |
13.7 |
2.8 |
10.5 |
8.9 |
40.2 |
3.6 |
3.6 |
7.1 |
59.8 |
|
NIGIRIA |
7.0 |
3.9 |
4.5 |
3.1 |
5.9 |
2.2 |
67.2 |
2.7 |
3.5 |
32.8 |
|
SOUTHA |
32.0 |
4.7 |
3.3 |
10.5 |
4.1 |
6.2 |
2.6 |
24.5 |
12.2 |
75.5 |
|
US |
8.0 |
5.3 |
4.2 |
15.8 |
2.9 |
5.8 |
4.4 |
2.8 |
50.8 |
49.2 |
|
Contribution to others |
120.0 |
46.5 |
31.8 |
80.9 |
39.9 |
25.5 |
30.0 |
29.9 |
59.8 |
464.2 |
Table 3. Diebold and Yilmaz test results for volatility spillovers during the three sub-periods
|
Panel A: Volatility Spillovers During Global Financial Crisis (Total Spillover = 61.2%) |
||||||||||
|
|
ASIAN |
COTEDEV |
EGYPT |
EUNX100 |
MOROCCO |
NAMIBIA |
NIGIRIA |
SOUTHA |
US |
Contribution from others |
|
ASIAN |
22.1 |
17.9 |
2.5 |
6.0 |
1.8 |
1.1 |
13.5 |
19.7 |
15.4 |
77.9 |
|
COTEDEV |
2.4 |
50.8 |
2.7 |
5.5 |
0.1 |
1.3 |
1.9 |
28.1 |
7.0 |
49.2 |
|
EGYPT |
8.9 |
23.4 |
27.2 |
5.5 |
5.4 |
2.6 |
8.7 |
14.9 |
3.4 |
72.8 |
|
EUNX100 |
7.0 |
7.4 |
3.3 |
44.1 |
1.3 |
1.9 |
5.2 |
8.6 |
21.1 |
55.9 |
|
MOROCCO |
10.7 |
30.1 |
3.4 |
1.7 |
30.7 |
0.8 |
8.1 |
10.6 |
3.8 |
69.3 |
|
NAMIBIA |
5.1 |
4.2 |
13.1 |
5.0 |
0.5 |
39.6 |
3.7 |
10.4 |
18.6 |
60.4 |
|
NIGIRIA |
1.2 |
1.2 |
11.2 |
1.5 |
6.5 |
0.5 |
73.0 |
0.7 |
4.3 |
27.0 |
|
SOUTHA |
9.7 |
13.5 |
5.0 |
5.1 |
1.9 |
5.2 |
10.6 |
31.8 |
17.2 |
68.2 |
|
US |
4.6 |
11.1 |
5.2 |
26.8 |
0.7 |
1.3 |
4.1 |
12.7 |
33.5 |
66.5 |
|
Contribution to others |
49.5 |
108.8 |
46.4 |
57.1 |
18.2 |
14.7 |
55.8 |
105.8 |
90.9 |
547.3 |
|
Panel B: Volatility Spillovers During COVID-19 Pandemic (Total Spillover = 82.5%) |
||||||||||
|
|
ASIAN |
COTEDEV |
EGYPT |
EUNX100 |
MOROCCO |
NAMIBIA |
NIGIRIA |
SOUTHA |
US |
Contribution from others |
|
ASIAN |
38.4 |
0.7 |
3.4 |
29.6 |
2.0 |
17.5 |
1.9 |
1.0 |
5.5 |
61.6 |
|
COTEDEV |
1.1 |
60.9 |
2.6 |
3.4 |
24.8 |
3.4 |
1.7 |
0.1 |
2.0 |
39.1 |
|
EGYPT |
7.4 |
1.0 |
46.0 |
7.8 |
12.2 |
3.2 |
0.8 |
17.4 |
4.1 |
54.0 |
|
EUNX100 |
3.9 |
1.0 |
4.5 |
63.8 |
4.2 |
11.2 |
3.0 |
1.2 |
7.2 |
36.2 |
|
MOROCCO |
2.1 |
7.7 |
3.8 |
15.5 |
60.3 |
3.4 |
2.3 |
2.0 |
2.9 |
39.7 |
|
NAMIBIA |
9.7 |
6.2 |
4.4 |
2.5 |
3.5 |
55.6 |
7.7 |
3.3 |
7.2 |
44.4 |
|
NIGIRIA |
10.7 |
9.2 |
0.9 |
4.4 |
0.8 |
2.0 |
65.4 |
6.3 |
0.3 |
34.6 |
|
SOUTHA |
3.3 |
2.0 |
4.2 |
33.5 |
6.9 |
3.4 |
1.7 |
39.9 |
5.1 |
60.1 |
|
US |
8.3 |
3.0 |
6.5 |
28.0 |
1.5 |
21.0 |
2.8 |
1.4 |
27.5 |
72.5 |
|
Contribution to others |
46.4 |
30.9 |
30.2 |
124.7 |
56.0 |
65.1 |
21.8 |
32.7 |
34.3 |
442.1 |
|
Panel C: Volatility Spillovers During Ukrainian Crisis (Total Spillover = 51.6%) |
||||||||||
|
|
ASIAN |
COTEDEV |
EGYPT |
EUNX100 |
MOROCCO |
NAMIBIA |
NIGIRIA |
SOUTHA |
US |
Contribution from others |
|
ASIAN |
20.1 |
4.7 |
13.2 |
32.1 |
1.2 |
7.5 |
12.2 |
4.6 |
4.5 |
79.9 |
|
COTEDEV |
7.2 |
49.8 |
5.0 |
4.0 |
10.6 |
0.9 |
6.6 |
13.1 |
2.8 |
50.2 |
|
EGYPT |
5.6 |
12.0 |
55.8 |
14.8 |
2.8 |
3.6 |
3.1 |
1.7 |
0.6 |
44.2 |
|
EUNX100 |
6.2 |
4.5 |
10.1 |
56.5 |
1.8 |
2.5 |
8.4 |
4.9 |
5.2 |
43.5 |
|
MOROCCO |
3.9 |
6.5 |
17.3 |
28.4 |
22.3 |
0.7 |
14.2 |
4.9 |
1.8 |
77.7 |
|
NAMIBIA |
13.4 |
8.0 |
7.3 |
6.3 |
12.4 |
29.7 |
3.8 |
15.1 |
4.0 |
70.3 |
|
NIGIRIA |
26.9 |
4.5 |
0.9 |
1.1 |
6.7 |
6.5 |
48.7 |
3.9 |
0.8 |
51.3 |
|
SOUTHA |
10.7 |
9.1 |
8.8 |
12.5 |
4.9 |
10.0 |
8.1 |
31.7 |
4.3 |
68.3 |
|
US |
2.1 |
1.2 |
14.8 |
38.2 |
3.4 |
2.7 |
12.6 |
7.5 |
17.4 |
82.6 |
|
Contribution to others |
76.1 |
50.5 |
77.3 |
137.4 |
43.8 |
34.3 |
69.1 |
55.7 |
24.0 |
568.2 |
Figure 1. Response of African stock market an impulse in Asia, European, and US stock markets during GFC
Figure 2. Response of African stock market to an impulse in Asia, European, and US stock markets during COVID-19 pandemic
Figure 3. Response of African stock market to an impulse in Asia, European, and US stock markets during Ukrainian crisis
This paper attempts to measure the main spillover channels among major stock markets in the African continent and a selected group of main international stock market indices. Using a group of research methodologies, the outcomes of the paper highlight the main return and volatility spillovers among the aforementioned indices during three major crises in the last two decades. However, we would like hereby to highlight the main limitations our paper might have witnessed. For instance, the use of the Diebold and Yilmaz (2012) model for return and volatility spillover lacks the required flexibility to capture the asymmetric behavior of time series data, where the effects and spillovers among studied variables are expected to exhibit nonlinear trajectory. In this regard, we believe that future research on this topic needs to improve the instrumental econometrical techniques to avoid such weakness such as the nonlinear time series models. Moreover, we urge future research to consider a time series model for structural breaks that can allow for concurrent determination of multiple as well as single most significant break in the time series. Finally, future research and attempts can improve the validity and comprehensiveness of the outcomes by enlarging the sample of studied markets and include more time observations.
This paper seeks to explore the extent of financial interdependence between African stock markets and those of both developed and developing countries during the Global Financial Crisis, the COVID-19 pandemic, and the Ukrainian crisis in order to gain a greater understanding of the financial connectedness of African markets.
The empirical outcomes of this paper are based on tests for multiple structural breaks of Bai-Perron (2003), spillover index measure of Diebold and Yilmaz (2012), in addition to impulse response analysis. The outcomes of structural break test indicate that the majority of the African stock indices in this study witnessed multiple structural breaks in the last fifteen years mainly during GFC and COVID-19 pandemic, however none of the African indices exhibits a structural shock during the Ukrainian crisis so far.
The outcomes of the spillover analysis indicate that in the wake of the Ukrainian crisis the stock markets in Code D’Ivoire, Egypt, and Morocco performed as main transmitters of return shocks to their African counterparts. Also, the African markets seem to be more affected by shocks in Asian and US markets during Ukrainian crisis. The outcomes also illustrate confirms a transmission of volatility waves among African and developed markets during COVID-19 pandemic.
The Impulse response test results confirms the findings of the spillover index in terms of higher degree of co-movements since majority of African markets respond immediately to shocks in international markets. The overall outcomes in this paper reveal that financial connectedness of African stock markets with the rest of the world has increased in last few years (COVID-19 and Ukrainian crisis) as compared to before.
The markets in Africa have become more vulnerable to disruptions in the global financial system, meaning investors and policymakers must pay extra attention to diversifying their portfolios in order to reduce the risk of future losses due to shockwaves being transmitted between markets. In other words, financial investors need to be aware of future expectations and on potential stock market turbulences in developed counties and take required actions toward mitigating their effects on investment portfolio performance, and this can be done by considering the ‘safe heaven’ and risk-free investments such as gold and treasury bonds, respectively.
Moreover, the NFTs and cryptocurrencies are nowadays offering potential diversifiers in the context of international portfolios. The policy markets, on the other side, need to enhance the resilience of their financial markets by following fully-fledged economic diversification polices to reduce the future drought of capital flows to financial systems in the African region. These policies can include, but are not limited to, rationing the government spending, adopting efficient policies for foreign aids distribution, and strengthening the legal infrastructures of their financial markets.
This study presents an opportunity for future research and comparison in the field of financial markets. The aim is to explore and understand different types of crises and their impact on the global economy. By investigating the financial integration of these crises with the rest of the world, this study aims to provide investors and policy makers with a more comprehensive understanding of the sources and potential directions of future uncertainties. The findings of this research will equip stakeholders with valuable evidence, enabling them to make informed decisions and strategies to mitigate risks in the financial markets.
[1] Mensi, W., Boubaker, Z.F., Al-Yahyaee, K., Kang, H.S. (2018). Dynamic spillover and connectedness between global, regional, and GIPSI stock markets. Finance Research Letter, 25: 230-238. http://doi.org/10.1016/j.frl.2017.10.032.
[2] Almohamad, S., Rashid, A., Bakry, W., Jreisat, A., Vo, X.V. (2020). The impact of BRICS formation on portfolio diversification: Empirical evidence from pre-and post-formation eras. Cogent Economics & Finance, 8(1): 124-145. http://doi.org/10.2139/ssrn.3490569.
[3] Moyo, D. (2009). Why foreign aid is hurting Africa. The Wall Street Journal, pp. 1-5. https://pols306.files.wordpress.com/2011/08/moyo-on-aid-in-africa-wsj.pdf.
[4] Juselius. K., Møller, F.N., Tarp, F. (2014). The long-run impact of foreign aid in 36 African countries: Insights from multivariate time series analysis. Oxford Bulletin of Economics and Statistics, 76(2): 50-76.
[5] Bai, J., Perron, P. (2003). Critical values for multiple structural change tests. Econometrics Journal, 6: 72-78. http://doi.org/10.1111/1368-423X.00102
[6] Diebold, F.X., Yilmaz, K. (2012). Better to give than to receive: Predictive directional measurement of volatility spillovers. International Journal of Forecasting, 28(1): 57-66. http://doi.org/10.1016/j.ijforecast.2011.02.006.
[7] Taylor, M.P., Tonks, I. (1989). The internationalization of stock markets and the abolition of U.K. exchange controls. The Review of Economics and Statistics, 71(2): 332-336. http://doi.org/10.2307/1926980
[8] Chan, K.C., Gup, B.E., Pan, M. (1992). An empirical analysis of stock prices in major Asian markets and the United States. The Financial Review, 27: 289-307. http://doi.org/10.1111/j.1540-6288.1992.tb01319.x
[9] Kasa, K. (1992). Common stochastic trends in international stock markets. Journal of Monetary Economics, 29: 95-124. https://doi.org/10.1016/0304-3932(92)90025-W
[10] Choudhry, T. (1997). Stochastic trends in stock prices: Evidence from Latin American markets. Journal of Macroeconomics, 19(2): 285-304. http://doi.org/10.1016/S0164-0704(97)00016-5
[11] Garrett, I., Spyrou, S. (1999). Common stochastic trends in emerging equity markets. The Manchester School, 67: 649-660. http://doi.org/10.1111/1467-9957.00173
[12] Hunter, D.M. (2006). The evolution of stock market integration in the post-liberalization - A look at Latin America. Journal of International Money and Finance, 25: 795-826. http://doi.org/10.1016/j.jimonfin.2006.06.001
[13] Diamandis, P.F. (2009). International stock market linkages: Evidence from Latin America. Global Finance Journal, 20(1): 13-30. http://doi.org/10.1016/j.gfj.2009.03.005
[14] Nikkinen, J., Piljak, V., Aijo, J. (2011). Baltic stock markets and financial crisis of 2008-2009. Research in International Business and Finance, 26(3): 398-409. http://doi.org/10.1016/j.ribaf.2012.03.003
[15] Seth, N., Sharma, A.K. (2015). International stock market efficiency and integration. Journal of Advances in Management Research, 12(2): 88-106. https://doi.org/10.1108/JAMR-07-2011-0010
[16] Ahmad, W., Sehgal, S., Bhanumurthy, R.N. (2014). Eurozone crisis and BRICS stock markets: Contagion market interdependence. Economic Modelling, 33: 209-225. http://doi.org/10.1016/j.econmod.2013.04.009
[17] Kumar, D. (2015). Risk spillover between the GIPSI economies and Egypt, Saudi Arabia, and Turkey. Emerging Market Finance Trade, 51: 1193-1208. http://doi.org/10.1080/1540496X.2015.1080520
[18] Majumder, B.S., Nag, N.R. (2018). Shock and volatility spillovers among equity sectors of the national stock exchange in India. Global Business Review, 19(1): 1-20. http://doi.org/10.1177/0972150917713290
[19] Trinh, V.T.N. (2018). Return and volatility spillover effects among Vietnam, Singapore and Thailand stock markets–A multivariate GARCH analysis. University of Economics Ho Chi Minh City; VNP (Vietnam - The Netherlands Programme for M.A. in Development Economics). https://digital.lib.ueh.edu.vn/handle/UEH/58011.
[20] Roni, B., Abbas, G., Wang, S. (2018). Return and volatility spillovers effects: Study of Asian emerging stock markets. Journal of Systems Science and Information, 6(2): 97-119. https://doi.org/10.21078/JSSI-2018-097-23
[21] Hung, N.T., Binh, P.N. (2019). Volatility spillover across stock markets between China and Vietnam. AGU International Journal of Sciences, 23(2): 56-67.
[22] Gulza, A. (2020). Financial integration, domestic investment and growth of Pakistan economy. Research Journal of Social Sciences & Economics Review, 1(3): 136-142. http://doi.org/10.36902/rjsser-vol1-iss3-2020(136-142)
[23] Dasgupta, R. (2013). BRIC and US integration and dynamic linkages an empirical study for international diversification strategy. Interdisciplinary Journal of Contemporary Research in Business, 5: 536-563.
[24] Nashier, T. (2015). Financial integration between BRICS and developed stock markets. International Journal of Business and Management Invention, 4: 65-71.
[25] Ouattara, B.S. (2017). Re-examining stock market integration among BRICS countries. Eurasian Journal of Economics and Finance, 5(3): 109-132. http://doi.org/10.15604/ejef.2017.05.03.009
[26] Prakash, J.V., Nauriyal, D.K., Kaur, S. (2017). Assessing financial integration of BRICS equity markets: An empirical analysis. Emerging Economy Studies, 3(2): 127-138. http://doi.org/10.1177/2394901517730734
[27] Johansen, S., Juselius, K. (1990). Maximum likelihood estimation and inference on cointegration- with application to the demand for money. Oxford Bulletin of Economics and Statistics, 52: 169-210. http://doi.org/10.1111/j.1468-0084.1990.mp52002003.x
[28] Darrat, A.F., Elkhal, K., Hakim, S.R. (2000). On the integration of emerging stock markets in the middle east. Journal of Economic Development, 25(2): 119-129.
[29] Mohd, A., Hassan, H. (2003). Financial integration of stock markets in the gulf: A multivariate cointegration analysis. International Journal of Business, 8: 335-346. http://doi.org/10.2139/ssrn.420246
[30] Al-Khazali, O., Darrat, A.F., Saad, M. (2006). Intra-regional integration of the GCC stock markets: The role of liberalization. Applied Financial Economics, 16(17): 1265-1272. http://doi.org/10.1080/09603100500426630
[31] Genc, I.H., Jubain, A., Al-Mutairi, A. (2010). Economic versus financial integration or decoupling between the US and the GCC. Applied Financial Economics, 20: 1577-1583. http://doi.org/10.1080/09603107.2010.508713
[32] Neaime, S. (2012). The global financial crisis, financial linkages and correlations in returns and volatilities in emerging MENA stock markets. Emerging Markets Review, 13: 268-282. http://doi.org/10.1016/j.ememar.2012.01.006
[33] Ncube, A. (2015). Stock market integration in Africa: The case study of Johannesburg stock exchange and selected African countries. International Business and Economic Research Journal, 14(2): 367-386. http://doi.org/10.19030/iber.v14i2.9169
[34] Bahloul, S., Amor, N.B. (2021). A quantile regression approach to evaluate the relative impact of global and local factors on the MENA stock markets. International Journal of Emerging Markets, 18(5): 854-866. http://doi.org/10.1108/IJOEM-03-2020-0251
[35] Maghyereh, I.A., Awartani, B., Hilu, A.K. (2015). Dynamic transmissions between the U.S. and equity markets in the MENA countries: New evidence from pre- and post-global financial crisis. The Quarterly Review of Economics and Finance, 56: 123-138. http://doi.org/10.1016/j.qref.2014.08.005
[36] Yarovaya, L., Brzeszczyński, J., Lau, M.K.C. (2017). Asymmetry in spillover effects: Evidence for international stock index futures markets. International Review of Financial Analysis, 53: 94-111. http://doi.org/10.1016/j.irfa.2017.07.007
[37] Jabran, K., Chenb, S., Sultan, U.I., Mirzad, S. (2017). Does volatility spillover among stock markets varies from normal to turbulent periods? Evidence from emerging markets of Asia. The Journal of Finance and Data Science, 3(1-4): 20-30. http://doi.org/10.1016/j.jfds.2017.06.001
[38] Wang, Y., Bouri, E., Fareed, Z., Dai, Y. (2022). Geopolitical risk and the systemic risk in the commodity markets under the war in Ukraine. Finance Research Letters, 49: 103066. http://doi.org/10.1016/j.frl.2022.103066
[39] Just, M., Echaust, K. (2022). Dynamic spillover transmission in agricultural commodity markets: What has changed after the COVID-19 threat? Economics Letters, 217: 110671. http://doi.org/10.1016/j.econlet.2022.110671
[40] Liu, T., Nakajima, T., Hamori, S. (2022). The impact of economic uncertainty caused by COVID-19 on renewable energy stocks. Empirical Economics, 62: 1495-1515. https://link.springer.com/article/10.1007/s00181-021-02087-3.
[41] Umar, Z., Manel, Y., Riaz, Y., Gubareva, M. (2021). Return and volatility transmission between emerging markets and US debt throughout the pandemic crisis. Pacific-Basin Finance Journal, 67(3): 101563. http://doi.org/10.1016/j.pacfin.2021.101563
[42] Umar, Z., Bossman, A., Choi, S.-Y., Teplova, T. (2022). Does geopolitical risk matter for global asset returns? Evidence from quantile-on-quantile regression. Finance Research Letters, 48: 102991. https://doi.org/10.1016/j.frl.2022.102991
[43] Choi, K.R., Heilemann, M.V., Fauer, A., Mead, M. (2020). A second pandemic: Mental health spillover from the novel coronavirus (COVID-19). Journal of the American Psychiatric Nurses Association, 26(4): 107839032091980. http://doi.org/10.1177/1078390320919803
[44] Samitas A., Kampouris E., Polyzos S. (2022). COVID-19 pandemic and spillover effects in stock markets: A financial network approach. International Review of Financial Analysis, 80: 102005. https://doi.org/10.1016/j.irfa.2021.102005
[45] Moslehpour, M., Al-Fadly, A., Ehsanullah, S., Chong, W.K., Xuyen, M.T.N., Tan, P.L. (2022). Assessing financial risk spillover and panic impact of COVID-19 on European and Vietnam stock market. Environmental Science and Pollution Research, 29: 80-91. https://link.springer.com/article/10.1007%2Fs11356-021-18170-2.
[46] Federle, J.A., Meier, G., Sehn, V. (2022). Proximity to war: The stock market response to the Russian invasion of Ukraine. CEPR Discussion Paper 17185.
[47] Enders, W., Sandler, T. (2005). After 9/11: Is it all different now? Journal of Conflict Resolution, 49(2): 259-277.
[48] Engle, R. (2002). Dynamic conditional correlation: A simple class of multivariate generalized autoregressive conditional heteroskedasticity models. Journal of Business and Economic Statistics, 20(3): 339-350.
[49] Ampomah, A.S. (2011). Stock market integration in Africa. Managerial Finance, 37(3): 242-256. http://doi.org/10.1108/03074351111113306