Sophia Rezaq Ali Al-Timimy![]()
© 2023 IIETA. This article is published by IIETA and is licensed under the CC BY 4.0 license (http://creativecommons.org/licenses/by/4.0/).
OPEN ACCESS
In spite of, the importance of sustainability, and its concept and protection begun in the 1970s. Yet, with framework for action 2005-2025, it integrated risk prevention strategies into sustainable development activities. Whilst, Al-Hillah is the city center of important location near the holy governorate is surrounded by archaeological sites back to more than 4 000 years ago. These features make it perfect city as the case study. Parctically, this article compares multiple planning to obtain an effective scenario that manages events of operations before, during, and after the disaster. By creating a proactive scenario can based on indicators inspired from population density, easy access of traffic movement, and the shortest time at road intersections, barriers, and land uses. The article process represented by spatial analysis a12 planned based on the parameters, to choose the preferred evocation scenarios. Firstly, combined between rout and service network analysis to evaluate roads of the city by the shortest time, number of barriers, intersection, construction of shrouding zone and density of population.That result scenario (B) is selected, which protection for (19.08%) of the city’s population within a radius of two zones (0-4000), (4000–7000) m, followed by scenario (D) within a radius (0-4000) m zone, which serves 12.9% of the city’s population, then scenario (C) within a radius (4000–7000) m zone, can protect the city center of the city. Finally, scenario (A) within a radius (0-4000) m zone, can protect 4.9% city’s population towards the university. In conclusion, an integrated scenario that includes the entire city to obtain goal of the article can be achieved by protecting the civilian people to protect and directed chaos directed away from holy sites and farther from the heritage sites to achieve urban sustainability.
disaster management, evacuation planning, network analysis, geographical information system (GIS), scenario modelling, spatial analysis, sustainability
Increasingly, cities are facing numerous natural disasters and events on a global scale, including tsunamis, hurricanes, earthquakes, floods, and terrorist attacks [1, 2]. Which made us all fully aware of the extent of the danger and fragility to which society is exposed, especially urban society [3].
Recently, sustainability can't be fulfilled without security, safety, and political commitment [4].
However, rational thinking is one of the requirements for an appropriate decision that increases the effect of the disaster is the lack of rational thinking resulting from the feeling of danger, which prevents making the appropriate decision [5].
Unfortunately, the lack of a perspective plan to managed disaster properly, the failure to evacuate people promptly, along with the irrational thinking of people at the time of the disaster, which we observe in 2008 when Hurricane Ike reached the Texas coast [6].
In this regard, it is almost impossible to prevent disasters from occurring, but it is possible to reduce their effects and resulting damage by adopting an appropriate plan to manage and mitigate their risk [7].
Accordingly, the Hyogo Framework United Nations (HFA) strategy target is to build a comprehensive approach to raise awareness of the worth of disaster risk and the important of its management, which is significance part to sustainable development (Sustainable Development, SD). It aims to build societies and countries that are strongly capable of responding to disasters and mitigating their impacts [8, 9].
More specifically, the three objectives of the Framework (2005-2025) for Action can be summarized targets as: 1) Integrating disaster risk reduction into sustainable development policies. 2) Evolution of society’s efficiency to stand up against risks at the same time develop institutions, mechanisms. 3) Building a strategy combined between three approaches emergency preparation, and recovery approaches, Undermining disaster risk [8]. To integrate risk management and enable communities to confront challenges and reduce disasters to achieve urban sustainability [10].
Therefore, many studies have shown that conflict, the impact of poverty and war undermine urban sustainability [11, 12].
That requires a high degree of political commitment, which brings together the three pillars of the work, and a willingness to make decisions. Moreover, every city must strike a delicate dynamic balance between economic, environmental, social, and cultural development goals supported by safety factors [8, 13, 14].
Although the threat of social violence is old phenomenon, as urban society, as such it is most extreme form a panic response from the terror, that was a target of the attack [15].
According to Weigermars and Wegman, human is the benchmark for sustainability. Therefore, safety must be achieved to ensure sustainability [16]. Needless to say, cities in our contemporary time are densely populated places with many Potential victims in the event of inevitable disasters, the consequences of which are dire [17]. Therefore, Branscomb pointed out that cities to increase extent at risk of three categories of disasters:
The aim of article: This work creates a proactive plan based on the movement axes of the city of Al-Hillah to protect its residents in the event of danger, and to direct their movement because the city is surrounded by many heritage sites in addition to its proximity to two holy cities, as Al-Najaf and Karbala cities. So, providing proactive plans can save its heritage and provide urban sustainability
The problem of article: The absence of preemptive disaster management plans for the city of Al-Hillah which may negatively affect its residents and its urban sustainability.
The contributions: The contributions of this article are a presentation of building models from the spatial analysis network in GIS. This is through the integration between direction and area, based on indicators such as basic services, commercial and industrial land use, and access to indicators such as population density in addition to the possibility of developing a proactive plan to avoid or reduce the occurrence of disasters, which it can support decision makers in disaster management.
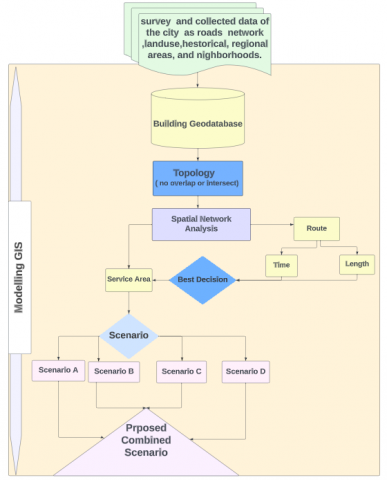
Figure 1. The methodology of article
The methodology includes a set of operations within a logical sequence as a field survey from (8 a.m. - 4 p.m.) for (three days a week, Monday, Tuesday, and Wednesday), including the fifth month of the year 2021.
To calculate the traffic time in the network axes and the time spent at intersections and adjacent land uses, and then calculate the population density based on the Department of Urban Planning and statistics from the Central Bureau of Statistics and dividing the number of housing units by the area of the neighborhood to build geodatabase (Figure 1).
Then make topology to correct the intersections and overlay in the drawing network. Then the network analysis included route within short path and time, analyzing the area served by these axes, and choosing the best scenario for evacuation by comparing the 4 scenarios obtained.
3.1 Study area (Al-Hillah city)
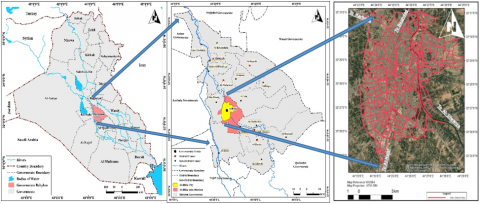
Al- Hillah city is in Babylon Governorate in the southwest of Iraq, between coordinates (longitude (44°23` - 44°30`) E, and latitude (32°24`38" - 32° 30`) N, to the north of the provinces of Karbala about (60.8) km, and Al-Najaf about (56.2) km from the Al-Anbar Governorate to the west, Baghdad (105.35) km in the north, Al-Qadisiyah Governorate to the south, and Waset governorate from the east. So, it an important governorate in the meddle of Iraq (Figure 2) [20]. While Al Hillah distract center is about 259 Km2 [21], almost in the center of Babylon governate 7 km southern ancient Babylon (2100 A.C). In the road of (Baghdad-Hillah), to the east of Porsaba 15 km with 47 m high Zaggorat, and the heritage site of Kotha to the north east about 50 km of Babylon, as in Figure 2. For all that, Al-Hillah city related to its region and adjacent urban centers where the transportation and communications network meet [22, 23]. As well as, it’s nearest to heritage Babylon city.
3.2 The disasters Iraq was exposed
Since 2014, many cities in Iraq have been subjected to terrorist attacks, including the governorates of Nineveh, Anbar, and Salah Al-Din, in addition to parts of the governorates of Kirkuk, Diyala, Babilon, and Baghdad [24]. This resulted in many casualties and material losses that were distributed, in addition to the destruction of many archaeological and religious sites. While the British website (Iraq Body Count), which specializes in calculating the number of civilian deaths in Iraq, revealed that the number of civilians killed from 2014 - 2017 Until the end of the war in May was (51,989) victim [25].
While the number of wounded are a double or more of that number. The disaster in city of Al- Hillah killed 60 people and injured more than 70 people. While at the governorate, 252 people were killed and injured 334 as a result of terrorist attacks from (2014 - 2017) killed 334 and injured 445 people. In the governorate 489,605 people were injured between (2005 - 2007). In (2005-2014), 69,212 victims in Al-Hillah killed and injured, and 242,578 people killed and injured in governorate of Babylon. From all that led to the aim of article.
3.3 GIS network analysis and evacuation modeling
Evacuation will be different according to the density of people, road directions, type of danger and its causes, and also the degree of control on hazards caused by authorities that should be held according to an evacuation plan. (Relationships between evacuation population size, emergency shelter capacity, and the time to evacuation [26-28].)
Network analysis in GIS to build a model that can be used for time- and length-based spatial analysis with network analysis, in addition to other information that can be added such as barriers, on lines and nods and collect more information as elevation, allowing us to retrieve information for spatial analysis, live flow, bridges, tunnels, overpasses and highways to support decision maker. In addition to the infrastructure network or service network, such as the water, gas, electricity, and other pipeline networks [27, 29].
The approach of evacuation routes algorithms was in light by the work of Professor Goodchild and his contributions to the importance of (GIS) for emergency response planning. So geospatial tools consider vital for evacuation planning to help reduce losses in lives and properties, limit the danger, reduce the costs of dealing with hazardous situations, facilitate emergency response to natural disasters [30], and focus on large volumes of data that should manage as the density of population land use, local streets design, danger events, and other data that are required past or recently collected and should manage at the moment [31]. While planners design as well as an update that plans for different scenarios of what will often happen. This approach is known for pre-planning, so real-time design and redevelopment of the plan are necessary in the event that infrastructure failure occurs or the route may be blocked to meet those unexpected changes in the direction and speed of the process [18, 30]. In terms of structures, the plan should outline participatory organizations, communications channels, response procedures, and the chain of command. The description should begin with an outline of call- up procedures and progress to a description of individual responsibilities and the arrangement of operating units and organizations, plus their interconnections [6].
Figure 2. The location of study area Al- Hillah city form governorate Babylone from Iraq, and urban collector roads
3.4 Data collection
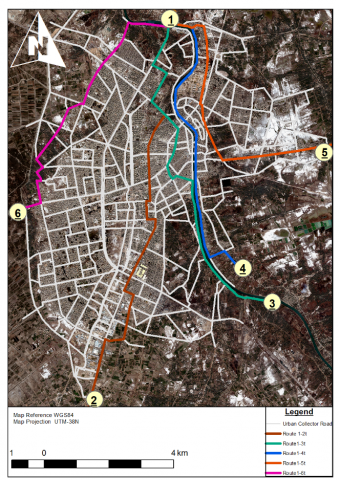
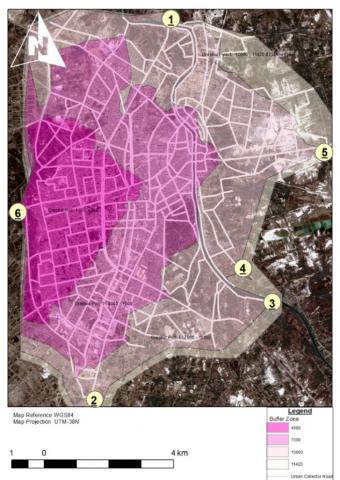
Figure 3. The density of study area and urban collector roads
The city was also surveyed to find out the roads and determine their types in terms of the quality of paving conditions which affects the time that takes to reach the destination. Besides, additional time has been added to the roads that land uses nearby.
The data was collected from survey and the Urban Planning Directorate, and Central Bureau of Statistics, unpublished data in 2021. Next to that, determine neighborhood density calculated from the divided number of the population by the area of neighborhoods, then division density into three categories: high, medium, and low.
Density red, green, and yellow respectively that were affected by time and movement during routes (Figure 3).
3.5 Optimization evacuation routes
To find the optimal evacuation route by analyzing the city roads network, we assume some an index below:
3.6 Network analysis
GIS tools have the capability to the big data analytics tools of place [31]. In addition, the most important thing that we can discuss in the spatial analysis is spatial decision support techniques. So, we consider spatial analysis is the most important map data processing technology that could enrich GIS applications [29]. Here, geographical information systems are effective and have the required tools to determine the methods and schedules for evacuating the population to safety in the event of natural disasters, and terrorist attacks [31].
So, in this paper we will take into account using spatial analysis to achieve the most accurate as an unprecedented experiment to our research problem, many possibilities and constraints for spatial analysis have been identified, including the population density in the neighborhoods that will be evacuated, the quality and efficiency of roads, beside the road length as indexes. As well as, have many constrain on the archaeological areas that should be preserved because they represent the heritage of humanity [23].
The process to analyse the indexes by Network analysis in GIS is the:
First Decision: Short distance in least-distance route and straight axis (Figures 4, 5).
Second Decision: The time distance is in Figure 6. One of the important things that must be taken into decision is the time required to cross the axis by evacuees to reach the safe places. Then time is an important variable in the evacuation process in order to be able to contain the risks (Figure 7). So, less time means fewer losses.
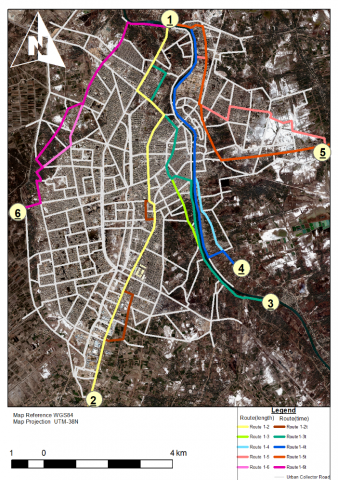
Figure 6. The routes of the least time's distance required to cross the axis
Figure 7. Comparison of axes based on less length and axes with less time
Figure 8. The area closest to the escape point 2
Figure 9. The area closest to the escape point 3 and 4
Figure 10. The area closest to the escape point 5
Figure 11. The area closest to the escape point 6
There is no clear difference between axis 2-1, which is measured on the according to length decision in Figure 3. And 1-2t measured according to time decision Figure 6. In spite of, differences that are caused by the quality of the road or the population density, especially in the neighborhoods with high density, axis 1-3t and 1-4t almost match in time and length decisions.
But there is a clear difference in axis 1-5t in which the axis is measured according to time decision driven through many neighborhoods with high density and also market locations. While the axis 1-6t does not different more than an axis measured on the basis of time, except in locations with best paving streets.
Third Decision: Density, for this variable, will be a real expression for the neighbourhoods that are closest to the escape points to evacuate from danger.
A- The area closest to escape point 2 in Figure 8. We can recognize that the area with a radius of (0-4000) m is the best evacuation route is to oriented towards point 2 and some parts of the area (4000-7000) except for what overlaps with the area of escape points 3 or 6.
B- The area closest to escape points 3 and 4 (the entrance to the Industrial area and the Court Street exit) in Figure 9. The evacuation area of these two points is a radius (0-4000) m. So the area is considered to have two exits for these two axes. Additionally, the area with a radius of (4000-7000) m is important as an escape for citizens in its extension towards the crowded center parallel to the river stream.
C- The area closest to escape point 5 in Figure 10. The area with a radius of (0-4000) m and (4000-7000) m is useful as an exit for the residents near point 5 towards Al-Saad Bridge and part of an area with a radius of (7000-10000) m, especially the northern part towards point 1 (the hazard possible entrance point) located on the eastern side of the river.
D- The area closest to escape point 6 in Figure 11. Shows the area with a radius of (0-4000) m and (4000-7000) m, especially the northern part that does not intersect with the area with a radius (0-4000) m of the escape point 2, we can come up with this the point of escape that we can consider the most important exit becouse of its connection to the city center and the densest part in the city, which bears the largest part in addition to the area with a radius of (7000-10000) m in the northern part near point one closest to the ancient city of Babylon.
3.7 Result and discussion
From combined between of network analysis to route and service area (second and third decision) to analysis the city road network find that scenario B is the best as it save about 19.08% from population almost them from center were they be in stragle situation in any disaster and have a less percentage in zone 1 as 2% that cause an easy follow the crowd in less time, as well as have two road serve the same area (1-3,1-4) have small time to cross as (11,301.944,9,237.941) m with all barriers.
Scenario D the second ratio in zone 2 about 17.6% the city’s population, but in zone 12.9% percentage that mean difficult cross only chose the first zone to evucation them and separate zone 2 on the other secinario.
Scenario C is at a less distance of 9,354.9611 m, and zone 1, with 3.5% of the city’s population, is the best for access, as well as 7.1% in zone 2, but most of them are from the city center, and the best direction is away from the holy city of Karbala and the historical city of Babylon.
Scenario A is as 4.9%, 16.5% city's population in zone 1, zone 2, because of the direction towards the holy and university city of Najaf so this scenario cannot be the first option, only in area 1 and it can be destroyed zone 2 in scenarios B, C.
So for complete evucation plan to all city that can use the best scenario can represent a comprehensive spatial plan for the city that includes the 4 proposals for the scenarios is that : all scenario B and first zone in scenario A, first zone of sceinario of zone 6 and the sceinario C to the city center.
4.1 Limitations and recommendations for future work
The research suggests developing a plan based on the indicators and parameters deriving from this scenario according to the nature of each city to form a future plan to protect the city and the safety of its residents, preserve its identity, and reduce the number of losses at the time of the disaster. This can be done by form a regional plan for the governorate and then link it with the rest of the governorates to achieve local and regional safety.
[1] Luque González, A., Coronado Martín, J.Á., Vaca-Tapia, A.C., Rivas, F. (2021). How sustainability is defined: An analysis of 100 theoretical approximations. Mathematics, 9(11): 1308. https://doi.org/10.3390/math9111308
[2] Mega, V.P. (2010). Sustainable Cities for the Third Millennium: The Odyssey of Urban Excellence. Springer Science & Business Media, pp. 13-17.
[3] Jiang, X., Lin, Y., Yang, L. (2023). A simulation-based approach for assessing regional and industrial flood vulnerability using mixed-MRIO model: A case study of Hubei Province, China. Journal of Environmental Management, 339: 117845. https://doi.org/10.1016/j.jenvman.2023.117845
[4] Topchiy, I., Fatkullina, A. (2021). Potential of public and professional communications in implementation of urban environmental programs. International Journal of Environmental Impacts, 4(2): 113-126. https://doi.org/10.2495/EI-V4-N2-113-126
[5] Su, J.Y., Goel, R., Burian, S.J., Barber, M.E. (2021). Assessing climate change linkages related to water quality trading effectiveness for incorporating ancillary benefits. International Journal of Environmental Impacts, 4(1): 77-89. https://doi.org/10.2495/EI-V4-N1-77-89
[6] National Research Council, & Mapping Science Committee. (2007). Successful response starts with a map: Improving geospatial support for disaster management. National Academies Press.
[7] Yashiro, H., Hayashin, T. (2021). Analysis on impact of compact city progress on seismic risk fluctuation. International Journal of Environmental Impacts, 4(1): 25-35. https://doi.org/10.2495/EI-V4-N1-25-35
[8] Stanganelli, M. (2008). A new pattern of risk management: The hyogo framework for action and Italian practise. Socio-Economic Planning Sciences, 42(2): 92-111. https://doi.org/10.1016/j.seps.2006.10.001
[9] Baker, S. (2015). Sustainable Development. Routledge. Sustainable Development - Susan Baker - Google Books.
[10] Matsuoka, Y., Shaw, R. (2011). Chapter 7 linking resilience planning to Hyogo framework for action in cities. In Climate and Disaster Resilience in Cities, pp. 129-147. https://doi.org/10.1108/S2040-7262(2011)0000006013
[11] Cohen, M. (2017). A systematic review of urban sustainability assessment literature. Sustainability, 9(11): 2048. https://doi.org/10.3390/su9112048
[12] Mega, V.P. (2005). Sustainable Development, Energy and the City: A Civilisation of Concepts and Actions. Springer Science & Business Media.
[13] Chang, S.E. (2010). Urban disaster recovery: A measurement framework and its application to the 1995 Kobe earthquake. Disasters, 34(2): 303-327. https://doi.org/10.1111/j.1467-7717.2009.01130.x
[14] Bedewy, B.A.H., Al-Timimy, S.R.A. (2023). Multivariate spatial parameters analysis for estimate essentially fuel station location in al-mahaweel city toward urban sustainability. International Journal of Transport Development and Integration, 7(3): 247-255. https://doi.org/10.18280/ijtdi.070308
[15] Mueller, H., Techasunthornwat, C. (2020). Conflict and Poverty. The World Bank. World Bank Document.
[16] Weijermars, W., Wegman, F. (2011). Ten years of sustainable safety in the Netherlands: An assessment. Transportation Research Record, 2213(1): 1-8. https://doi.org/10.3141/2213-01
[17] Smith, G.P., Wenger, D. (2007). Sustainable disaster recovery: Operationalizing an existing agenda. In Handbook of Disaster Research, pp. 234-257. Springer, New York, NY.
[18] Branscomb, L.M. (2006). Sustainable cities: Safety and security. Technology in Society, 28(1-2): 225-234. https://doi.org/10.1016/j.techsoc.2005.10.004
[19] Mohamed Shaluf, I. (2008). Technological disaster stages and management. Disaster Prevention and Management: An International Journal, 17(1): 114-126. https://doi.org/10.1108/09653560810855928
[20] Mahmoud, A.S., Kalantar, B., Al-Najjar, H.A., Moayedi, H., Halin, A.A., Mansor, S. (2021). Object-oriented approach for urbanization growth by using remote sensing and GIS techniques: A case study in Hilla city, Babylon Governorate, Iraq. Geospatial Technology and Smart Cities: ICT, Geoscience Modeling, GIS and Remote Sensing, pp. 39-57. https://doi.org/10.1007/978-3-030-71945-6_3
[21] Alanbari, M., Alazzawi, H., Al-Ansari, N., Knutsson, S. (2015). Environmental assessment of Al-Hilla city wastewater treatment plants. Journal of Civil Engineering and Architecture, 9(6): 749-755. https://doi.org/10.17265/1934-7359/2015.06.013
[22] Money, R.I. (1917). The hindiya barrage, mesopotamia. The Geographical Journal, 50(3): 217-222. https://doi.org/10.2307/1779909
[23] Bedewy, B.A.H., Al-Timimy, S.R.A. (2023). Estimate suitable location of solar power plants distribution by GIS spatial analysis. Civil Engineering Journal, 9(5): 1217-1229. https://doi.org/10.28991/CEJ-2023-09-05-013
[24] Khan, A., Ruiz Estrada, M.A. (2016). The effects of terrorism on economic performance: The case of Islamic State in Iraq and Syria (ISIS). Quality & Quantity, 50: 1645-1661. https://doi.org/10.1007/s11135-015-0226-9
[25] Zhao, X., Xu, W., Ma, Y., Qin, L., Zhang, J., Wang, Y. (2017). Relationships between evacuation population size, earthquake emergency shelter capacity, and evacuation time. International Journal of Disaster Risk Science, 8: 457-470. https://doi.org/10.1007/s13753-017-0157-2
[26] Lindell, M.K. (1995). Assessing emergency preparedness in support of hazardous facility risk analyses: Application to siting a US hazardous waste incinerator. Journal of Hazardous Materials, 40(3): 297-319. https://doi.org/10.1016/0304-3894(94)00090-4
[27] Zhai, L., Lee, J.E. (2023). Analyzing the disaster preparedness capability of local government using AHP: Zhengzhou 7.20 rainstorm disaster. International Journal of Environmental Research and Public Health, 20(2): 952. https://doi.org/10.3390/ijerph20020952
[28] Li, X., Wang, Y. (2022). Construction of urban flood disaster emergency management system using scenario construction technology. Computational Intelligence and Neuroscience, 2022: 8048327. https://doi.org/10.1155/2022/8048327
[29] Goodchild, M.F. (2007). Citizens as sensors: The world of volunteered geography. GeoJournal, 69: 211-221. https://doi.org/10.1007/s10708-007-9111-y
[30] Goodchild, M.F. (2014). Data modelling for emergencies. Geographical Dimensions of Terrorism. Taylor and Francis. pp. 105-109. https://doi.org/10.4324/9781315810874
[31] Ethaib, S., Zubaidi, S.L., Al-Ansari, N. (2022). Evaluation water scarcity based on GIS estimation and climate-change effects: A case study of Thi-Qar Governorate, Iraq. Cogent Engineering, 9(1): 2075301. https://doi.org/10.1080/23311916.2022.2075301