Thanakom Wongboontham*![]() | Vilas Nitivattananon
| Vilas Nitivattananon![]() | Indrajit Pal
| Indrajit Pal![]() | Thi Phuoc Lai Nguyen
| Thi Phuoc Lai Nguyen![]()
© 2023 IIETA. This article is published by IIETA and is licensed under the CC BY 4.0 license (http://creativecommons.org/licenses/by/4.0/).
OPEN ACCESS
Thailand has the social and economic development policies since 1960s that causes the migration, land change, and population dispersion. The policy effects led to the urbanization in the Chao Phraya River Basin (CPRB) catchment areas, and conceptually synergizes with the water-related disasters by Climate Change. This research aims to highlight the role and influence of urban socio-economic factors on sensitive areas, flood risk exposure, and flood impact in the CPRB. This examination is a multiple-scale analysis based on the Driver-Pressure-State-Impact-Response Framework using data from government agencies. The collected data is utilized in mixed quantitative methods: Principal Component Analysis, Multiple Linear Regression, and K-Means Clustering. The district is a unit of analysis to represent the Meso-level. These data analyses are operated with 17 variables from 295 districts: municipal population, commercial values, water consumption, flood frequency, affected households, and economic losses. As a result, the analysis confirms that urban socio-economics is necessary for urban expansion into flooded areas, especially the Bangkok Metropolitan Region. This expansion can enhance the urban flood risk and impact the local residences and commercials, especially the traditional town and lower-income communities. The finding implies the social and economic adaptive capacity-building requirement for balancing public infrastructure, compensation and funding mechanisms, and institutionalization. Financial measures to support capacity building are necessary. In conclusion, this scrutiny can lead to a strategic resilience framework essential in policy implication. This framework should include social adaptive capacity building, financial funding, and compensation mechanisms in traditional towns and lower-income communities.
socio-economics, anthropogenic, flood resilience, adaptive capacity, DPSIR, Principal Component Analysis, Multiple Linear Regression, K-Means Clustering
The U.N. Sustainable Development Goals (SDGs) are a global direction. Goal 11 emphasizes the integrative SDGs strategies for promoting human health and well-being, making sustainable cities and communities, acting on climate change, protecting the land and ecosystem, building a peacefulness and inclusive society, and strengthening the global partnership for sustainability [1].
In Southeast Asia, human settlement depends on the river because it has been an agricultural society since ancient times [2]. Civilization happened in various river basins, such as the Chao Phraya River Basin (CPRB), the Mekong River Basin, and the Irrawaddy River Basin. The CPRB dominates about 66 percent of Thailand's GDP [3]. Besides the country's GDP, the population in the CPRB accounts for about 20 percent of the country's population. This basin covers the most extensive metropolitan area, Bangkok Metropolitan, which dominates about 30 percent of the country's GDP [4]. It is the center of economic, political, and social development. It is evidence that urbanization has various contexts based on the river basin sub-regions: Upper, Middle, and Lower (Delta) [5, 6].
Industrialization has driven the country's development since the 1960s, which caused the change in the socio-economic context in the first two National Economic Development Plans. It changed the land use function and livelihood. For example, the agricultural and preservative areas have turned to industrial real estate, new housing development, and shopping centers in the Bangkok Metropolitan Region (BMR). It includes five other provinces - Nonthaburi, Pathum Thani, Nakon Pathom, Samut Prakarn, and Samut Sakon. After the economic crisis of 1997, economic and social development expanded in the region through the growth of the service and tourism industry [7]. This urbanization in Thailand is influenced by socio–economic transformation [8]. It is not the end process but refers to enhancing the climate change impacts, especially water-related natural disasters. When socio-economics enhances urbanization in vulnerable and risky locations, managing the impacts of disasters becomes challenging.
Moreover, the impact would be higher if the vulnerable and risky areas consisted of dependent populations, the urban poor, and disabilities [9, 10]. The CPRB location is vulnerable to flood events and other climate change impacts, especially in the BMR [10, 11]. However, it has large catchment areas with various socio-economic contexts, and factors that enhance the urbanization in the CPRB are still under academic controversy. Human activities perturb the local ecology, which can result in human impacts, called "Anthropogenic Risk".
Therefore, this research aims to develop the recommendation of adaptive capacity building as the resilience strategy based on two research questions. What are the critical urban socio-economic indicators that can indicate the scale of the urban districts in the CPRB? How are the urban socio-economic indicators and scales playing the role and influencing the Anthropogenic risk in CPRB's urban districts? Based on the research questions, there are two objectives for this research. First, it aims to identify the urban socio-economic indicators and characteristics of the CPRB. Second, it seeks the role and influence of urban socio-economic factors contributing to the Anthropogenic risk of urban flooding in the CPRB floodplain areas.
This study has the scope to focus on district–level analysis. The district and group of districts can represent the "Meso", the governing scope between the Micro and Macro levels. Defining governing boundaries based on the issue and problem at this level is challenging, such as water, disaster, and urban planning. The Meso is essential to urban and regional planning and policy processes. The data input is from 295 districts from 31 provinces in 2002, 2007, 2012, and 2017. Therefore, this research aims to analyze the role and influence of urban socio-economics that can indicate the anthropogenic risks of the urban districts in the CPRB, based on the existing government data, to enhance the regional urban flood resilience framework.
2.1 Concept of sustainable development, resilience, and adaptation in urban ecological system
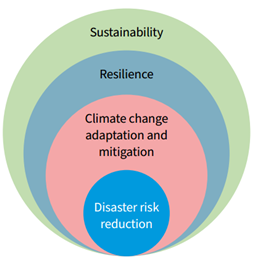
Global society has accepted the U.N. sustainable U.N. SDG to adapt in the country. The SDGs 11 promotes human health and well-being, making sustainable cities and communities, acting on climate change, protecting the land and ecosystem, building a peacefulness and inclusive society, and strengthening the global partnership for sustainability [1]. The relationship between urban planning, risk governance, and resilience is essential to the urban ecological system [12]. Their interaction can affect the sustainability in the specific location, as shown in Figure 1.
Figure 1. Context of resilience and sustainability
Source: [12]
The academic community has long discussed the concept of resilience. According to Melkunaite [13], resilience relates to the economy, infrastructure, ecology, or community systems. The performance consists of the term’s capacity, ability, and manageability. The key terms associated with climate action are absorbing, adapting, transitioning, transforming, and quality. "Resilience capacity" depends on anticipation, resources, continuity, and transformative structure [14]. It refers to the system's ability to anticipate reducing climatic hazard impacts through preparedness and planning. It consists of three phases of capacity building, which are coping, adaptive, and transformational capacities. The coping capacity is the system's ability to cope with the impacts and stresses based on the available resources in static flood events. Adaptive capacity is the system's ability to respond to climatic hazard risks in the long-term impacts and pressures. It leads the system adjustment through the deliberative plan and decision-making under the system's transition. The transformative capacity is the system's ability to deliberate for changing the system's structure to reduce, avoid, or disrupt risk, vulnerability, and inequality.
Adaptability is a transitioning phase of the system transformation for resilience capacity. It refers to the human ability to build resilience through collective actions determined by social, natural, manufacturing, capital, governance, and institution [15]. The resilience enhancement automatically functions for prevention and feedback in a back-loop transition. The ecosystem and human interactions are at local, sub-regional, and regional scales. The local ecosystem relies on local management in the short run. The institution is a reprocessing to adapt to the changing environmental situation at a sub-regional scale. The regional scale is based on the institution's role and function in the environment. Resilience nowadays focuses on managing the regional ecosystem to deal with the impact of changes at multiple scales to keep the linear target, such as area expansion, economic growth, and river cleanliness [16].
2.2 The role and influence of socio-economics on the urban ecological system
The urban ecological system is the interaction among the Geosphere, Biosphere, and Anthroposphere, which means earth, wildlife, and humans. The anthroposphere is the human interaction that can affect the geosphere or biosphere. The high human interaction is in urban areas where people live at a high density and build the infrastructure on the land surface [17]. It enhances and damages the geosphere and the biosphere through the economy, governance, and civil participation [18]. Consequently, the change in the geosphere and biosphere has an effect backward on human perception and well-being.
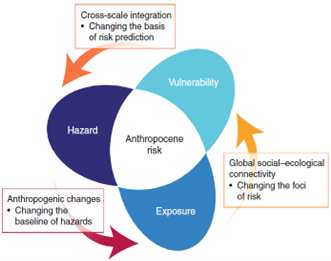
Human activities or socio-economic factors can indicate the risk on multiple scales. Its process must improve the complex adaptation to the risk of cross-scale and cross-sectoral climate change [19]. The risk framing mostly fails to resolve at the small-scale system [20] in study of Keys et al. [19].
Figure 2 shows the anthropogenic risk feature from the socio-economic change, which is the shift of the earth's system by human activities. Human interaction can be the determination and feedback of the earth's system from local to global. Thus, to understand the Anthropogenic risk, one needs to realize what human activities have done to change the global system and the social ecology that can point to the vulnerable group. The risk appears in the crossing and multiple scales. Consequently, the local scale is the critical challenge to assessing and monitoring the Anthropogenic risk for designing adaptive capacity-building measures.
Figure 2. Concept of anthropogenic risk
Source: [19]
2.3 Urban socio-economic flood risk assessment
This part reviews the studies on flood risk assessment based on urban socio-economic factors. Marin and Modica [21] presented the socio-economic exposure of territories to provide information for risk management strategies in Italy's multiple scales. They analyzed the socio-economic exposure territories that can take risks from natural disasters. This analysis concerns the direct and indirect components of exposure. Input-output modeling is a tool to analyze socio-economic factors, especially monetary factors like business turnover, capital stock, and productivity. After crossing with the natural disaster, they can provide the multiple scale risk map on the possible economic damages that the municipalities need to concern disaster risk management plan. The socio-economic and natural dimensions are used to develop the risk assessment framework as the decision-making tool for Italian municipalities [22]. It developed composite indicators integrating multi-dimension disaster risks - hazards, exposures, vulnerability, and resilience. The cluster analysis indicates six types of municipality risk that can make the disaster risk governance. Previous literature presents the relationship between socio-economic exposure, urban ecosystems, and natural disasters. It needs methodologies to integrate the socio-economic condition to demonstrate the change in the urban ecological system. Within these concerns, Xie et al. [23] integrated the socio-economic and environmental data to assess urban sustainability in Inner Mongolia. They used mixed quantitative methods between Principal Component Analysis (PCA) and Ecosystem Service Value-based Urban Sustainability Index (ESV-USI) to build the monitoring indicators of an urban environment. These methodologies result in the socio-economic factors affecting the urban ecosystem, which leads to natural disasters in the urban areas.
Xu et al. [24] analyzed scenarios on sea rising levels (SRL), urban growth, and coastal flood risk assessment in Xiamen, China. In urban growth, this research found urban sprawl from the residents, commercial, public land, and industrial land. Within these urban land-use categories, the commercial is the most rapid growth to synergize with coastal flooding. Hu and He [25] developed an integrated approach to urban adaptive capacity (UAC) based on the DPSIR. The method is Grey Relational Analysis (GRA) and Entropy. They can evaluate the effective development of the UAC. These previous studies conclude that the socio-economic risk assessment is highly concerned by the international academic society with the multi-level governance through several quantitative methodologies - factor analysis, clustering analysis, and a composite index.
2.4 Urban socio-economic flood risk assessment and resilience in Thailand
In Thailand, a flood is a critical disaster based on the root of the basin society along the CPRB [26]. It is one of the most water-related vulnerable basins [27]. This flood inundation is complicated in the urban area [28], and it is a trend to be more frequent [27, 29-31]. Thus, floods in Thailand's urban areas are an apparent complication between urban flood and socio-economics.
The study of socio-economics focuses on a multidisciplinary approach to public policy development. Friends et al. [8] reported to the ACCCRN that urban socio-economic factors depend on the population, density, land price, city background, and economic structures. It impacts the urban ecological system through the transformation of employment, livelihoods, and infrastructure development and affects increasing urban poverty and vulnerability. It considers local people and newcomers to seek economic opportunity. The direction of local economic activities also concerns the pattern of the community and consumption. Urban expansion is based on population growth that causes the loss of the green space proportion in land use and land cover changes in the BMR [32, 33]. This expansion increases the peri-urbanization in mega-cities like the Bangkok Metropolitan Region (BMR) [34]. Limthongsakul et al. [34] state that the peri-urbanization problem is a mismatch of authority and transboundary infrastructure development, particularly a draining system. The better infrastructure is built with the new real estate development from the private sector. This building causes more flood frequency and higher levels of flood in the existing traditional town, which is not covered by new infrastructure development. Additionally, this traditional town is primarily a lower–middle income community, and they have lower protection capacities than the new real estate, which is the higher income.
The socio-economic indicators in the flood risk assessment are generally considered with the effect of climate change as the Socio-economics Pathways (SSPs). Koonthanakulwong et al. [35] cited O'Neill et al. [36] to declare the socio-economic variables in the SSP1 - 3. This study considered the population and the agriculture and service sectors' GPP. However, the GPP cannot specify the economic activities at the local level - district because the government data is generally open on the provincial scale. Hence, the socio-economic indicators are theoretically related to the population, agriculture, service economic activities, consumption, and land use.
The socio-economic assessed the flood risk at the local level by Singkran [31]. In this study, the variables are flood-related and vulnerable. The vulnerability variables include the physical environment, socio-economic features, land use, and soil types. The assessment is a calculation in the index form in ArcGIS's natural breaks method to categorize flood risk in spatial zones. Although land use can indicate socio-economic, it cannot reflect the land use function that can point out the socio-economic factors [35]. Thus, fulfilling the socio-economic flood risk assessment should shift the focus to the raw socio-economic data to find the relation with flood variables.
2.5 Socio-economic indicators for urban resilience and adaptive capacity building measures
Urban socio-economics is reviewed to analyze the risk and resilience capacity. The next step inspects the theoretical indicators for selecting the data collection method. The research reviews on the related literature about urban socio-economic and resilience are in Table 1.
Table 1. Socio-economic indicators for the urban resilience
|
Authors |
Urban Socio-Economic Dimensions/Indicators |
||
|
Social |
Economic |
Land Use |
|
|
Friend et al. [8] |
|
|
|
|
Hu and He [25] |
|
|
area of natural reserves |
|
Koonthanakulwong et al. [35] |
|
|
|
|
Malakar and Mishra [37] |
|
|
|
|
Katic [38] |
|
|
|
According to the review, urban socio-economics can indicate the level of urbanization, which influences the urban flood risk. However, there is doubt about the leading indicators that measure urban socio-economics, which means anthropogenic activities. This urban socio-economics can enhance urban flood affecting human capital, such as low-income, poorly educated, and sensitive economies [37]. Therefore, vital urban socio-economics is necessary to clarify social and economic sensitivity to contribute to urban resilience, which can help society and the economy cope and adapt to the future flood situation.
According to the WHO [12], the sustainable pathways include risk reduction, adaptive capacity building, and resilience. In this research, adaptive capacity enhancement must be matched with the urban socio-economic-related risk factors. The adaptive capacity measures are reviewed in Table 2.
Table 2. The list of adaptive capacity measures
|
Authors |
Adaptive Capacity Building Measures |
|
Social Adaptive Capacity |
|
|
Chao-Amonphat et al. [33] |
|
|
Limthongsakul et al. [34] |
|
|
Pronk [39] |
|
|
Economic Adaptive Capacity |
|
|
Kato and Charoenrat [40] |
|
|
Hallegatte [41] |
|
3.1 Conceptual framework
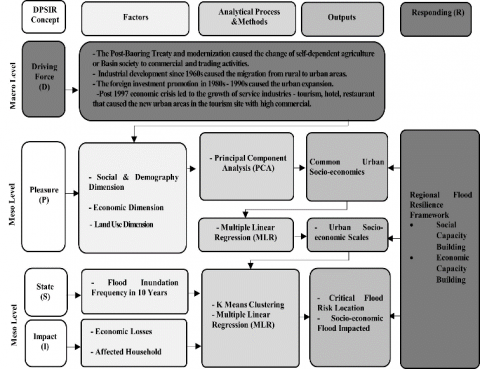
This research is a deductive approach based on the theory and concept of the urban ecological system and resilience. The concept is the Driver-Pressure-State-Impact-Response (DPSIR) framework, an integrated model to assess the interactions between human activities and ecological systems [25]. The framework utilizes Derivers, Pressure, State, and Impacts, and their interactions can lead to the urban resilience framework as the “Responding”. It appears that hierarchical environmental problems can be resolved by risk reduction, adaptive capacity, and resilience that leads to sustainability. The Conceptual framework of this research is developed as presented in Figure 3.
Figure 3. The research conceptual framework
Source: Adapted from researches [8, 23, 25, 31, 35, 37, 39, 42]
Figure 3 also presents the analytical factors that can be input into the quantitative analysis. The driving force assumption is based on the urban development background. As Wanlipodom [27], Thailand's social and economic development policy since the 1970s has motivated migration and expanded the urban areas into green and agricultural areas. This change also includes economic activities. These assumed driving forces lead to the hypothesis that urban socio-economic changes are the Pressure on the urban ecological system. The demand for public and private services is higher when the population increases from the higher income because of the higher investment in manufacturing and commercial. In the next step, the urban level increased along with the social and economic growth, which invaded the regular flood areas. Consequently, the population and economic sectors that settle in flood areas are entirely impacted by the higher level of urban flood. Therefore, the analysis's result is utilized to develop the urban and regional flood resilience framework as the Responding.
3.2 Methodology process
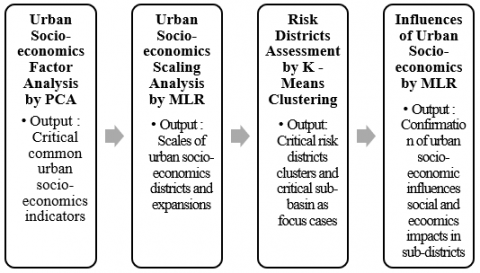
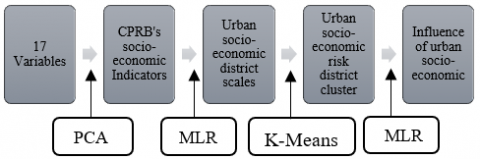
The research process follows deductive reasoning, which is the effort to conclude the role and influence of urban socio-economics contributing to the anthropogenic risk in the CPRB (Figure 4).
Figure 4. Overall research process
The methodology consists of three steps to prove the hypothesis, as explained in Section 3.1. It is a mixed method among Principal Component Analysis (PCA), Multiple Linear Regression (MLR), and K-Means Clustering. These three analytical methods are operated by SPSS software. The PCA extracts the possible urban socio-economic indicators based on theoretical and conceptual indicators in the literature reviews. Seventeen variables are inputted to PCA for finding the first set of variables from the analysis in three sub-basins. These sub-basins finding indicators are crossed the common character. The MLR is used in two stages of analysis. In the first stage, it operates the linear relationship between the finding common indicators. This analysis measures the urban district scales and urban expansion patterns into the floodplain areas. The K-Means Clustering analyzes the urban district clusters based on the risk. This cross-section is between socio-economic, flood frequency, affected households, and economic losses. The MLR's second stage is on the influence of urban socio-economics in the critical-risk urban districts. This part is finding the urban flood impact by the influence of urban socio-economic. The analytical process is presented in Figure 5.
Figure 5. Analytical process
3.3 Study area
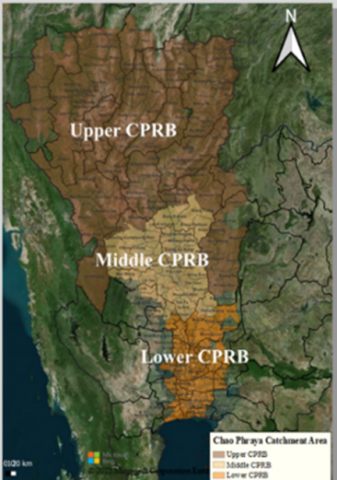
Chao Phraya River Basin (CPRB) is an essential basin in Thailand. It has a high contribution to Thailand's economy and society because it combines Ping, Wang, Yom, Nan, and Chao Phraya from the north to the middle of Thailand. It is also related to the other basins, such as Pethchaboon, Sakrakang, and Tha Chin.
The CPRB comprises three catchment areas - upper, middle, and lower as shown by Figure 6. The upper CPRB is the northern highland and covers Ping, Wang, Yom, and Nan Rivers. It flows down to a flat plain area that covers the middle CPRB. It is defined as "hydrological boundaries" because it is a natural floodplain of the CPRB [6]. The lower CPRB is under the basin's delta and covers Thailand's most important area - the Bangkok Metropolitan Region (BMR).
The governance is under three administrative systems: central, provincial, and local administration. The provincial governor and district sheriff control the decision power based on legal action. Meso-level governance (at provincial and district level) is a response to the challenge of research rationality. Hence, this study converses 295 districts from 31 provinces as units of analysis because it bridges provincial and local administration, including the Bangkok Metropolitan Administration (BMA).
Figure 6. CPRB's base map
Source: [5, 6]
3.4 Data collection
The socio-economic data is collected as secondary data based on reliable organizations, such as the National Statistics Office (NSO), the Department of Provincial Administration (DOPA), and the Community Development Department (CDD). The second data set is about disaster, which emphasizes on frequency of flood inundation in the districts. A total of 1,180 samples are from 4 years data of 295 districts: 2002, 2007, 2012, and 2017. The collected variables are shown in detail in Table 3.
Table 3. Urban socio-economic indicators with description and available data
|
Socio-Economic Factors |
Indicators |
Description |
Descriptive Function |
Unit |
Years |
Sources |
|
Social & demography (Indicating the population expansion) |
Municipal Population |
The registered population in the municipal area. |
Exposure/Sensitivity |
Persons |
2002, 2007, 2012, 2017 |
NSO & DOPA |
|
Non – Thai Population |
The registered non – Thai population in the district. |
Exposure/Sensitivity |
Persons |
2002, 2007, 2012, 2017 |
NSO & DOPA |
|
|
Net Migrants |
In–migrant minus Out – migrants in the district |
Exposure/Sensitivity |
Persons |
2002, 2007, 2012, 2017 |
NSO & DOPA |
|
|
Population Density |
Total district population per area. |
Exposure/Sensitivity |
Persons per km2 |
2002, 2007, 2012, 2017 |
NSO & DOPA |
|
|
Economy (Indicating the local and regional economic activities) |
Employment |
The number of employees who are over 15 years old in the district. |
Exposure/Sensitivity |
Persons |
2002, 2007, 2012, 2017 |
CDD |
|
Local Tax Revenue |
The sum of the local government's tax revenue each year. |
Exposure |
Bath per Million |
2002, 2007, 2012, 2017 |
NSO |
|
|
Public Expenditure |
The sum of the local government expenditure each year. |
Exposure |
Bath per Million |
2002, 2007, 2012, 2017 |
NSO |
|
|
Household Income |
Average household income per year in each district. |
Exposure/Sensitivity |
Bath per Million |
2002, 2007, 2012, 2017 |
NSO&CDD |
|
|
Household Expenditure |
Average household expenditure per year in the district. |
Exposure/Sensitivity |
Bath per Million |
2002, 2007, 2012, 2017 |
NSO&CDD |
|
|
Commercial Value |
The provincial non – agriculture and non–industry per capita cross with the number of commercials in the district. |
Exposure/Sensitivity |
Bath per Million |
2002, 2007, 2012, 2017 |
CDD&NESDC |
|
|
Industrial Value |
The provincial industry per capita crosses with the number of factories in the district. |
Exposure/Sensitivity |
Bath per Million |
2002, 2007, 2012, 2017 |
CDD&NESDC |
|
|
Electricity Consumption |
The total number of electricity consumption each year. |
Exposure |
Kwh |
2002, 2007, 2012, 2017 |
NSO&CDD&MMEA |
|
|
Water Consumption |
The total amount of public water consumption each year. |
Exposure |
m3 |
2002, 2007, 2012, 2017 |
NSO&CDD |
|
|
Land Use (Indicating the change of land function) |
Community Areas |
The total areas of the traditional town residential community in the districts. |
Sensitivity |
km2 |
2002, 2007, 2012, 2017 |
CDD&LDD |
|
Agriculture Areas |
The total agricultural activities areas in the districts. |
Sensitivity |
km2 |
2002, 2007, 2012, 2017 |
CDD&LDD |
|
|
Forest Areas |
The total forest areas in the district. |
Sensitivity |
km2 |
2002, 2007, 2012, 2017 |
CDD&LDD |
|
|
Open Space |
The total open public areas in the district. |
Sensitivity |
km2 |
2002, 2007, 2012, 2017 |
CDD&LDD |
|
|
Disaster Risk Indicating |
Flood Frequency |
The number of district's flood inundations within ten years |
Hazards |
Times |
Average 10 years during 2007-2017 |
LDD |
|
|
Economic Losses |
The reported economic losses from flood inundation each year |
Vulnerability |
Baht per Year |
2002, 2007, 2012, 2017 |
DDPM |
|
|
Affected Household |
The reported number of district households affected by the flood. |
Vulnerability |
Households per Year |
2002, 2007, 2012, 2017 |
DDPM |
Table 3 shows the collected quantitative data from reliable government sources in 20 datasets as indicators that will be examined in their linear relation. The 17 datasets represent three urban factors: social and demography, economy, and land use. The other three datasets are disaster data, which includes flood frequency, economic losses, and affected households.
3.5 Data analysis
This research utilizes mixed quantitative methods: PCA, MLR, and K-Means Clustering to analyze the 17 datasets at the district level, which includes 295 districts - 122 in the lower, 48 in the middle, and 125 in the upper CPRB. The dataset is from 2002, 2007, 2012, and 2017, with a total of 1180 samples: 488 for the lower, 192 for the middle, and 500 for the upper CPRB. The data analysis has three main steps.
1) Principal Component Analysis (PCA) is selected as the factor analysis. The theoretical background of urban socio-economic indicators is multi-dimensional factors, and it concerns many indicators. The PCA reduces the multi-dimensional indicators to be the most implementable indicator. The operation of PCA proceeded with seven steps.
1.1) Standardization is adjusting the 17 variables in the form of normalization.
1.2) Sampling adequacy examination is the samples testing for variables adequacy by the Kaiser-Meyer-Olkin Measure of Sampling Adequacy, which should be higher than 0.5.
1.3) The correlation matrix examines the variable's relations in the positive, negative, and constant.
1.4) Exacting variables are to examine the percent of the explainable variables. The eigenvector and Eigenvalue analyze the linear correlation among the variables.
1.5) The matrix among the variables shows the component matrix with the eigenvector.
1.6) the matrix rotation is operated by the "Verimax" method. The eigenvector must be higher than 0.3 for the lower and upper CPRB because the samples are higher than 350 and 0.45 for the middle CPRB because the samples are between 150 - 200 [43].
1.7) Finalizing components is making the indicators for each sub-basin. They are compared to find the common socio-economic indicators of the CPRB.
2) Multiple Linear Regression (MLR) is operated because it can examine the relation and Coefficient of variables. The MLR's purpose is to model the relationship between common socio-economic indicators. The other purpose is to clarify the relationship between urban socio-economic indicators and affected households, economic losses, and total impacts. This analysis result verifies the influence of urban socio-economic on flood risk and impacts. The analysis consists of four main steps.
2.1) the normal distribution testing is first examined. If the dataset is not the normal distribution, the data is transformed into a logarithm (Log-linear Model).
2.2) the examination of Autocorrelation is tested by Durbin - Watson value between 1.5 and 2.5.
2.3) the coefficient examination is operated to test the hypothesis. The result can be expressed as an example Eq. (1).
$\log \left(Y_i\right)=\beta_0+\beta_1 X_{i 1}+\ldots+\beta_n X_{i n}+\epsilon$ (1)
where, Log(Y)i = Predicted value of dependent variables
Xi = Explanatory variables
β0 = Constant or Y – intercept
βn = Coefficient for each explanatory variable
ε = error term.
2.4) The tolerance and VIF value inspect the collinearity examination. It must be close to 1, and the VIF should be as low as possible.
3) K-Means Clustering examines the risk districts, which are cross-cutting among the index of the urban scales, flood frequency, and flood impacts. The research expected three groups of risk districts to cluster the anthropogenic risk districts. It consists of four steps.
3.1) Defining the specific group and initiating the centroid.
3.2) Computing the Euclidean distance for each data member to assign the data member to the closest centroid.
3.3) Computing the distance's means of the data member and centroid and redefining the new centroid of each group.
3.4) Repeating steps 2 and 3 until the specific group has gotten the stable centroid or the same centroid.
The GIS, operated by the freeware QGIS, can portray the K-Means Clustering result. It presents the different types of urban flood risk based on socio-economic characteristics. Ultimately, this research focuses on the high anthropogenic risk districts.
4.1 Urban socio-economic indicators and characteristics
4.1.1 Urban socio-economics factor analysis by Principal Component Analysis (PCA)
Based on the research literature review about socio-economic indicators that are theoretical and conceptual input for global and local urban analysis. The research gathered government data from 295 districts covering 2002, 2007, 2012, and 2017. There are 17 datasets, as shown in Table 2. These 17 datasets are edited as the variables to find the highest variance of each sub-basin, or they are enlisted as the principal component 1 in each sub-basin analyzing operation by PCA. The result is presented in Table 4.
Table 4. Common urban socio-economic factors among three sub-CPRBs
|
Factors |
Indicators |
Loading Factor |
||
|
Lower CPRB |
Middle CPRB |
Upper CPRB |
||
|
Social/Demography |
Municipal Population (X1) |
0.718 |
0.831 |
0.850 |
|
Non -Thai (X2) |
|
|
0.542 |
|
|
Net–migrant (X3) |
|
-0.839 |
|
|
|
Density (X4) |
0.431 |
0.803 |
0.645 |
|
|
Economy |
Employment (X5) |
0.823 |
|
|
|
Tax (X6) |
|
|
0.773 |
|
|
Public Expenditure (X7) |
|
0.868 |
0.593 |
|
|
Household Income (X8) |
0.872 |
|
|
|
|
Household Expenditure (X9) |
0.763 |
|
|
|
|
Commercial Value (X10) |
0.695 |
0.488 |
0.428 |
|
|
Industrial Value (X11) |
|
|
|
|
|
Electricity Consumption (X12) |
|
0.847 |
0.817 |
|
|
Water Consumption (X13) |
0.598 |
0.860 |
0.884 |
|
|
Land Use |
Community Areas (X14) |
-0.305 |
|
|
|
Agricultural Areas (X15) |
-0.386 |
|
|
|
|
Forest Areas (X16) |
|
|
|
|
|
Open Space Areas (X17) |
0.320 |
|
|
|
Sources: Analysis by SPSS based on the data from NSO, DOPA, CDD, NESDC, MEA, and LDD
The result in Table 4 is a summary of PCA in three sub-basins. There are three factors with seventeen sub-indicators or variables. The social and demography consists of four sub-indicators. The economy has nine sub-indicators, and land use has three sub-indicators.
The result is identifying and characterizing the urban socio-economic in three sub-basins. Previous research like Friend et al. [8] and Koonthanakulwong et al. [35] used the growth of population and population density to indicate urban growth. However, this research has a different viewpoint to indicate urban growth based on administrative boundaries. The municipal population is tested, and it is significant to indicate the urban growth and population density. Either of them is found in all three sub-basins. The difference in the population indicator is also considered as the indicator list of Koonthanakulwong et al. [35] and Malakar and Mishra [37] consider net migrants. Under this concern, the research tested the number of non-Thai population and net-migrants. The non-Thai is found significant in the upper CPRB, and net-migrant is inversely significant in the middle CPRB. This indicator means the entire basins have common municipal population and density indicators, which are autocorrelated. Hence, this research is interested in the municipal population as the indicator.
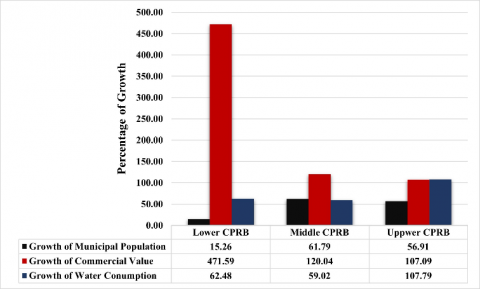
The importance of economics is necessary to understand its characteristics of livelihood. The lower CPRB is the most significant economic area in the CPRB. The PCA found that the individual economic indicators are employment, household income, and household expenditure. According to Friend et al. [8], individual economic conditions have driven the local economy. On the other hand, the economy in upper and middle CPRB is related to government expenditure. Tax earnings are found only in the upper CPRB. This means the importance of government affairs to the local economy. Koonthanakulwong et al. [35] and Hu and He [25] are concerned with resource consumption, such as water and electricity. The research found the water consumption is a highlight for resource usage. The commercial value is also found in the entire basin. It includes retail and wholesale trading, the service sector, and tourism. It increased its importance to Thailand’s economy for 20 years after the 1997 economic crisis [7, 44]. Hence, the general perspective of CPRB's urbanization can be indicated by municipal population, commercial value, and water consumption. These indicators can consider the growth as shown in Figure 7.
Figure 7. Trend of CPRB's critical urban socio-economic indicators during 2002 – 2017
Source: Analysis by SPSS and Microsoft Excel based on data from NSO, DOPA, and CDD
Figure 7 shows the growth of the critical urban socio-economic indicators. It can be found that the municipal population in the lower CPRB has grown only 15 percent, but the commercial value is growing 472 percent with 63 percent of water consumption growth. The trend of living in the municipal area is a high solid growth, 62 percent in the middle CPRB and 57 in the upper CPRB. The commercial value is a growth of 120 percent and 107.9 percent, respectively. Water consumption is growing 59 percent in the middle CPRB and 108 percent in the upper CPRB. It means that the lower CPRB is a robust economic region in which commercial activities have a powerful influence. The middle and upper CPRB found that the people have a higher trend to live in the municipal areas, and the commercial activities and water consumption are increased.
4.1.2 Urban socio-economics scaling analysis by Multiple Linear Regression
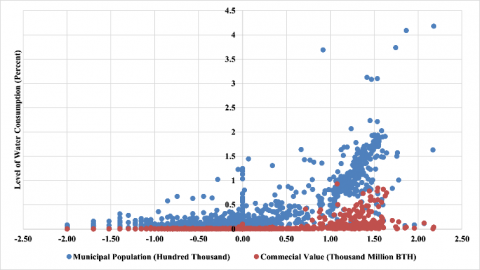
The main point of this analysis is to categorize the urban socio-economic district scale. However, it needs to understand the critical indicator's linear relationship between municipal population, water consumption, and commercial value. Theoretically, water consumption can be determined by increasing the population and commercial activities [45, 46]. Then, the data modeling examines the linear relation built by Eq. (2).
$\log \left(X_{13}\right)=-0.402+0.00001045\left(X_1\right)+0.001\left(X_{10}\right)$ (2)
As a result, Eq. (2) can explain the relation of the municipal population and commercial value to the water consumption at 57.4 percent (R2 = 0.574) with no Autocorrelation problem (Durbin - Watson = 1.601). These two variables have a significant relation in predicting water consumption. The linear relation has no Collinearity problem as the VIF is only 1.211 and the Tolerance is 0.826.
The result can accept the hypothesis that the municipal population and commercial value can increase water consumption in the CPRB. When the municipal population increases by 100,000 people, water consumption will increase by 1 percent. The commercial value increases every 1 million baht; the water consumption will be 1 percent higher. Their relations can be shown as a scatter plot in Figure 8.
Figure 8. The relation of urban socio-economic indicators in the CPRB
Source: Analysis by SPSS and Microsoft Excel based on data from NSO, DOPA, CDD, NESDC, MEA, and LDD
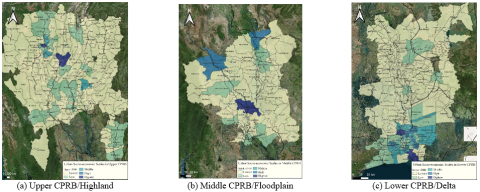
After the model has been built, the urban socio-economic scales are analyzed based on this model. The predicted value of water consumption levels is mapped at the district scale. The different urban district scales are mapped in Figure 9.
Figure 9. Scales of urban socio-economic in the CPRB
Source: Analysis by SPSS and QGIS based on data from NSO, DOPA, CDD, NESDC, MEA, and LDD
Figure 9 shows the urban socio-economic scales in three sub-basins: the lowest, low, middle, high, and highest. Figure 9a presents the high urban socio-economic scale around Muang Chiang Mai district, Chiang Mai province. Friend et al. [8] said that Chiang Mai is inspired by business and tourism centers. It has many foreigners, and the service industry is glowing. This sector is why the research found the commercial value and water consumption are high in these areas. From that study before 2016, Chiang Mai has expanded to the surrounding district within Chiang Mai province. Additionally, this research found the urban sprawl to connect with the Muang Lampang and Muang Lamphun, a district center in the neighboring provinces. This expansion seems to have the same characteristics as the BMR in lower CPRB. Thus, this area can be called "Chiang Mai Metropolitan" because it is the social and economic center in the region.
The middle CPRB, Figure 9b, is defined as the hydrological boundaries of the CPRB because it is a floodplain area [6]. The regional center is at Muang Nakon Sawan, Nakon Sawan province. This district is the origin of the Chao Phraya River from the combination of the Nan and Ping Rivers. These two rivers connect Muang Phitsanulok and Muang Kamphangphet in the northeastern and northwestern, respectively. Muang Phitsanulok in Phitsanulok province is also the administrative center and is Nan River-related (eastern side). The research found that the middle urban socio-economic scale is expanding south of Muang Phitsanulok, connected to Muang Phichit in Phichit province, an essential agricultural area in CPRB. On the other side of the sub-basin, Muang Kampangphet (the western side) has a high urban socio-economic level. This district is related to the Ping River, the main river on the western side of the country. The pattern of these districts is problematic to expand because they are high agricultural land functions that depend on public service and facilities. The urban districts are the government administrative centers of the region. Hence, these urban districts are the characteristics of primate cities surrounded by rural areas.
The lower CPRB is the most important catchment area of the CPRB (Figure 9c). From the viewpoint of historical study, this sub-basin is the ‘Basin Society” or “Agricultural Society” [27]. It is currently the largest agricultural production area outside the BMR, especially paddy field farming. The BMR, on the southern side, covers five provinces at the estuary of the Thai Gulf. In this area, the highest and high urban district scales are found. As Friend et al. [8], they understood that inner Bangkok is the highest urban density. However, this research found that inner Bangkok may be the economic and financial center, but the high human activities have been moved to the edge of Bangkok. The focused districts should be Muang Nonthaburi on the northwestern side and Muang Samut Prakarn on the southeastern side. They are evidence of urban expansion from the inner to outer Bangkok. The Muang Nonthaburi connects with the new government center called “Changwattana Government Center” in Bangkok’s Laksi district. Muang Nonthaburi and surrounding districts were a crucial horticultural area even though they are still producing paddy fields nowadays.
Conversely, Muang Samut Prakarn was a mangrove and coastal fisheries. After the industrial policy, it became part of eastern seaboard industrial areas. Both the government center and eastern seaboard can motivate urban sprawling and land and housing prices that are unaffordable for middle- and low-income households [8, 47].
Therefore, this research can summarize the critical urban socio-economic indicators and characteristics of the CPRB. Generally, the urban socio-economic scale district can be indicated by municipal population, commercial value, and water consumption. These indicators point to the urban district scales and characteristics in each sub-basin. The middle and upper CPRB have similar characteristics to urban districts. The local commercial and government activities, such as private and public services, public expenditure, and traveling, increase the urban districts. In the upper CPRB, Muang Chiang Mai district is the origin of urban expansion to the surrounding districts in the metropolitan pattern. This pattern is also found in the middle CPRB in Muang Phitsanulok district, which is expanding to the southern side. The center of middle CPRB is Muang Nakon Sawan, the transportation hub to interlink inland water, highways, and railways. In the lower CPRB, urban areas are expanding from inner Bangkok to dense at the edge of Bangkok. This expansion caused a change in agricultural land use, traditional town community, and livelihood. However, this result may change or adjust when more variables are available, especially land and housing prices that cannot be covered backward to the analysis year. Land price is an interesting indicator of urban expansion and new real estate development.
4.2 The role and influence of urban socio-economic and anthropogenic risk to urban flooding
4.2.1 Critical urban district risk assessment by K-Means Clustering
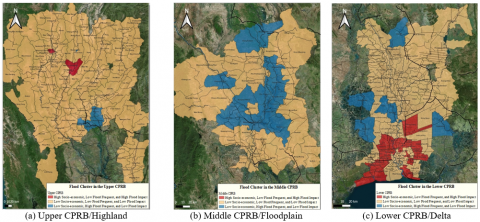
The K-Means Clustering is used for flood risk assessment in three sub-basins. This operation crosses urban socio-economic scales, flood frequency, affected households, and economic losses. In the analyzing operation, the K-Means Clustering is an order to analyze the data from 295 districts. In the analysis, the clustering order is three clusters. As a result, the research can cluster the districts into three clusters, as shown in Figure 10.
Figure 10. Cluster of the flood risk impacts in CPRB
Source: Analysis by SPSS and QGIS based on data from DDPM and LDD
The result of K-Means Clustering is separated into three clusters. Cluster 1 comprises 29 districts, and cluster 2 consists of 23 districts. Cluster 3 has 243 districts with low urban socio-economic scales, low flood frequency, low economic losses, and low affected households. Figure 10 presents the contribution of urban socio-economics to the flood and flood impacts as the district clusters. First, it is the Anthropogenic risk districts (red) because they result in high socio-economic scales and flood impacts even though urban flood events are not frequent. It usually appears in the lower and upper CPRB around the BMR and Muang Chiang Mai. The result in the BMR is according to Marome [48], Limthongsakul et al. [34], and Singkran [31]. They studied urban flood risk in the BMR and found overlapped flood risk areas in the northwestern, northern, and northeastern of Bangkok covers, such as Muang Nonthaburi, Pakkred, Thanyaburi, Klong Sam Wa, Ladkrabang, and Muang Samut Prakarn. However, this analysis found that the extension of urban flood risk moved to the western side. It covers Bang Yai, Bang Kluy, Sai Noi, Bang Bon, Muang Samut Sakon. The pattern becomes an Urban Flood Risk Ring surrounding the BMR. Second, the natural risk districts (blue) are the high flood frequency areas. It happens along the riverside and wetland areas, according to Jumrassi and Toda's explanation [6]. This type of risk can be mainly found in all three sub-basins with different characteristics. Upper and middle CPRB is directly related to the Yom and Nan Rivers. It is also found in the lower CPRB in the western and eastern wetlands designed as floodplain areas. The interesting point of this type is that on the higher level of urban socio-economic scales in the future, some districts, especially Muang Nakon Sawan and Muang Phitsanulok, will be moving into cluster 1. The risk attributes are summarized in Table 5.
In summary, the urban socio-economic can play the flood influencer role to increase the flood risk in the large urban districts. The BMR’s districts in the lower CPRB and Muang Chaing Mai in the upper CPRB are the highly concerned areas. These areas usually have a high flood impact, although floods are not frequent because of the high urban socio-economic conditions. On the other hand, the natural flood risk areas may not initially concern the urban socio-economic condition because flood events usually happen. Within this case, the necessity of urban socio-economic would be a concern afterward with the flood impacts.
Table 5. Types of flood risk in the CPRB
|
Type of Risk |
Urban Socio-Economic Scales |
Flood Frequency |
Flood Impacts |
|
Type 1 - Anthropogenic Risk |
Middle - High |
Low - Middle |
High |
|
Type 2 – Natural Flood Risk |
Low - High |
Middle - High |
Middle |
Source: Analysis by SPSS based on data from DDPM and LDD
4.2.2 Influence of urban socio-economic on urban flooding and flood impacts in the lower CPRB by MLR
The relationship between disaster risk reduction, adaptation and mitigation, resilience, and sustainability are consequent. Building adaptive capacity must be based on identified risks to anticipate the effective adaptation [14]. Chao-Amonphat et al. [33] indicated that urbanization in CPRB had increased flood risk and impact. After the research found the anthropogenic risk clustering districts – 27 of 29 lower CPRB districts need to prove the relationship between urban socio-economics, flood frequency, and impacts. This analysis uses the urban socio-economic predictive value and flood frequency to test the affected households, economic losses, and flood impacts (economic losses multiply with affected households). The result shows that the urban socio-economic significantly affects the level of economic losses and the total flood impact shown in Table 6.
Table 6. Relations between urban socio-economic, flood frequency, and flood impacts
|
Dependent Variables |
Coefficient |
R2 |
Model Significant |
Standard Error of Estimation |
||
|
Constant |
Urban Socio-Economic |
Flood Frequency |
||||
|
Level of Economic Losses |
1.363 |
0.518* |
0.109** |
0.187 |
0.000* |
1.0326 |
|
Number of Affected Households |
0.075 |
0.023* |
0.003** |
0.050 |
0.047* |
0.0987 |
|
Level of Total Flood Impacts |
-0.263 |
0.794* |
0.255* |
0.168 |
0.000* |
1.5757 |
*P-Value is less than 0.05
** P-Value is more than 0.05
Source: Analysis by SPSS based on data from DOPA, NSO, DDPM, and LDD
As a result, the research found that the urban socio-economic significantly impacts the economic losses. The result shows that when the urban socio-economic increases by 1 point, the economy will be lost by 52 percent if flood frequency is unchanged. Affected households are only 5 percent of the total district, or about six districts affected by the urban flood. The result means that when urban socio-economic increased by 1 point, the average number of affected households was 2,300. The flood impact is the cross between economic losses and affected households. Urban socio-economic and flood frequency can significantly increase flood impact. That means when the urban socio-economic increases by 1 point, the flood impacts will be 80 percent increased. When the flood is more frequent at 1 level, the flood impact can increase by 25.5 percent. This result can affirm the influence of urban socio-economic and flood frequency to the increasing economic losses, affected households, and total flood impact. The economic losses are influenced by the urban socio-economic increase of 18.7 percent, while it has a minor influence on affected households. The total flood impacts can be influenced by urban socio-economic that synergized with flood frequency at 16.8 percent. In conclusion, it can imply that urban socio-economic causes higher impacts when it synergizes with other flood factors, such as water draining, runoff, and rainfall.
Based on the objective, this research found three main points of focus. First, the urban factors and trends point to the flood risk and impacts. Second, flood location and influence on urban socio-economic is statistically proven. Third, the offering of strategic flood resilience frameworks that cover social and economic adaptive capacity building.
5.1 Urban socio-economic factors and trends in the CPRB
In this research, the first objective focuses on the urban socio-economic trend. In this analysis, the research gathers seventeen theoretical factors from the multi-dimensional viewpoint. The operation of PCA assists in reducing the factors into three factors: municipal population, commercial value, and water consumption.
The finding is related to urban growth, expansion, and sprawling in the CPRB, especially the BMR. This research used the municipal population to replace the total population and population density because it can represent the growth of urban boundaries. The municipality can be defined as the urban boundary in one administrative district, while the rural is a Sub-district Administrative Organization (SAOs). This indicator is different urban studies work in Thailand like Friend et al. [8] and Koonthanakulwong et al. [35] that uses population density as the population indicator. Population density is found to be significantly relative to urbanization. The advantage of population density is to find the high population per area. However, Thailand's district boundaries have different scales and include rural–agricultural areas. This statement means an urban density uncertainty indicating the CPRB population.
Municipal population growth in the CPRB increased during 2002 – 2017. The increase is more than fifty percent in upper and middle CPRB while only 15 percent in lower CPRB. The reason is that lower CPRB, especially the BMR, has been urbanized since the 1960s. On the contrary, the urban areas in upper and middle CPRB have rapidly increased after the economic crisis of 1997 because of the decentralization and tourism [7].
In the economic dimension, commercial value and water consumption indicate local and regional economic growth. As mentioned, the report of Koonthamdee [7] is about the increasing necessity of tourism and service sector after the economic crisis of 1997. The data was confirmed by Zachau [44] from the world bank on the importance of the service sector in Thailand. This research can confirm the influence of commercial activities proxied by their value in each district, which can cause urban expansion. Another economic indicator is water consumption that refers to resource usage. This indicator has been offered by Koonthanakulwong et al. [35], who studied the SSPs and climate change impact in Thailand. Instead of water consumption, electricity, and energy consumption were also considered. However, electricity cannot be the universal representation of resource consumption because it also depends on the district's function, such as the central business district, factory district, and government building district. Hence, the water consumption is appropriate to represent the resource use in the urban district.
Based on the ground theory, these three indicators are testified in their linear relationship. The research selected based on the report of ADB and NUS [45] strongly recommended that population and commercial activity determine the water consumption in Southeast Asia. This research found that this concept is implementable in the CPRB. The research found a significant linear relationship between municipal population and commercial value to predict the level of water consumption.
The result is not only the water consumption level but also the pattern of the urban expansion in the entire basin. The research found that the highly urbanizing district is at the edge of the BMR in the lower CPRB, Muang Phitsanulok in the middle CPRB, and Muang Chiang Mai Metropolitan in the upper CPRB. The most significant expansion is the BMR, which finds the shift of high urban socio-economic from inner Bangkok to the edge of Bangkok districts. This shift is called “Peri-urbanization”, which is caused by the housing price [47], and it diverges the local infrastructure, sewage, and draining system between the new real estate and the traditional town in the peri-urban district [35]. Ultimately, this urban expansion leads to the urban flood risk and impacts influenced by urban socio-economic growth.
5.2 Influence of urban socio-economics on risk location and urban flood impacts
The CPRB is globally recognized as a high flood-risk basin and is highly vulnerable to climate change impact [49]. At the same time, urbanization and economic development are still major country-driven, especially in the BMR-the country center. Climate change impact and social and economic development can synergize, leading to a higher impact on local communities and businesses.
This discussion categorizes the anthropogenic risk districts and describes flood impacts.
Categorizing the anthropogenic risk is an operation of K-Means Clustering. The methodology is cross-sectional between urban socio-economic, flood frequency, affected households, and economic losses. The analysis results in two categories of risks: anthropogenic and natural flood risks.
The anthropogenic risk is found in the BMR in the lower CPRB and Muang Chiang Mai Metropolitan in the upper CPRB. Focusing on the BMR, the urban flood risk extends from the findings of Marome [48], Limthongsakul et al. [34], and Singkran [32]. Their findings locate the northwestern, northern, and northeastern BMR. However, the evidence from the analysis includes the western and southwestern of the BMR. Figure 10c is the coverage risk districts in the ring pattern, called the “Urban Flood Risk Ring of BMR". The relative to urban socio-economic is evidenced by Figure 9c, which shows the high urban districts surrounding Bangkok. Hence, the high urban socio-economic and flood-risk districts are visionally correlated based on the spatial images.
Another flood risk category is found in all three sub-basins. It is the natural flood risk category, which is river and wetland-rated areas. Most natural risk districts are in the middle CPRB (Figure 10b), Yom and Nan river-related flood patterns. The risk is connected to upper CPRB by the Yom River in Sukhothai’s swamp areas (southern of upper CPRB). This pattern is according to Jumrassi and Toda [6], which specified the middle CPRB as the critical natural flood control location. The risk districts in the lower CPRB are found in the wetland and floodplain areas near the BMR, such as Rangsit floodplain areas on the eastern side and Bang Plama and Bang Len on the western side. Len in Bang Len means sludge, which refers to the character of a wetland. Additionally, although this risk depends on the natural flooding, some high urban level districts can be into the anthropogenic risk.
This research focuses on Anthropogenic risk, which is found highly around the BMR peri-urban areas. It is necessary to focus on urban flood impact on the local households, economic losses, and the total impacts.
The relationship between urban socio-economic factors and flood impacts must be clarified. This risk location, including the entire sub-basin, needs to assess the impactees for prioritizing the adaptive measures in the specific risk districts. Based on the result of urban socio-economic analysis, there are two types of impactess: households and local businesses.
This research examined the linear relationship between urban socio-economic and level of economic losses, number of affected households, and level of total impacts. Flood frequency is a composited variable. The results found that the urban socio-economic can increase economic losses and the number of affected households although food frequency increases or decreases. The total flood impacts are also increased by urban socio-economic and flood frequency. Although urban socio-economic influences increase urban flood impact, they must combine with other factors, such as rainfall, water runoff, and draining capacity. Thus, urban socio-economics has influenced highly on urban flood risk in the BMR peri-urban areas. However, its influences are also combined with other factors to increase the flood impacts. Therefore, it is essential as an indicator to provide information on the urban flood risk to the communities and businesses.
5.3 Strategic urban flood resilience framework
The summary can direct the development of an urban flood resilience framework composed of adaptive capacity measures. The gaps in resilience have been addressed in the adaptation and mitigation emphasize structural building [34]. It lacks an integration of social adaptation that can link to the long-term environmental problem [33, 49]. This research can specify the urban socio-economic risk factors leading to adaptive capacity building in the BMR peri-urbanization.
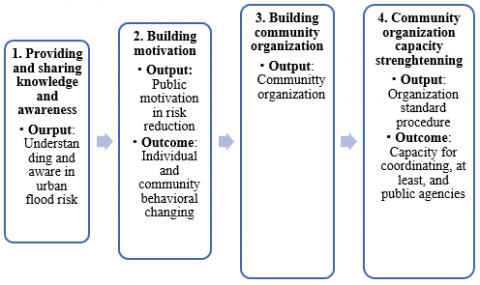
Social adaptive capacity-building measures should resolve the social risk. The recommendations of Pronk et al. [39], Chao-Amonphat et al. [33], and Limthongsakul et al. [34] can bring to design in the "Logical Framework," as Figure 11.
Figure 11. The social adaptive capacity building to respond to the risk of household in the peri-urban districts
Source: [ 33, 34, 39]
Figure 11 provides the logical framework of social adaptive capacity building for the community in the peri-urban areas. It should start by providing knowledge and awareness to people for understanding and awareness of urban flooding risk in their location. In the second step, the people in the community should be motivated to reduce the urban flood risk at the individual, household, and community levels. These two steps will lead to individual and community behavioral changes to reduce the risk. When a community is motivated, it should be building the community organization. The organization's capacity is strengthened to build the standard procedure that leads to the capacity to coordinate with public agencies to reduce the urban flood risk.
The economic adaptive capacity strengthening needs to concern the financial capacity measures. As Kato and Charoenrat [40], the creation of a Business Continuity Plan (BCP) is necessary for MSMEs in the local community. Furthermore, Hallegatte [41] recommends household stability of income and savings. This financial capacity includes household insurance and loans for urban flood preparedness, prevention, and recovery. Based on these recommendations, the responding measure on economic risk to the local commercial is to develop the financial and funding mechanism for supporting the local household, community, and MSMEs. The MSMEs should be assisted in creating the BCP that may be the collective BCP based on the setting, such as community, market, and a group of businesses. The financial source for this funding should be compensated by the new real estate and higher-income communities, which take advantage of the better infrastructure in the peri-urban areas [34]. The local tax for the funding is required in this measure.
Therefore, this research can conclude that urban socio-economic plays a significant role in increasing the urban flood risk and impact. The emphasized location is in lower CPRB, the BMR's peri-urban district. The urban flood risk can cause affected households and economic losses that need social and economic adaptation. The research recommends regional governance and policy that should build the social adaptive capacity in the local communities for dealing with public agencies. The economic adaptation should focus on creating the BCP and the financial funding mechanism to support preparedness, prevention, and recovery.
This research highlights the urban socio-economic role and influences on urban flood risk and impact. The holistic urban socio-economic indicators include municipal population, population density, commercial activity, and water consumption. These indicators signal the role of enhancing anthropogenic factors and flood impacts. The anthropogenic-related risk is significantly found in peri-urban districts, which can increase 2,300 affected households, economic losses at 52 percent, and flood impacts at 80 percent. This result refers to the requirement of social and economic adaptive capacity building in the traditional towns and lower-income communities because they are disadvantaged in infrastructure. Hence, these communities need social adaptive capacity-building interventions in the policy and planning facet. The financial and funding mechanism is also required to support preparedness, prevention, and recovery through, for example, tax earnings and financial compensation from new real estate and higher-income communities.
The realization fulfills the knowledge and analytical gap in utilizing the socio-economic – municipal population, commercial value, water consumption, flood frequency, affected household, and economic losses - as flood risk indicators. This research has spent an effort to use the existing government data to build the set of urban and risk indexes for monitoring and evaluation. This closing gap is necessary for urban and regional policy implication that the multi-level public agencies can see the risk through the data sharing process. Furthermore, these indexes can be used as the input for the social and economic adaptive capacity planning and intervention design including through the “Logical Framework”. In the development case, dataset for the indexes is in the data-sharing platform, and it would be suitable for policy and planning development, implementation, monitoring, and evaluation.
In addition, the research can utilize the urban socio-economic attribution to standardize the government data as the urban socio-economic indicators. They can indicate the level of the urban districts necessary for urban and regional planning. This is a basis to indicate urban horizontal growth and expansion, flood risk districts, and impacts. Nonetheless, the utilized data depends on the administrative boundaries that some of them would be unable to specify local communities, but it is an advantage for government planning and budgeting. In the future, some recommended factors may be added as indicators and the development of social and economic adaptive capacity-building mechanisms such as Participatory Action Research. The combination effect among urban socio-economic and flood hazard factors - draining capacity, runoff, and rainfall- needs further investigation.
This work is under the Royal Thai Government (RTG) Fellowship to support Thanakom Wongboontham's Ph.D. fellowship at the Asian Institute of Technology (AIT). Furthermore, this research is partly funded by the Thailand and China cooperation program between the National Research Council of Thailand (NRCT) and the National Natural Science Foundation of China (NFSC).
[1] U.N. Department of Economic and Social Affairs. (2021). UN Sustainable Development Goals 11th. Récupéré sur United Nations. https://sdgs.un.org/goals/.
[2] Stark, T. (2006). Early mainland Southeast Asian landscapes in the first millennium a.d. Annual Review of Anthropology, 35: 407-432. http://doi.org/10.1146/annurev.anthro.35.081705.123157
[3] Jessen, O.Z., Cross, K. (2016). Pilot basins in flood and drought management tools project: Chao phraya basin. Development of Tools to Incorporate Impacts Climatic Variability and Change Floods and Droughts into Basin Planning Processes. https://fdmt.iwlearn.org/about/pilot-basins.
[4] NESDC. (2020). Gross Regional and Provincial Product Chain Volume Measures 2020 Edition. Bangkok, Thailand: National Economic and Social Development Council.
[5] JICA. (2013). The Project for Flood Countermeasures for Thailand Agricultural Sector. Tokyo, Japan: Japan International Cooperation Agency.
[6] Jamrussri, S., Toda, Y. (2018). Available flood evacuation time for high-risk areas in the middle reach of chao phraya river basin. Water, 10(12): 1871. https://doi.org/10.3390/w10121871
[7] Koonnathamdee, P. (2013). A Turning Point for the Service Sector in Thailand. Manila, The Philippines: Asian Development Bank.
[8] Friend, R., Choosuk, C., Hutanuwatr, K., Inmuong, Y., Kittitornkool, J., Lambregts, B., Promphakping, B., Roachanakanan, T., Theingburanathum, P., Thinphanga, P., Siriwattanaphaiboon, S. (2016). Urbanising Thailand: Implications for climate vulnerability assessment. International Institute for Environment and Development Rockefeller Foundation, the Asian Cities Climate Change Resilience Network Thailand Environment Institute. http://doi.org/10.13140/RG.2.2.17931.49444
[9] Garschagen, M., Romero-Lankao, P. (2015). Exploring the relationships between urbanization trends and climate change vulnerability. Climatic Change, 133(1): 37-52. https://doi.org/10.1007/s10584-013-0812-6
[10] Kuddus, M.A., Tynan, E., McBryde, E. (2020). Urbanization: A problem for the rich and poor. Public Health Reviews, 4(1). https://doi.org/10.1186/s40985-019-0116-0
[11] Ligaray, M., Kim, H., Sthiannopkao, S., Lee, S., Cho, K.H., Kim, J.H. (2015). Assessment of hydrologic response by climate change in the chao phraya river basin, Thailand. Water, 7(12): 6892-6909, https://doi.org/10.3390/w7126665
[12] WHO. (2022). Review of indicators framework supporting urban planning for resilience and health. Copenhagen: WHO Regional Office for Europe.
[13] Melkunaite, L. (2016). Improved risk evaluation and implementation of resilience concepts to critical infrastructure. European Union's Horizon 2020 and Innovation Program.
[14] United Nations, Asian Development Bank, and United Nations Development Program. (2018). Transformation towards sustainable and resilient societies in Asia and the Pacific. Bangkok, Thailand: United Nations Economic and Social Commission for Asia and the Pacific.
[15] Walker, B., Gunderson, L., Kinzig, A., Folke, C., Carpenter, S., Schultz, L. (2006). A handful of heuristics and some propositions for understanding resilience in social-ecological systems. Ecology and Society, 11(1): 13. https://doi.org/10.5751/ES-01530-110113
[16] Sustainable Scale Project. (2019). Panarchy. Sustainable Scale. http://www.sustainablescale.org/ConceptualFramework/UnderstandingScale/MeasuringScale/Panarchy.aspx.
[17] Pickett, S.T.A., Cadenasso, M., Grove, M., Nilon, C., Pouyat, R., Zipperer, W.C., Costanza, R. (2001). Urban ecological system systems: Linking terrestrial ecological, physical, and socio-economic components of metropolitan areas. Annual Review of Ecology and Systematics, 32(1): 127-157. http://doi.org/10.1146/annurev.ecolsys.32.081501.114012
[18] Endlicher, M., Endlicher, W. (2007). Urban ecology - definition and concepts. In M. Langner, Shrinking Cities: Effects on Urban Ecology and Challenges for Urban Development. p. 161. Bern, Switzerland: Peter Lang. https://doi.org/10.3726/978-3-653-04004-3
[19] Keys, P.W., Galaz, V., Dyer, M., Matthews, N., Folke, C., Nyström, M., Cornell, E.S. (2019). Anthropocene risk. Nature Sustainability, 2: 667-673. https://doi.org/10.1038/s41893-019-0327-x
[20] Homer-Dixon, T., Walker, B., Biggs, R., Crepin, A., Floke, C., Lambin, F.E., Peterson, D.G., Rockstrom, J., Sheffer, M., Steffen, W., Troell, M. (2015). Synchronous failure: The emerging causal architecture of global crisis. Ecology and Society, 20(3): 6. https://doi.org/10.5751/ES-07681-200306
[21] Marin, M., Modica, M. (2017). Socio-economic exposure to natural disasters. Environmental Impact Assessment Review, 64: 57-66. http://doi.org/10.1016/j.eiar.2017.03.002
[22] Marin, G., Modica, M., Paleari, S., Zoboli, R. (2021). Assessing disaster risk by integrating natural and socio-economic dimensions: A decision-support tool. Socio-Economic Planning Sciences, 77: 101032. https://doi.org/10.1016/j.seps.2021.101032
[23] Xie, Y., Liu, C., Chang, S., Jiang, B. (2022). Urban Sustainability: Integrating Socio-economic and Environmental Data for Multi-Objective Assessment. Sustainability 14 (15): 9142. https://doi.org/10.3390/su14159142.
[24] Xu, L., Cui, S., Wang, X., Tang, J., Nitivatananon, V., Ding, S., Nguyen, M.N. (2021). Dynamic risk of coastal flood and driving factors: Integrating local sea level rise and spatially explicit urban growth. Journal of Cleaner Production, 321: 129039. https://doi.org/10.1016/j.jclepro.2021.129039
[25] Hu, Q., He, X. (2018). An integrated approach to evaluate urban adaptive capacity to climate change. Sustainability, 10(4): 1272. https://doi.org/10.3390/su10041272
[26] Wanliphodom, S. (2016). The society in chao phraya river basin; Development and transformation. Lek-Praoai Foundation. https://lek-prapai.org/home/view.php?id=808.
[27] Shakti, P.C., Miyamoto, M., Misumi, R., Nakamura, Y., Sriariyawat, A., Visessri, S., Kakinuma, D. (2020). Assessing flood risk of the chao phraya river basin based on statistical rainfall analysis. Journal of Disaster Research, 15(7): 1025-1039. https://doi.org/10.20965/jdr.2020.p1025
[28] Komori, D., Nakamura, S., Kiguchi, M., Nishijima, A., Yamazaki, D., Suzuki, S., Kawasaki, A., Oki, K., Oki, T. (2012). Characteristics of the 2011 chao phraya river flood in central Thailand. Hydrological Research Letters, 6: 41-46. https://doi.org/10.3178/hrl.6.41
[29] Kure, S., Tebakari, T. (2012). Hydrological impact of regional climate change in the chao phraya river basin, Thailand. Hydrological Research Letters, 6: 53-58. http:// doi.org/10.3178/hrl.6.53
[30] Pumchawsaun, P. (2018). Integrated hydrodynamic and socio-economic damage modelling for assessment of flood risk in large-scale basin: The case study of lower chao phraya river basin in Thailand. Stockholm, Sweden: Department of Physical Geography, Stockholm University.
[31] Singkran, N. (2021). Spatiotemporal flood risk determination and management for a large river basin. Applied Environmental Research, 43(3): 92-106. https://doi.org/10.35762/AER.2021.43.3.7
[32] Losiri, C., Nagai, M., Ninsawat, S., Shrestha, R.P. (2016). Modeling urban expansion in bangkok metropolitan region using demographic–economic data through cellular automata-markov chain and multi-layer perceptron-markov chain models. Sustainability, 8(7): 686. https://doi.org/10.3390/su8070686
[33] Chao-Amonphat, S., Nitivatananon, V., Srinonil, S. (2022). Adaptation measures on hydrological risks and climate change impacts in urbanized sub-region, Thailand: A case study in lower chao phraya river basin. International Journal of Disaster Resilience in the Built Environment. https://doi.org/10.1108/IJDRBE-08-2021-0113
[34] Limthongsakul, S., Nitivatananon, V., Arifwidodo, S.D. (2017). Localized flooding and autonomous adaptation in peri-urban bangkok. Environment and Urbanization, 29(1): 51-68. https://doi.org/10.1177/0956247816683854
[35] Koonthanakulwong, S., Suttinon, P., Ruangrassamee, P., Suthidhummajit. C., Hemsatien, W. (2017). Climate change impact and vulnerability assessment in selected sectors (in Thai). Bangkok, Thailand. Faculty of Engineer, Chulalongkorn University. http://project-wre.eng.chula.ac.th/watercu_eng/sites/default/files/publication/va_final/Va-Final%20and%20Appendix.pdf.
[36] O’Neill, B.C., Kriegler, E., Ebi, K.L., Kemp-Benedict, E., Riahi, K., Rothman, D., van Ruijven, B., van Vuuren, D.P., Birkmann, J., Kok, K., Levy, M., Solecki, W. (2015). The roads ahead: Narratives for shared socio-economic pathways describing world futures in the 21st century. Global Environmental Change, 42: 169-180. https://doi.org/10.1016/j.gloenvcha.2015.01.004
[37] Malakar, K., Mishra, T. (2016). Assessing socio-economic vulnerability to climate change: A city-level index-based approach. Climate and Development, 9(4): 1-14. https://doi.org/10.1080/17565529.2016.1154449
[38] Katic, K. (2017). Social vulnerability assessment tools for climate change and DRR programming. Beograd, Serbia: United Nations Development Programme.
[39] Pronk, R. (2015). Citizen participation and social capacity building for a flood resilient rotterdam; A multiple case study on noordereiland and kop van feijenoord. Groningen, the Netherlands: Faculty of Spatial Science, University of Groningen.
[40] Kato, M., Charoenrat, T. (2018). Business continuity management of small and medium-sized enterprises: Evidence from Thailand. International Journal of Disaster Risk Reduction, 27: 577-587. https://doi.org/10.1016/j.ijdrr.2017.10.002
[41] Hallegatte, S. (2014). Economic resilience: Definition and measurement. Policy Research Working Paper 6852. Washington D.C.: The World Bank.
[42] Hausfather, Z. (2018). How 'shared socio-economic pathways' explore future climate change. Carbon Brief Clear on Climate. https://www.carbonbrief.org/explainer-how-shared-socioeconomic-pathways-explore-future-climate-change/.
[43] MRC Cognition and Brain Sciences Unit. (2009). What thresholds should i use for factor loading cut-offs? MRC CBU Wiki. https://imaging.mrc-cbu.cam.ac.uk/statswiki/FAQ/thresholds.
[44] Zachau, U. (2016). Services as a new driver of growth for Thailand. Récupéré sur East Asia & Pacific on the Rise。 https://blogs.worldbank.org/eastasiapacific/services-as-a-new-driver-of-growth-for-thailand.
[45] ADB and NUS. (2012). Promising practices in urban water management decoding good practices for a successful future. The Philippines: Asian Development Bank.
[46] Mousi, P., Bhuvaneswari, V. (2021). Urban water consumption and its influencing factor identification using water decision support system. In IOP Conference Series: Earth and Environmental Science, Volume 822, International Conference on Contemporary and Sustainable Infrastructure, 21-22 May 2021, Bangalore, India, 822: 012050. https://doi.org/10.1088/1755-1315/822/1/012050
[47] Padon, A., Iamtrakul, P., Thanapirom, C. (2021). The study of urbanization effect on the land use changes and urban infrastructures development in the metropolitan areas, Thailand. IOP Conference Series: Earth and Environmental Science, Volume 738, The 20th Sustainable, Environment and Architecture 10 November 2020, Indonesia. 738: 012077. https://doi.org/10.1088/1755-1315/738/1/012077
[48] Marome, W. (2016). Enhancing Adaptation to climate change by impact assessment of the flood in bangkok. Journal of Architectural/Planning Research and Studies, 13(2): 31-40. https://doi.org/10.56261/jars.v13i2.81266
[49] Pal, I., Arboleda, J.L., Nitivatananon, V., Benjachat, N. (2022). Assessment and appraisal of local governance on urban flood resilience in bangkok metropolitan region: Perspectives of SDGs 11 and 13. International Journal of Disaster Resilience in the Built Environment, 13(3): 404-417. https://doi.org/10.1108/IJDRBE-08-2021-0108