Supattra Puttinaovarat*![]() | Jinda Kongcharoen
| Jinda Kongcharoen![]() | Siwipa Pruitikanee
| Siwipa Pruitikanee![]() | Aekarat Saeliw
| Aekarat Saeliw![]()
© 2023 IIETA. This article is published by IIETA and is licensed under the CC BY 4.0 license (http://creativecommons.org/licenses/by/4.0/).
OPEN ACCESS
In the current global context of climate change, the frequency and intensity of disasters, including landslides, are on the rise. During the initial three quarters of 2023, a notable incidence of fatalities resulting from landslides was observed across several nations, with specific instances including India reporting 26 casualties, South Korea documenting 43 fatalities, and Burma recording 31 lives lost, among others. Moreover, there has been significant damage to critical infrastructure, encompassing various forms of infrastructure, such as transportation networks and buildings. To address this challenge, researchers have turned to Geographic Information Systems (GIS) for studying and analyzing landslide risks. However, they face a limitation: the analysis results mainly consist of static maps, lacking a real-time digital platform for efficient data management and dynamic display of landslide information. This limitation hampers effective monitoring and surveillance efforts. To overcome this limitation, the present study introduces an innovative approach that integrates GIS with the development of a digital platform, effectively addressing the existing challenges. This integrated solution not only enables accurate landslide risk analysis with an impressive accuracy rate of 83.50% but also provides users with the ability to access information about specific landslide sites within a defined radius, regardless of their geographical location. Unlike previous studies, this research demonstrates the potential to address past methodological limitations by utilizing a real-time data platform. Accuracy varies based on geographic context, and landslide occurrences are influenced by diverse factors in different terrains. The digital platform elucidated in this study holds applicability for utilization by disaster prevention and relief organizations, as well as government agencies.
landslide risk analysis, spatial data, disaster management, GIS application, digital platform
Climate change is rapidly altering our planet, leading to an alarming increase in the occurrence and severity of various disasters [1-4]. One of the most concerning consequences is the escalating frequency and intensity of landslides, which inflict significant damage on lives and properties worldwide [5-9]. In Thailand, over the past decade, heavy rains have become more frequent, resulting in devastating landslides. These destructive events involve the forceful descent of rocks, soil, and debris from higher elevations, causing severe damage to house, buildings, and public infrastructure, such as roads and bridges [10-12]. As a result, local communities endure immense suffering and bear the brunt of the aftermath [10-12]. Each landslide leads to human casualties, destroys homes and structures under the weight of debris, and devastates agricultural crops. Furthermore, the psychological impact on the affected individuals cannot be overlooked. The psychological consequences of landslides exhibit varying durations, ranging from short-term to long-term, contingent upon the scale and intensity of the impact, notably its influence on property. Recovery of mental well-being tends to occur relatively swiftly once the situation is addressed, in contrast to the prolonged recovery periods associated with physical health issues or loss of life. Consequently, the presence of a digital platform capable of offering supplementary information equips government agencies to enhance their problem-solving efficiency [13-15]. Currently, the monitoring and surveillance of landslides in Thailand rely on data provided by the Department of Mineral Resources. These data are typically presented in the form of static maps, illustrating the level of landslide risk in different areas [16-18]. While these maps serve the purpose of monitoring susceptible regions, they suffer from limitations. They lack real-time data analysis and presentation capabilities, and there is a lack of applications to promptly notify individuals of landslide-prone areas. This deficiency hinders the utilization of such information as input data for enhancing the accuracy of risk analysis models.
The analysis of landslide risk serves a critical function in proactive monitoring and early warning systems designed to mitigate the impact of landslides. In the absence of such analysis or in the event of inaccuracies within the analysis results, individuals and communities may find themselves ill-prepared to respond to unfolding situations. For instance, in the southernmost region of Thailand, a dearth of timely landslide information has led to fatalities, tens of thousands of missing and affected individuals, hundreds of damaged homes, and nearly a hundred compromised roadways. Implementation of landslide occurrence analysis coupled with a digital platform for public information dissemination has the potential to significantly reduce or alleviate the distress and losses incurred in such situations.
A thorough examination of existing literature and relevant research on landslide risk analysis utilizing Geographic Information System (GIS) reveals that various factors influencing landslides have been considered in the analysis [19-25]. These factors encompass rainfall, slope, aspect, curvature, soil composition, Land Use and Land Cover (LULC), distance from drainage systems, lithology, and proximity to roads, among others. Researchers have employed diverse methods and techniques, including statistical techniques and machine learning algorithms like Frequency Ratio (FR), Weights of Evidence (WOF), Analytical Hierarchy Process (AHP), Weight Linear Combination (WLC), Fuzzy logic, Random Forest (RF), and Artificial Neural Network (ANN) [19-25]. The analysis results have been presented through risk maps, illustrating the level of landslide risk. Remarkably, previous research highlights the high accuracy of these analysis results, facilitating effective landslide monitoring in specific study areas. However, there are limitations to the current methods and research. One limitation is the static nature of data analysis and presentation, which makes information accessibility challenging. Additionally, visually interpreting static maps makes it difficult to determine the proximity of risk areas to residential locations. To overcome these limitations, this research proposes a novel approach: integrating GIS, Global Positioning System (GPS), and Remote Sensing (RS). Furthermore, a digital platform will be developed to notify and display landslide data in each area, providing real-time data presentation. This integrated solution aims to address existing limitations, facilitating efficient landslide monitoring, and enabling comprehensive situational awareness for effective management across all sectors.
A comprehensive examination of literature and research on landslide risk analysis has revealed the integration of GIS and RS alongside various statistical and machine learning techniques. A comparative study was conducted, focusing on three specific techniques: Fuzzy multi-criteria decision making (FMCDM), Naïve Bayes (NB), and Random Forest (RF). Spatial data, including slope, aspect, elevation, curvature (plan, profile, and sediment transport index), rainfall, annual solar radiation, stream power index, topographic wetness index, distance from rivers, lithology, distance from faults, Land Use and Land Cover (LULC), and distance from roads, were utilized for the analysis. The findings were presented through risk level maps, classifying the levels as very low, low, moderate, high, and very high. The accuracy assessment demonstrated that the RF analysis exhibited the highest level of accuracy, achieving an impressive 92.20% [19].
A comparative analysis of landslide risk was conducted using three models: information method (IM), Frequency Ratio (FR), and Artificial Neural Network (ANN). The analysis utilized data consisting of 11 factors, including elevation, slope, aspect, plan curvature, profile curvature, road distance, river distance, fault distance, stream rock property, vegetation coverage index, and terrain humidity index. The results of the analysis were classified into five categories: very low, low, moderate, high, and very high-risk levels. The findings revealed that the ANN model achieved the highest level of accuracy, with an Area Under the Curve (AUC) value of 0.907 [20].
A comparative analysis was conducted to assess landslide risk using three techniques: Artificial Neural Network (ANN), Fuzzy-Analytical Hierarchy Process (Fuzzy-AHP), and Multi-Criteria Decision Analysis (MCDA). The analysis incorporated ten factors, including slope, aspect, profile curvature, drainage density, lineament density, geomorphology, soil texture, Land Use and Land Cover (LULC), lithology, and rainfall. The analysis results were presented through risk level maps, classifying the risk into five categories: very low, low, moderate, high, and very high. The accuracy assessment revealed that the ANN technique produced the most accurate results, with an AUC (Area Under the Curve) value of 88.10%. The Fuzzy-AHP and AHP techniques achieved AUC values of 86.10% and 85.40% respectively [22].
Recent research studies have explored the integration of GIS and machine learning techniques to analyze landslide risk. Statistical analysis methods, combined with GIS, have been employed to assess the risk levels of landslides. Two bivariate statistical models, namely evidential belief functions (EBF) and weight of evidence (WOE), were proposed for this purpose. The analysis incorporated 11 spatial data variables, including elevation, slope, aspect, lithology, rainfall, NDVI, land use and land cover (LULC), plan curvature, profile curvature, distance from faults, and distance from networks. The results indicated that the WOE model outperformed, achieving an impressive Area Under the Receiver Operating Characteristic (AUROC) of 89.95% and a predictive rate of 86.50% [24]. The risk levels were categorized into five classes: very low, low, moderate, high, and very high. Furthermore, another study conducted a comparative analysis of landslide risk using two techniques: Frequency Ratio (FR) and weight of evidence (WOE) based on seven data variables: aspect, slope, curvature, lithology, LULC, rainfall, and distance from streams. The analysis produced a risk level map with five distinct classes. Evaluation of the analysis efficiency indicated that FR was more effective, with the WOE model achieving a predictive rate of 84.60% and a success rate of 86.50%, while the FR model exhibited a higher predictive rate of 88.20% and a success rate of 89.80% [23].
This study focuses on analyzing and mapping landslide risk areas by employing GIS, RS, and the Frequency Ratio (FR) technique. Various factors were considered in the analysis, including rainfall, earthquake magnitude, slope angle, altitude, distance from drainage, topographic wetness index (TWI), stream power index (SPI), distance from road, land use and land cover (LULC), and normalized difference vegetation index (NDVI). The analysis results were presented through maps that depict five classes of landslide risk levels: very high, high, medium, low, and very low. The assessment of the analysis using Receiver Operating Characteristics (ROC) yielded a value of 87.80% [25].
Furthermore, the study introduced landslide risk analysis utilizing three techniques: Analytical Hierarchy Process (AHP), Weight Linear Combination (WLC), and Spatial Multi-Criteria Evaluation (SMCE). The analysis incorporated ten factors, namely slope, aspect, soil, lithology, normalized difference vegetation index (NDVI), land use and land cover (LULC), distance from drainage, precipitation, distance from faults, and distance from roads. The analysis results were presented as maps depicting four classes of risk susceptibility: low, moderate, high, and very high. Evaluation of the analysis's validity revealed that the most accurate method was SMCE, exhibiting an impressive accuracy rate of 96% [21].
Currently, the analysis of landslide risk relies on the utilization of satellite images, categorized as near real-time or semi real-time data, alongside real-time data sourced from sensors or IoT (Internet of Things) devices. Both data formats possess distinct strengths and limitations. The advantage of employing satellite imagery lies in its capacity to encompass extensive geographical areas. However, it is imperative to acknowledge that its spatial and temporal resolution is comparatively inferior when compared to the precision attainable through the deployment of sensors within individual regions. Conversely, the utilization of sensor-based measurement methods offers the notable advantage of procuring real-time data. Nevertheless, this approach is not without constraints; it may be constrained by budgetary limitations, thereby preventing installation in every conceivable location. Additionally, certain environmental conditions may hinder data collection during specific events or disasters.
Based on a review of relevant literature and research, it is evident that the precision of landslide risk analysis is contingent upon a multitude of factors. These factors encompass the methodologies or models employed in the analysis, the resolution and volume of data utilized, and the selection of factors influencing landslide occurrences specific to each geographic area. Consequently, the outcomes of the analysis exhibit variability in terms of their success and accuracy.
The study and literature review highlighted several strengths and limitations in the current approach to landslide monitoring and analysis. The use of GIS, RS, machine learning, and statistical techniques with spatial data has proven advantageous in generating highly accurate landslide risk maps for effective soil instability monitoring in the study area. However, there are certain limitations that need to be addressed for further improvements. One limitation is the reliance on static maps as the primary means of information presentation, which hinders widespread access and understanding of landslide risk points and areas among the public. Additionally, the lack of a dedicated digital platform to gather real-time information on landslide locations in different areas restricts the ability to incorporate this data into the risk analysis process and refine the accuracy of risk maps. To overcome these limitations, it is crucial to develop a dynamic digital platform that integrates real-time landslide data with the analyzed risk maps, facilitating efficient risk communication and enhancing overall accuracy and effectiveness in landslide monitoring and management.
The research area of this study focuses on Chumphon Province, situated in the upper southern region of Thailand. This region frequently experiences landslides due to the influence of the southwest monsoon and northeast monsoon, resulting in heavy rainfall and flash floods almost every year. Consequently, landslides occur in various areas of the province.
To address this issue, the research presents a comprehensive landslide risk analysis methodology that integrates Geographic Information System (GIS), Global Positioning System (GPS), and Remote Sensing (RS). Spatial data, encompassing factors that contribute to landslide occurrences, are utilized. Additionally, a digital platform is developed to provide real-time notifications and spatial visualization of landslide-prone areas. The methodology consists of seven distinct steps, as depicted in Figure 1, with detailed explanations provided for each step in subsequent sections of the research.
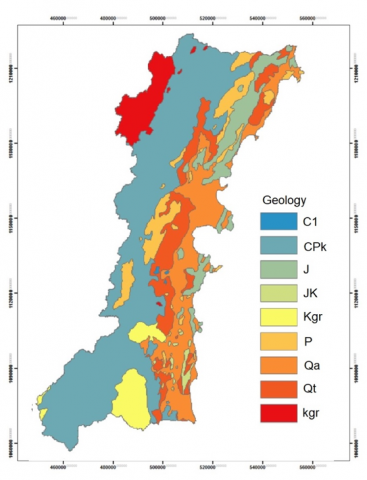
In the context of this research, the criteria employed for categorizing each factor entail a systematic methodological approach. These factors are categorized into discrete levels using two distinct formats: firstly, the utilization of the Natural Breaks classification method is applied when dealing with quantitative data, exemplified by variables such as Rainfall. Secondly, for factors necessitating classification into categorical groups, such as Land Use/Land Cover (LULC), Geology, and Slope, a categorization scheme is employed.
3.1 Data preparation
This step involves the collection of data from relevant agencies, comprising both attribute data and spatial data. The data are obtained from various sources, some stored on the cloud while others are not. The research incorporates multiple datasets, including rainfall, slope, elevation, land use and land cover (LULC), normalized difference vegetation index (NDVI), distance from rivers, soil depth, and rock formation data. Further details and the sources of these datasets are provided in Table 1 for reference.
Table 1. Data and data sources
|
Data |
Input Data Type |
Processing Method |
Data Source |
Resolution/Frequency |
|
Rainfall |
Attribute Data |
Interpolation/Resample |
Thai Meteorological Department |
30 Meter |
|
Slope |
Spatial Data |
Slope Calculation |
GISTDA |
1:4000 |
|
Elevation |
Spatial Data |
- |
GISTDA |
30 Meter |
|
LULC |
Spatial Data |
LULC Classification |
Department of Land Development |
1:4000 |
|
NDVI |
Spatial Data |
NDVI Equation |
USGS |
30 Meter |
|
Distance from rivers |
Spatial Data |
Distance Calculation |
GISTDA |
1:4000 |
|
Soil depth |
Spatial Data |
|
Department of Land Development |
1:4000 |
|
Geology |
Spatial Data |
|
Department of Mineral Resources |
1:4000 |
3.2 Data and image correction
The spatial data used in this research underwent a process of geometric correction to ensure accurate alignment with the correct coordinate system. Additionally, a method of geometric correction involving interpolation or resampling techniques was applied to adjust the resolution of each data type before conducting the comprehensive analysis. This approach aimed to enhance the consistency and reliability of the spatial data, enabling more accurate and meaningful results in the subsequent analysis.
3.3 Data query
Data querying involves the utilization of modified data, which includes retrieving data from cloud storage and storing it in a spatial database for the purpose of conducting landslide risk analysis. Furthermore, this data serves the purpose of managing and displaying spatial data via the developed applications.
3.4 Factor analysis and landslide risk analysis
In this research, the landslide risk analysis utilizes the Analytical Hierarchy Process (AHP) method to prioritize and compare the factors influencing landslide occurrence. The AHP method determines the order of importance for each factor, which is subsequently used in the Weighted Linear Combination (WLC) method for analysis. The analysis involves assigning weights and assessing the significance of each relevant factor. After obtaining the weights or importance values for each factor, the risk is evaluated. Eq. (1) illustrates the equation utilized in the analysis.
$\mathrm{W}_{\mathrm{t}}=\left(\mathrm{M}_1 \mathrm{~W}_1\right)+\left(\mathrm{M}_2 \mathrm{~W}_2\right)+\left(\mathrm{M}_3 \mathrm{~W}_3\right)+\ldots+\left(\mathrm{M}_n \mathrm{~W}_{\mathrm{n}}\right)$ (1)
where, Wt is the level of risk of landslides.
M1, M1, M3, …. Mn is the score of factors 1, 2, 3 … to n.
W1, W2, W3, … Wn is the weight of factors 1, 2, 3 … to n.
Figure 1. Purposed methodology
In this research, the risk analysis of landslides was conducted using eight factors, which are as follows:
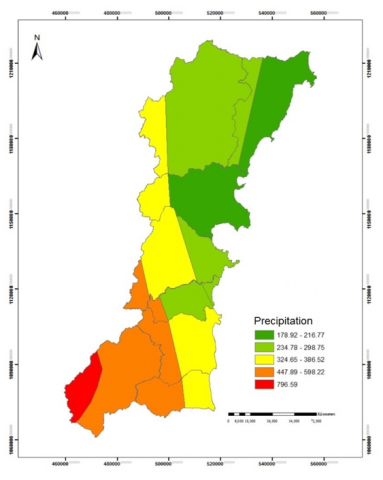
Precipitation is a key contributing factor to landslide occurrences. When rainfall exceeds normal levels, it saturates the soil in the affected region. The increased water content in the soil adds weight and reduces its stability, leading to potential landslides. In this research, rainfall data were collected from eight monitoring stations operated by the Meteorological Department in Chumphon Province. To analyze the spatial distribution of precipitation, the Inverse Distance Weighting (IDW) technique was applied to interpolate the data. The interpolated rainfall data were then categorized into five distinct levels. Figure 2 illustrates the precipitation data and their distribution across the study area.
Figure 2. Precipitation map
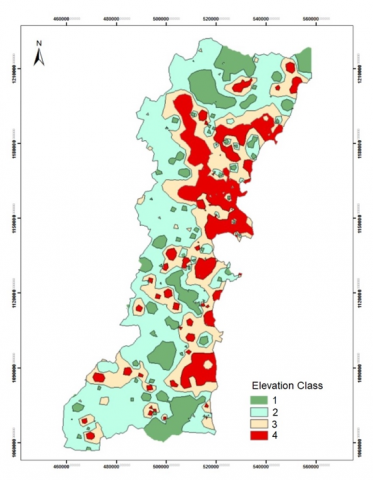
Figure 3. Elevation map
Elevation represents the vertical distance measured relative to the mean sea level. Regions characterized by substantial height variations compared to their neighboring areas during periods of increased rainfall or flash floods are at a heightened risk of experiencing landslides. The elevation map, depicted in Figure 3, provides a visual representation of the stratification of elevation data into four distinct levels in the context of this research.
Slope constitutes a critical factor due to the inherent hazard in regions characterized by steep gradients, as there exists a potential for the displacement of high water-holding soils towards flatter or lower-lying terrain. Moreover, a correlation is expected to manifest between slope characteristics and LULC patterns within the respective area. Figure 4 presents the slope map, which is obtained through the computation of elevation values and subsequent stratification of the data layer into eight distinct levels.
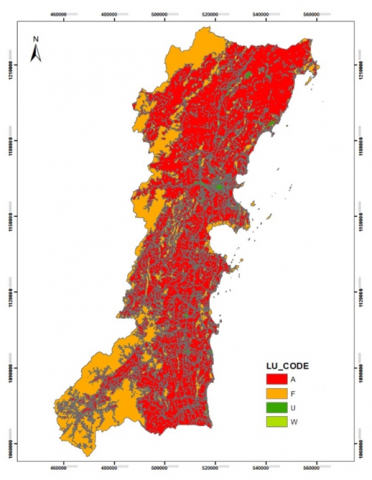
LULC in areas characterized by natural vegetation exhibits a lower susceptibility to landslides due to the presence of enhanced soil cover and a well-developed root system compared to other land types. Conversely, agricultural practices on hillside slopes, as well as deforestation and vegetation removal, have led to rapid alterations in the hydrological flow patterns across the soil. The LULC map, depicted in Figure 5, illustrates the classification of LULC into four distinct classes in this research: Agriculture (A), Forest (F), Urban (U), and Water (W).
Figure 4. Slope
Soil depth plays a significant role in influencing water drainage and subsequently affects landslide dynamics, as different soil types exhibit varying characteristics and drainage capabilities. In this study, it was observed that the research area can be classified into four distinct groups based on soil depth: shallow soil, relatively shallow soil, intermediate soil, and deep soil. An illustration of the soil depth distribution, exemplified by shallow outcrops and deep soils, is presented in Figure 6.
Figure 5. LULC map
Figure 6. Soil depth map
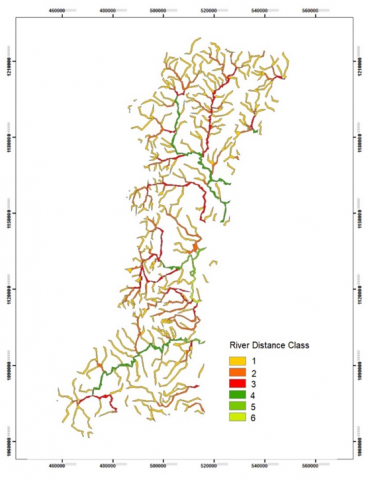
The distance from rivers plays a crucial role in determining the susceptibility of an area to flash floods and landslides. Regions with waterways running through steep slopes are more prone to these hazards compared to areas located farther away from rivers. Figure 7 displays an example of the distance from rivers map, which visualizes the spatial distribution of distances between the study area and nearby river networks.
Figure 7. River distance map
Figure 8. Geology map
Geological formations exhibit distinct characteristics that influence their decay rates, with certain species demonstrating a higher propensity for decay. These variations play a crucial role in shaping landslide occurrences. Figure 8 provides concrete examples of stone characteristics, thereby reinforcing the correlation between geological attributes and landslide susceptibility.
In this research, the risk of landslides was assessed utilizing the Weighted Linear Combination (WLC) technique. The analysis incorporated a scoring criterion derived from the grading of each factor data (Rating), in conjunction with the factor weights obtained from experts using the Analytic Hierarchy Process (AHP) technique. The specific criteria and their details are provided in Table 1. The landslides were classified into three risk classes: low-risk, moderate-risk, and high-risk.
3.5 Accuracy assessment
The evaluation of the accuracy of the landslide risk analysis conducted in this research involved assessing the calculation accuracy. The obtained data were utilized to compare the results with actual landslide occurrences in the research area, sourced from the Department of Mineral Resources.
The evaluation of accuracy was conducted through the computation of pertinent metrics including Accuracy, Precision, Recall, and F-measure values. The corresponding equations for these metrics are detailed in Table 2.
In instances where the outcomes of the analysis are found to be inaccurate, it is imperative to scrutinize the input data specific to the affected region. This examination aims to identify and analyze the underlying factors contributing to the inaccuracies, thereby facilitating the refinement of the model.
Table 2. Accuracy assessment equations
|
Method |
Expression |
Description |
|
Accuracy |
Accuracy = (TP+TN)/(TP+TN+FP+FN) |
TP is True Positive |
|
Precision |
Precision = TP/(TP+FP) |
TN is True Negative |
|
Recall |
Recall = TP/(TP+FN) |
FP is False Positive |
|
F-measure |
F-measure = (2×Precision×Recall)/(Precision+Recall) |
FN is False Negative |
3.6 Data visualization
The utilization of spatial data analysis generates map-based outputs that facilitate the monitoring of landslides within the study area. These maps serve as essential tools for visualizing and tracking landslide occurrences. Moreover, the integration of these maps into a developed digital platform enables the effective dissemination of information to the public.
3.7 Digital platform development
This research involved the development of a digital platform dedicated to the collection and visualization of landslide information within each area. The platform was implemented using PHP and JavaScript programming languages, with the utilization of Leaflet for map display and GPS location retrieval from users' mobile devices. To ensure efficient data management, a MySQL database was employed to store the collected information.
The findings of this study are presented in two main parts: (1) the analysis of landslide risk levels, and (2) the development of a digital platform for the notification and display of landslide information. Through the utilization of spatial data and techniques such as Analytic Hierarchy Process (AHP), Weighted Linear Combination (WLC), and Geographic Information System (GIS), the analysis of landslide risk involved eight factors. The results demonstrated that the proposed methodology can effectively classify landslide risk levels into three categories: low-risk, moderate-risk, and high-risk. Figure 9 illustrates the outcomes of the analysis, indicating that most of the study areas in Chumphon Province are classified as neither at risk nor at low risk of landslides (represented by green pixels on the map). Moderate-risk areas are denoted by yellow pixels. While high-risk areas constitute a smaller proportion of the total area, they are distributed across all districts of Chumphon Province. These analysis results serve as valuable information for stakeholders and local communities, aiding in the monitoring and mitigation of landslides. At the district level, such as in Lamae district (Figure 10), the analysis results indicate that most areas within Lamae district are not at risk of landslides. However, there are two subdistricts identified as high-risk areas: Lamae and Thungkhawat. Within Lamae subdistrict, high-risk villages include Klong Klang, Yuan Sai, Rung Rueang, Klong Song, Ratchadamnoen, Sa Khao, and Sap Thawee. In Thungkhawat subdistrict, high-risk areas encompass Khao Chong Lom, Sai Yai, Hin Luk Chang, Noen Santi, and Thap Mai.
The analysis of landslide risk within the study area yielded findings. Approximately 5% of the total area was identified as being at a high risk of landslides. Medium-risk and low-risk areas constituted 25% and 70% of the study area, respectively. Notably, a significant proportion of the high-risk areas were situated in elevated terrain or near mountainous regions.
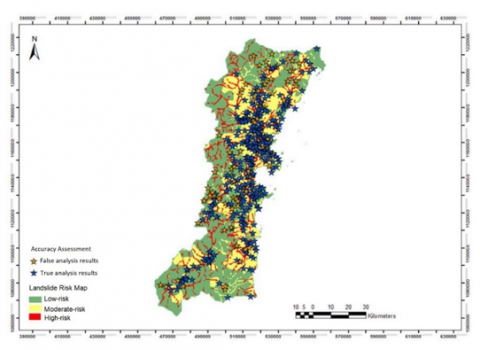
The analysis results were validated by comparing them with the actual landslide data obtained from the Department of Mineral Resources. It was found that the high-risk areas identified by the analysis corresponded to the locations where landslides had occurred. Additionally, the accuracy of the landslide risk analysis was assessed by comparing the analysed data with the landslide data provided by the Department of Mineral Resources, as illustrated in Figure 11. The blue star symbols represent the points where the analysis results were accurate, while the yellow star symbols indicate points where the analysis results were incorrect. The accuracy, recall, precision, and f-measure of the analysis were determined to be 83.50%, 82.00%, 80.50%, and 81.00%, respectively. Accuracy serves as a comprehensive measure of overall correctness, precision quantifies the level of exactness, recall assesses the comprehensiveness of coverage, and the F-measure represents the arithmetic mean of precision and recall values. The accuracy value of 83.50% attained in this analysis indicates a high degree of accuracy, which exhibited a similar level of accuracy.
Regarding the development of a digital platform for receiving and displaying landslide information, the platform incorporates a notification function that identifies the location of the landslide, as depicted in Figure 12. This function retrieves latitude and longitude information from the GPS in the user's mobile device. Other information, such as LULC, situation, province name, district name, and sub-district name, can be entered by the system user. When adding data for a landslide area, the system displays it on an online map in real-time. An example is illustrated in Figure 13, where the red pins represent the locations of landslide occurrences.
Figure 9. Landslide risk map
Figure 10. Landslide risk map in Lamae sub district
Furthermore, the application can present the data of user-notified landslides in the form of a heat map, as shown in Figure 14. The heat map displays a concentration of landslides, indicated by red pixels on the map, while areas with lower to moderate landslide occurrences are represented by blue and green pixels. The heat map visualization enables the assessment of landslide distribution and density within each area. Additionally, the proposed application provides a feature that allows users to check whether their residing area has a history of landslides or is prone to landslides, as demonstrated in Figure 15. In the example, the area within a 1-kilometer radius of the user's location is flagged as at risk of landslides. This functionality supports surveillance and monitoring of landslides in specific areas. The collected data can also be utilized for analysing and enhancing landslide risk maps, leading to more accurate analyses.
Figure 11. Landslide validation map
Figure 12. Landslide data manipulation interface
Figure 13. Landslide data visualization interface
The evaluation of the digital platform's performance yielded notable findings. It was determined that the platform can operate in accordance with the specified requirements, with a noteworthy feature being its capability to process and display real-time data. However, a constraint was identified: users are contingent upon an internet connection for browsing and data preservation. Regarding the accuracy of location coordinates, it hinges upon the efficacy of the GPS device within the user's smartphone. Empirical assessments have ascertained that contemporary smartphone GPS systems offer a level of accuracy sufficient for retrieving information pertaining to landslide locations. This includes the capacity to employ data to verify the user's current location and retrieve data concerning nearby landslide-prone areas.
Figure 14. Heat map
Figure 15. 1-kilometer radius of the user's location and landslide’s location
This study encompasses an in-depth analysis of landslide risk, complemented by the development of a digital platform that leverages GIS, RS, and GPS technologies to facilitate the real-time processing and visualization of data. The integration of these technologies offers the potential to mitigate the constraints encountered in previous research endeavours [19-25].
When comparing the results of this research with previous studies in the field, both similarities and differences were observed. Similarities were found in certain aspects, indicating consistency in the findings. For instance, the use of spatial data factors in landslide risk analysis demonstrated an accuracy of more than 80% in identifying and classifying the risk levels of landslides [19-25]. However, previous studies [19-25] were limited in their practical application due to the reliance on static maps without a digital platform for managing spatial data. Consequently, the information presented in those studies lacked real-time updates and failed to reflect the dynamic nature of landslide risks. In contrast, this research addressed these limitations by integrating landslide risk analysis with the development of a digital platform. This integration enabled the notification and display of landslide-related information in a comprehensive manner. The digital platform provided real-time updates, facilitating effective management and surveillance of landslides. By visualizing and managing the data, the platform enhanced the accuracy and usability of the information for decision-making processes. Overall, the findings of this research not only align with previous studies in terms of the effectiveness of spatial data factors in landslide risk analysis but also contribute significantly by introducing a digital platform that overcomes the limitations of static maps. The integration of analysis and visualization within the platform enhances the applicability and usefulness of the results for comprehensive landslide management.
Considering disparities in research methodologies and their application compared to previous investigations [19-25], this study is distinguished by its integration of landslide data analysis with the development of a digital platform. This platform serves the dual purpose of monitoring landslide occurrences and contributing to mitigation, and restoration efforts in landslide-affected areas. Moreover, it holds the potential to facilitate data management for government agencies, aiding in the planning and management of landslide disasters.
The real-time data tracking system employed in this study does not divulge personal information to the general users. Rather, it exclusively visualized the geographic coordinates of landslide occurrences, facilitating users or the public in monitoring specific risk points. Furthermore, the digital platform developed in this research possesses transferable applicability to other geographic areas due to the programmed coordinate retrieval mechanism. This functionality is achieved through an Application Programming Interface (API), which extracts coordinate values from the GPS module within the user's smartphone and subsequently processes and displays the data utilizing the same methodology.
The findings of this research indicate several advantages for the study area across various domains. The development of a digital platform has conferred the capability for diverse user groups, including citizens, local government entities, and disaster prevention and relief authorities, to engage in real-time monitoring, and reporting of landslide incidents. Furthermore, this platform empowers stakeholders to harness the acquired information for purposes such as strategic planning, budget allocation, and resource procurement aimed at mitigating the ramifications of landslide events. This innovation has effectively ameliorated the limitations of previous methodologies, which necessitated labour-intensive field surveys, resulting in a reduction of both time and budgetary requirements for operational activities.
This research introduces a comprehensive analysis of landslide risk using spatial data and incorporating 8 factors, along with the integration of AHP, WLC, and GIS techniques. Additionally, a digital platform was developed to effectively notify and visualize landslide occurrence locations, enabling the classification of landslide risk into three levels: low-risk, moderate-risk, and high-risk. The landslide analysis methodology employed in this research has demonstrated an accuracy rate of 83.50%, rendering it a viable tool for issuing warnings or conducting ongoing monitoring of landslide occurrences within the study area. The developed application provides an online map interface that allows users and stakeholders to access and utilize the landslide data for monitoring and surveillance purposes. Furthermore, the digital platform enables users to assess whether their current residential areas have a history of landslides or are susceptible to landslide events. Moreover, the platform serves as valuable input for refining and enhancing the accuracy of landslide risk analysis. In future research, it is recommended to leverage the data collected through the developed platform and explore the implementation of machine learning techniques. This advancement would facilitate real-time analysis and visualization of landslide data in different geographical areas, yielding valuable insights for effective landslide management. The digital platform introduced in this research possesses utility for diverse user groups, encompassing citizens, disaster prevention and relief officials, as well as other government agencies. Its applicability extends across different phases, encompassing pre-landslide preparedness, real-time monitoring during an event, and post-landslide recovery and response efforts.
[1] Osberghaus, D., Fugger, C. (2022). Natural disasters and climate change beliefs: The role of distance and prior beliefs. Global Environmental Change, 74: 102515. https://doi.org/10.1016/j.gloenvcha.2022.102515
[2] Martínez-Zarzoso, I., Nowak-Lehmann, F., Paschoaleto, R.D.L. (2023). Climate change, natural disasters, and international migration: A country-level analysis considering climatic zones. Frontiers in Climate, 4: 986088. https://doi.org/10.3389/fclim.2022.986088
[3] Al Mamun, A., Islam, A.R.M.T., Alam, G.M., Sarker, M.N.I., Erdiaw-Kwasie, M.O., Bhandari, H., Mallick, J. (2023). Livelihood vulnerability of char land communities to climate change and natural hazards in Bangladesh: An application of livelihood vulnerability index. Natural Hazards, 115(2): 1411-1437. https://doi.org/10.1007/s11069-022-05599-y
[4] Bhola, V., Hertelendy, A., Hart, A., Adnan, S.B., Ciottone, G. (2023). Escalating costs of billion-dollar disasters in the US: Climate change necessitates disaster risk reduction. The Journal of Climate Change and Health, 10: 100201. https://doi.org/10.1016/j.joclim.2022.100201
[5] Esposito, G., Salvati, P., Bianchi, C. (2023). Insights gained into geo-hydrological disaster management 25 years after the catastrophic landslides of 1998 in southern Italy. International Journal of Disaster Risk Reduction, 84: 103440. https://doi.org/10.1016/j.ijdrr.2022.103440
[6] Bukhari, M.H., da Silva, P.F., Pilz, J., et al. (2023). Community perceptions of landslide risk and susceptibility: A multi-country study. Landslides, 20(6): 1321-1334. https://doi.org/10.1007/s10346-023-02027-5
[7] Ma, S., Qiu, H., Zhu, Y., Yang, D., Tang, B., Wang, D., Wang, L., Cao, M. (2023). Topographic changes, surface deformation and movement process before, during and after a rotational landslide. Remote Sensing, 15(3): 662. https://doi.org/10.3390/rs15030662
[8] Ke, K., Zhang, Y., Zhang, J., Chen, Y., Wu, C., Nie, Z., Wu, J. (2023). Risk assessment of earthquake–landslide hazard chain based on CF-SVM and newmark model—Using Changbai Mountain as an example. Land, 12(3): 696. https://doi.org/10.3390/land12030696
[9] Sujatha, E.R., Sudarsan, J.S., Nithiyanantham, S. (2023). A review on sustainable reinforcing techniques to stabilize slopes against landslides. International Journal of Environmental Science and Technology, 20: 13873-13882. https://doi.org/10.1007/s13762-023-04832-w
[10] Khaliq, A.H., Basharat, M., Riaz, M.T., Riaz, M.T., Wani, S., Al-Ansari, N., Le, L.B., Linh, N.T.T. (2023). Spatiotemporal landslide susceptibility mapping using machine learning models: A case study from district Hattian Bala, NW Himalaya, Pakistan. Ain Shams Engineering Journal, 14(3): 101907. https://doi.org/10.1016/j.asej.2022.101907
[11] Pecoraro, G., Nicodemo, G., Menichini, R., Luongo, D., Peduto, D., Calvello, M. (2023). Combining statistical, displacement and damage analyses to study slow-moving landslides interacting with roads: Two case studies in southern Italy. Applied Sciences, 13(5): 3368. https://doi.org/10.3390/app13053368
[12] Roy, P., Martha, T.R., Vinod Kumar, K., Chauhan, P., Rao, V.V. (2023). Cluster landslides and associated damage in the Dima Hasao district of Assam, India due to heavy rainfall in May 2022. Landslides, 20(1): 97-109. https://doi.org/10.1007/s10346-022-01977-6
[13] Wijaya, I.P., Straka, W., Mergili, M., Ottner, F., Wriessnig, K., Arndt, R., Andreatta, P., Arifianti, Y., Zangerl, C. (2023). Geological characterization and failure analysis of a catastrophic landslide in volcaniclastic soils: The Banjarnegara–Jemblung Landslide (Indonesia). Quarterly Journal of Engineering Geology and Hydrogeology, 56(1). https://doi.org/10.1144/qjegh2021-157
[14] Mızrak, S., Turan, M. (2023). Effect of individual characteristics, risk perception, self-efficacy and social support on willingness to relocate due to floods and landslides. Natural Hazards, 116(2): 1615-1637. https://doi.org/10.1007/s11069-022-05731-y
[15] Pathak, L., Devkota, K.C. (2022). Landslide susceptibility assessment in the Rangun Khola watershed of far western Nepal. Journal of Nepal Geological Society, 63: 33-44. https://doi.org/10.3126/jngs.v63i01.50827
[16] Schmidt-Thomé, P., Tatong, T., Kunthasap, P., Wathanaprida, S. (2018). Community based landslide risk mitigation in Thailand. Episodes Journal of International Geoscience, 41(4): 225-233. https://doi.org/10.18814/epiiugs/2018/018017
[17] Saengkhattiya, T. (2020). Pupils solving environmental problems: A landslide example from Thailand. Primary Science, 164: 8-11.
[18] Chansorn, R., Chotpantarat, S., Klongvessa, P. (2023). Hydrological model of landslide risk in Huai Nam Phung subbasin, Thailand. Bulletin of Engineering Geology and the Environment, 82(4): 140. https://doi.org/10.1007/s10064-023-03146-y
[19] Ali, S.A., Parvin, F., Vojteková, J., Costache, R., Linh, N.T.T., Pham, Q.B., Vojtek, M., Gigović, L., Ahmad, A., Ghorbani, M.A. (2021). GIS-based landslide susceptibility modeling: A comparison between fuzzy multi-criteria and machine learning algorithms. Geoscience Frontiers, 12(2): 857-876. https://doi.org/10.1016/j.gsf.2020.09.004
[20] Li, B., Wang, N., Chen, J. (2021). GIS-based landslide susceptibility mapping using information, frequency ratio, and artificial neural network methods in Qinghai Province, Northwestern China. Advances in Civil Engineering, 2021: 1-14. https://doi.org/10.1155/2021/4758062
[21] Shahabi, H., Hashim, M. (2015). Landslide susceptibility mapping using GIS-based statistical models and remote sensing data in tropical environment. Scientific Reports, 5(1): 9899. https://doi.org/10.1038/srep09899
[22] Saha, A., Villuri, V.G.K., Bhardwaj, A. (2022). Development and assessment of GIS-based landslide susceptibility mapping models using ANN, Fuzzy-AHP, and MCDA in Darjeeling Himalayas, West Bengal, India. Land, 11(10): 1711. https://doi.org/10.3390/land11101711
[23] Mersha, T., Meten, M. (2020). GIS-based landslide susceptibility mapping and assessment using bivariate statistical methods in Simada area, northwestern Ethiopia. Geoenvironmental Disasters, 7(1): 1-22. https://doi.org/10.1186/s40677-020-00155-x
[24] Anis, Z., Wissem, G., Vali, V., Smida, H., Mohamed Essghaier, G. (2019). GIS-based landslide susceptibility mapping using bivariate statistical methods in North-western Tunisia. Open Geosciences, 11(1): 708-726. https://doi.org/10.1515/geo-2019-0056
[25] Sonker, I., Tripathi, J.N. (2022). Remote sensing and GIS-based landslide susceptibility mapping using frequency ratio method in Sikkim Himalaya. Quaternary Science Advances, 8: 100067. https://doi.org/10.1016/j.qsa.2022.100067