Mimi Arifin*![]() | Wiwik Wahidah Osman
| Wiwik Wahidah Osman![]() | Jayanti Mandasari Andi Munawarah Abduh
| Jayanti Mandasari Andi Munawarah Abduh![]() | Adiba Abu Massir
| Adiba Abu Massir![]() | Andi Nada Zahirah
| Andi Nada Zahirah![]()
© 2023 IIETA. This article is published by IIETA and is licensed under the CC BY 4.0 license (http://creativecommons.org/licenses/by/4.0/).
OPEN ACCESS
Rapid population growth and the development of new settlements have led to significant and uncontrolled land use change, particularly the conversion of agricultural land to residential areas. This study explores the socioeconomic impacts of such changes in Pattalassang District, South Sulawesi, Indonesia, a newly established satellite city. Using qualitative descriptive analysis, spatial analysis, and quantitative analysis, as well as SWOT analysis, we found that the conversion of agricultural land into settlements has led to an increase in population, changes in social activities, a decline in traditional harvesting culture, and a decrease in crime rates. Economically, these changes have opened up new employment sectors, created side jobs, reduced unemployment, and increased incomes and land prices. However, our analysis also revealed that 5.46% of residential land in 2011 and 30% in 2021 did not improve. Comply with spatial plans. Our findings underscore the need for coordination of spatial planning policies at the provincial, district, and metropolitan levels and emphasize the importance of consistent and transparent policy implementation, particularly in relation to protected paddy fields.
land use change, new settlements, socio-economic impacts, spatial planning policy, Pattallassang sub-district
Increasing population growth necessitates the expansion of housing and residential areas. However, land suitable for development is in short supply. Consequently, a significant portion of agricultural lands are being repurposed into housing and settlements.
The condition of the soil is largely dependent on its quantity and quality, encompassing factors such as location, marketing form, regional structure, and other characteristics [1]. Exploitative land use not only inflicts ecological damage on the environment but also brings about economic impacts that require attention [2]. Singh et al. [3] argue that the pattern of land use and its cover is the result of natural and socio-economic factors, as well as human utilization across space and time [3].
State decisions heavily influence land use changes, with the government providing robust support for optimal land conditions in marketing development based on long-term comprehensive programs [4]. Spatial planning policies imposed by the government regulate land use to prevent environmental damage.
In developing countries, high rates of urban population growth are commonplace, leading to sprawling new settlements and creating problems related to uninhabitable housing [5]. Sieverts [5] notes that the rapid, unplanned, and uncontrolled growth can severely affect urban residents and their environment [6].
According to Sujarto [7], there are three strategies to address the housing needs of urban residents: urban intensification, urban extensification, and new city development. The development of new settlements or cities is driven by rapid population growth and migration in urban areas.
Data from the Population Service reveals that the population of Pattallassang District has been steadily increasing, reaching 22,101 people [8], 24,064 people [9], and 31,097 people [10] in successive years. This population growth has implications for the available land area, potentially driving changes in land use and escalating demand for paddy fields to cater to the burgeoning population.
According to Shi et al. [11], there has been a significant increase in land use in urban and rural residential areas, while fertile land has decreased. The conversion of paddy fields represents a serious threat, as land conversion is difficult to reverse. The permanent, cumulative, and progressive impact on food security is profound [12]. Urbanization, coupled with the birth rate, contributes to this increase in numbers. The provision of tourism and urbanization services, combined with the neglect of cultural ecosystem services and their interactions, can result in uneven availability of infrastructure and access to natural resources [13], leading to a decline in environmental quality.
Land conversion, as stated by Irawan [12], can eradicate the livelihood and income of farmers reliant on agriculture. This loss of income can diminish purchasing power and reduce the economic accessibility of farming households to food. Land conversion also impacts the social welfare of the community. Leong et al. [14] suggest that social or human welfare, encompassing the non-material benefits and values provided by the environment, can be defined in various ways. A high-quality environment supports the realization of a decent and harmonious residential life. The tendency is that as community values shift, community identity may fade, diminishing the sense of community.
If the environment deteriorates socially, economically, and ecologically, the quality of human life will decline, resulting in less qualified generations. Furthermore, if the conversion of agricultural and food land into settlements continues unchecked, it poses a threat to local and national food security. These points underscore the importance of spatial planning policies, particularly those related to the development of housing and residential areas in a region.
Presidential Regulation Number 55 of 2011 [15] concerning the Spatial Plan for the Makassar, Maros, Sungguminasa, and Takalar Metropolitan Area (Mamminasata) establishes the Mamminasata metropolitan area as a pilot for integrated spatial development in Indonesia. Pattallassang Sub-district is one of the areas designated as a new city with a function as a satellite city. The integrated spatial concept makes Mamminasata the centre of economic growth in Eastern Indonesia. Sustainable regional development requires systems-based thinking that involves society, the environment, and the economy in a balanced manner [16].
Regional Regulation of Gowa Regency Number 15 of 2012 concerning Spatial Planning for 2012-2032 [17] mentions the new Gowa-Maros urban settlement area. The eastern part of the Mamminasata Satellite City is designated in Panaikang Village, Paccelekang Village, and Pattallassang District.
With the establishment of Pattallassang District as a new city with a satellite city function, it is predicted that there will be a mass population movement rate to Pattallassang District as a strategic location in the middle of the Mamminasata Metropolitan Area in the next few years. Affordable accessibility to other strategic areas, such as ports and airports, is an attraction that drives people to move. Government policy will indirectly trigger land conversion.
This research aims to find out how much agricultural land was converted into residential land from 2011 to 2021, how much the mismatch of settlement space utilization between existing and existing spatial planning policies, and the impact of conversion of agricultural land into settlements on the socio-economic conditions of the community in Pattallassang District, Gowa Regency.
2.1 Landuse change
According to Dewi and Sajana [18], land can be divided into two types according to its use: agricultural and non-agricultural. Agricultural Land is further divided into rice fields and non-rice fields. Rice fields include rice fields with irrigation, rainfed, tidal, and so on.
According to Ntlhe [19], Land use change is usually guided by spatial laws and the country's political influence. Land cover includes natural and manufactured changes on the land surface over time [19].
Changes in land use are one of the realities that occur in Indonesia. This is influenced by urbanization, population growth, and economic changes. The level of land use change is different in each region.
According to Utomo et al. [20], land conversion is a change from one land use to another. Land conversion is a change or adjustment of land use designation caused by factors that generally include the need to meet the needs of an increasing population and demands to improve a better quality of life. One case study in the UK states that an increase in the built-up area has led to a decrease in green space [21].
Irawan [12] mentioned many factors of agricultural land conversion, including external factors (urbanization and population growth), internal factors (social and economic), and policy factors (local government regulations). Land use/cover change occurs frequently in various countries for various reasons. Internal factors include changes to access built-up areas [22, 23] and create space for agriculture and settlements [24, 25]. In terms of external factors, the increasing population and development activities have replaced the function of agricultural land to produce food with other uses, such as settlements and offices.
According to Siagian et al. [26], most of Indonesia's land use policies do not contradict each other in maintaining land use by the central and local governments. Government policies also trigger land conversion when regulations cannot result in favourable land use planning in certain areas.
2.2 Agriculture
Agriculture uses human activities to obtain products from plants and animals [23, 27]. This was initially achieved by deliberately perfecting all the possibilities nature provides for breeding these plants and animals. But nowadays, the condition of agricultural land decreases with the development of cities. Agriculture in suburban areas has challenges in maintaining the sustainability of agriculture during urban development [28].
The amount of agricultural land turned into settlements due to accelerated urbanization has implications for the decline in environmental quality, including the loss of fertile land. This was also stated by Kokoye [29], who said that land use change affects soil fertility and environmental damage.
2.3 The development of settlements
The growth of urban settlements characterizes urban development. Where settlements occupy agricultural land that it can have an impact on local communities. The social effects of converting agricultural land into residential land [30] are changes in population structure and community livelihoods.
There are five essential elements of a settlement [31]:
a. Natural elements
b. Human element
c. Elements of society
d. Building elements
e. Infrastructure elements.
One of the problems that currently occurs in settlement development is land limitation. Therefore, it is common to find agricultural land changes into settlements. The housing development is uncontrolled. The community is harmed, there is a decrease in environmental quality, and various other problems related to housing development [32].
2.4 Social-economic impact
Housing development in the suburbs can influence migrants to come to the suburbs-migrants who come from within the city, outside, or other cities. Migrants motivated by different socio-cultural environments will affect the order of the socio-cultural climate concerning the lifestyle and behaviour of the community or indigenous people. As a result, the village characteristics that were initially very visible gradually diminished in line with the adoption of urban values.
According to Supartono et al. [30], this affects the characteristics that appear in the community in the neighbourhood, both socially and economically. In this regard, a variable is needed to see the community's economic condition. Furthermore, according to Hariyanto [33], agricultural land has economic value as a buffer for food needs and functions ecologically, namely regulating water management, carbon absorption in the air, etc.
3.1 Measurement units and numbers
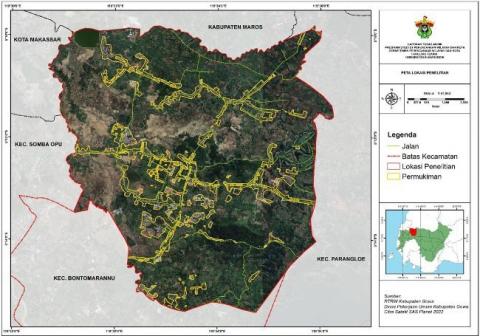
Geographically, Pattallassang District is in Gowa Regency, South Sulawesi, with the northern part bordering Makassar City and Maros Regency, the eastern part is bordering with Parangloe District, the south it is bordering with Bontomarannu District, and the western part is bordering Somba Opu District. Most of the topography of the village area is a lowland area with an average elevation of fewer than 500 meters above sea level. Still, one village is dominated by hillside areas, namely Timbuseng Village, where most of the population is spread over Bollangi Hill (Figure 1).
Figure 1. Research location
3.2 Data sources and acquisition methods
This study aims to identify the impact of land use change from agricultural land to settlement area. In this case, qualitative descriptive analysis describes the change and the impact on the environment through social phenomenon and participant perspective. Meanwhile, the quantitative approach is chosen to provide the result on the numerical side. Both approaches are utilized to give more evidence. To obtain primary data, questions are given to the respondents in a questionnaire related to the factors of changing agricultural land into residential land and the socio-economic impacts on the community. In addition, field observations were made to get a precise picture of the research object. Collecting data through direct communication with the community and the government regarding the factors of changing agricultural land into residential land and the socio-economic impacts on the community. Secondary data is collected from books, research documents, or your literature review related to the research, including regulations.
3.3 Measurement units and numbers
This study uses Non-Probability Sampling, namely Accidental Sampling. The sampling technique is based on the spontaneity factor, meaning that everyone who accidentally meets the researcher and according to the characteristics of the person can be used (respondent). The use of this accidental sampling method is based on considerations of limited time and resources. The use of flexibility and efficiency is the point used in sampling in research. Researchers realize that there are limitations and potential biases in this sampling method. Therefore, the provision of criteria for the population is also applied, such as restrictions on age, length of residence, and type of change experienced.
The sample used in this study will be determined using the Slovin formula. The use of the Slovin formula can choose the correct number of samples. In line with the limitations in research in the form of limited time and resources, using the Slovin formula is considered appropriate. This can save time and money in research and produce accurate and representative data. The sample used in this study will be determined using the Slovin formula as follows
$\mathrm{n}=\frac{N}{1+N e^2}$ (1)
N=Total Population
n=Number of Samples
e=error tolerance limit, the percentage of inaccuracy (precision) due to sampling errors that are still tolerated or desired. The tolerance limit used in this study was 10%.
From the results of calculating the number of samples above, the samples were then distributed to each village using the proportional allocation formula [34]:
$\mathrm{n}=\frac{N}{\Sigma N} X N 1$ (2)
n=number of samples from each stratum
∑N=total number of sample members
N1=number of sample members for each stratum
N=number of members of the entire population.
From this formula, the results of the distribution of samples in each region (Village) are obtained as following Table 1:
Table 1. Sample table of each area
|
Regional |
Population (N) |
Proportional (P=N/∑N) |
Sample (N=P x 100) |
|
Timbuseng |
5.653 |
0.181 |
18 |
|
Sunggumanai |
3.473 |
0.111 |
11 |
|
Pattallassang |
4.989 |
0.160 |
16 |
|
Pallantikang |
4.493 |
0.144 |
14 |
|
Paccellekang |
4.308 |
0.138 |
14 |
|
Borong Pa'lala |
2.115 |
0.068 |
7 |
|
Panaikang |
2.926 |
0.095 |
10 |
|
Jenemadinging |
3.140 |
0.100 |
10 |
|
Total |
31.097 |
|
100 |
Based on Table 1, it can be seen that the sample for Timbuseng village is 18 people, 11 people for Sunggamani, 16 people for Pattallassang, 14 people for Pallantikang, 14 people for Paccellekang, seven people for Borong Pa'lala, ten people for Panaikang, and ten people for Jenemadinging.
3.4 Analysis method
To obtain a land cover area in Pattallassang District 2011-2021, the total change area from agricultural land to settlements in Pattallassang District 2011-2021, as well as to determine the suitability of residential land use in Pattallassang District to the spatial plan of Gowa Regency, then the spatial analysis is developed. Spatial analysis techniques are a group of techniques that can be used in processing GIS data. The results of spatial data analysis depend on the location or object of research being analyzed. All mathematical calculation techniques related to spatial data are carried out with this analysis function.
The following subjective of the study is to perceive the impact of changes in converting agricultural land into residential land on the social and economic conditions of local communities in Pattallassang District using a qualitative descriptive analysis technique with a frequency distribution method. In this case, the use of frequency distribution analysis in this study was obtained from the results of data collection techniques carried out through questionnaires and interviews, then presented in the form of tables and diagrams with percentages for each group studied.
The third research objective is to develop directions for settlement development in Pattallassang District using qualitative and quantitative descriptive analysis techniques and SWOT analysis.
SWOT analysis is an assessment of the existing state of an area, both internally and externally, to produce a direction to achieve planning objectives [35]. SWOT is an abbreviation of strengths, weaknesses, opportunities, and threats.
After knowing the strengths, weaknesses, opportunities and threats experienced, develop a directive using the SWOT matrix. As seen in the SWOT matrix table (Table 2), there will be four alternative groups of directions: SO strategies, ST strategies, WO strategies, and WT strategies.
Table 2. SWOT analysis matrix
|
External |
Strength (S) |
Weakness (W) |
|
Opportunity (O) |
Strategy (SO) Create a system that uses strengths to capitalize on opportunities |
Strategy (WO) Create strategies that minimize weaknesses to take advantage of opportunities |
|
Situ (T) |
Strategy (ST) Create a system that uses strengths to overcome threats |
Strategy (WT) Create strategies that minimize weaknesses to take advantage of opportunities |
4.1 Land cover analysis of Pattallassang District 2012-2021
4.1.1 Pattallassang District land cover 2011
Land cover in Pattallassang District in 2011 was dominated by agricultural land in moorland/moorland, irrigated rice fields, and mixed dryland agriculture. Land in Pattallassang Sub-district is dominated by paddy fields (2,585 ha), while the minor land cover is lakes (27 ha).
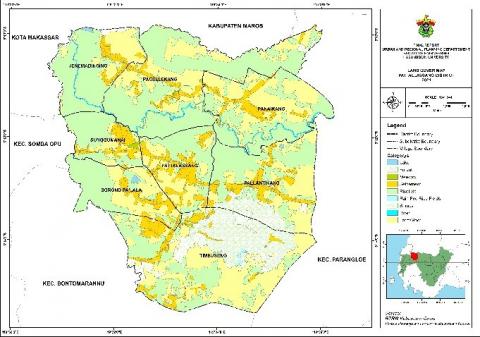
Irrigated rice fields, moor/rice fields, and settlements dominate land cover in the Pattallassang sub-district in 2021. From time to time, land cover in this sub-district has undergone many changes, including residential land use due to the increasing population in the Pattallassang sub-district. The area of residential land cover increased from 322 ha (2011) to 876.82 ha (2021). Meanwhile, the location of land cover in the designation of moor/rice fields and mixed dry land agriculture in 2021 has decreased. The following map of land cover in 2021 in Pattallassang District can be seen in Figure 2.
Figure 2. Pattallassang District land cover map 2021
4.1.2 Changes in Pattallassang District 2011-2021
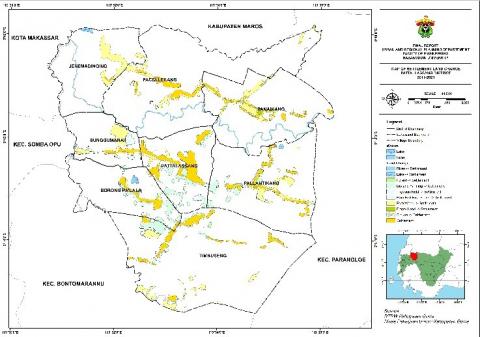
Changes in residential land cover in Pattallassang District from 2011-2021 are presented in Figure 3. The yellow land cover did not change, and the red land cover changed. The area of agricultural land cover that changed to residential in 2011-2021 was 876.82 ha.
Figure 3. Pattallassang district land change map 2011-2021
In Figure 3 above, the land cover that has changed is land cover that initially turned into agricultural settlements. Agricultural land cover that turned into settlements in 2011-2021 is dry agriculture in mixed land, moor/rice fields, and some irrigated rice fields turned into settlements. An overview of the extent of land cover change in Pattallassang Sub-district into settlements can be seen from the Pattallassang Sub-district land cover table.
Table 3. Land cover change in Pattallassang Sub-District to settlement 2011
|
Land Cover Change in Pattallassang District into Settlements 2011-2021 |
Luas (ha) |
|
Lake Area-Settlements |
0.10 ha |
|
Fields/Tegal-Settlements |
3.80 ha |
|
Vacant Lots-Settlements |
338.65 ha |
|
Mixed Land Farming-Settlements |
5.26 ha |
|
Irrigated Rice Fields-Settlements |
130.43 ha |
|
Rainfed Rice Fields-Settlements |
74.10 ha |
|
Shrubs-settlements |
0.97 ha |
|
Riverbanks-Settlements |
0.01 ha |
|
Fixed Settlements |
1.03 ha |
Table 3 above shows that the enormous change in agricultural land cover in Pattallassang Sub-district is conversion to residential areas. From the table, it is dominated by paddy fields with a changing area of 338.65 hectares. Agricultural Land is rainfed and irrigated rice fields that should not be converted. This condition should be a warning to the local government in licensing housing and settlement development.
The map of the land cover change in Pattallassang Sub-district that has been converted into settlements can be seen in Figure 4 below.
Figure 4. Pattallassang District land change map 2011-2021
The overall land cover of settlements in Pattallassang Sub-district still contains land not following the 2012-2032 Gowa Regency spatial plan, which can be seen in Figure 5 and Figure 6.
Based on Figure 5 and Figure 6, the area of settlement land in 2011 following the 2012-2032 Gowa Regency Spatial Plan was 304.82 ha (94.53%), while the area of settlement land in 2011 not following the spatial pattern plan reached 17.63 ha (5.46%). The location of residential land in 2021 following the 2012-2032 Gowa Regency spatial plan is 616.46 ha (70%), and the area of residential land in 2021 that is not following the planned spatial pattern is 260.39 ha (30%). This reality illustrates the uncontrolled growth of the city. The tendency in 30% of the land that does not following the allocation of residential land is that there are settlements with minimal infrastructure that tend to be slums and illegal. If not resolved as early as possible, it will become a problem developing into slum pockets that reduce urban quality.
Figure 5. Map of land cover conformity of Pattallassang sub-district settlement in 2011 to the spatial pattern of Gowa regency spatial plan 2012-2032
Figure 6. Map of land cover conformity of Pattallassang sub-district settlement in 2021 against the spatial pattern of Gowa regency spatial plan 2012-2032
4.2 Analysis of the impact of changes in the function of agricultural land into residential land on the socio-economic conditions of the community in Pattallassang District
4.2.1 Analysis of the impact of conversion of agricultural land into settlements on social conditions
1. Population change
The conversion of agricultural land into settlements in Pattallassang District will cause population changes. This change is caused by new residents (urbanization flow), with an increasing number of new housing developments yearly. Changes in population in Pattallassang District can be seen in the following table.
In Table 4, the change in population in Pattallassang District in the last ten years has increased. In 2011 the population of Pattallassang District was 22,101 people, with a population density of 260 people/km2. From 2011-2016, it increased by 1,963 people, with a total population 2016 of 24,064 people with a population density of 283 people/km2. In 2021 the population of Pattallassang District increased rapidly to 31,097 people with a population density of 366 people/km2. The rapid growth of the population may indicate the rapid growth of settlements.
Table 4. Total population of Pattallassang district by gender
|
Year |
Men (Soul) |
Women (Soul) |
Total (Soul) |
|
2011 |
11.114 |
10.987 |
22.101 |
|
2016 |
12.059 |
12.005 |
24.064 |
|
2021 |
15.409 |
15.688 |
31.097 |
2. Social interaction between communities
Figure 7 shows the condition of social interactions before converting agricultural land into settlements. Based on the observation results, 68 respondents stated they knew each other, and 31 respondents stated they only knew each other. One respondent said they did not know each other. Meanwhile, after converting agricultural land into settlements, 70 respondents said they knew each other, 29 respondents said they only knew each other, and one respondent said they did not. Respondents' assessment of social conflict between communities in Pattallassang District before and after land conversion is as follows (Figure 8).
Figure 7. Level of community social interaction in Pattallassang subdistrict before and after land conversion
Figure 8. Percentage change in community social conflict in Pattallassang District
Respondents argued that converting agricultural land into settlements was still rare, with a percentage of 99% of respondents stating that there was no social conflict. Whereas after land conversion, community social conflicts increased slightly, with 7% of respondents answering that social conflicts occurred after the conversion of agricultural land into settlements. As the level of social interaction increases, so does social strife.
3. Community social activities
There are various social activities in Pattallassang District, but the dominant social activity before and after land conversion is service work, which increased by 13% after land conversion (Figure 9).
Figure 9. Percentage of community social activities in Pattallassang District
4. Folk culture
Community culture in Pattallassang District is dominated by harvest culture, with a percentage of 38%. Based on the results of interviews with several respondents, the harvest culture in Pattallassang District has rarely been carried out after the conversion of agricultural land into settlements due to the development of residential areas. This results in an influx of migrants or residents with different backgrounds which causes a person to become individualistic.
5. Crime rate
Figure 10. Percentage of crime rate in Pattallassang District
The crime rate before land conversion in Pattallassang District was still vulnerable. Judging from the respondents' answers, as many as 28 stated that there were criminal acts like legalization. However, after converting agricultural land into settlements, crime began to decrease. Only nine respondents said that there was a criminal offence (Figure 10). With the increase in residential development, more jobs were created, so crime began to decrease.
4.3 Analysis of the impact of agricultural land conversion into settlements on economic conditions
4.3.1 Livelihood
Based on respondents' opinions, livelihoods before converting agricultural land into settlements were working as farmers, with a percentage of 21%. This is because the land cover of Pattallassang District at the time before the conversion of agricultural land into settlements was agricultural land. Apart from farmers, some respondents have livelihoods in other fields, such as traders/self-employed with a percentage of 18% and civil servants/police/teachers with 12%. A total of 43% of respondents did not have a job (Figure 11).
Figure 11. Percentage of livelihoods in Pattallassang District
With the increasing conversion of agricultural land into settlements, the development of housing developments with various activities follows. The development of jobs that require a number of workers has opened up opportunities for local people to get jobs, even part-time side jobs.
4.3.2 Community income level
Table 5. Community income
|
Income |
Before |
After |
|
|
Total |
Total |
|
<Rp500.000,00 |
8 |
4 |
|
Rp600,000.00-Rp1500,000.00 |
29 |
27 |
|
IDR1,600,000.00-IDR2,500,000.00 |
10 |
29 |
|
>IDR2,600,000.00 |
12 |
27 |
|
No income |
41 |
13 |
Based on Table 5, it can be concluded that most respondents had various income levels before converting land from agricultural land to residential areas. A total of 41 respondents had no income. Eight respondents earned<Rp500,000, 29 earned Rp600,000-Rp1,600,000, 10 earned Rp1,600,000-Rp2,500,000, and 12 earned>Rp2,600,000. In general, there was an increase in income. In fact, 28% of respondents originally had no income, but with the development of settlements in the Pattalassang sub-district, they have an income.
4.3.3 Level of public spending
Based on Table 6, it can be concluded that most respondents. Before the land use change, they had a low level of expenditure. The average expenditure of the Pattallassang community was <Rp. 500,000.00/month, with 43 respondents. After the land use change, the highest expenditure was around Rp. 1,600,000.00-Rp. 2,500,000.00/month with 33 respondents. After the land use change, the expenses also increased in addition to the income and type of employment increase (Figure 12). In general, there is an increase in spending along with the growth of various activities that are interesting to enjoy, making them more consumptive.
Table 6. Public expenditure
|
Income |
Before |
After |
|
|
Total |
Total |
|
<Rp500.000,00 |
43 |
12 |
|
Rp600,000.00-Rp1,500,000.00 |
36 |
30 |
|
IDR1,600,000.00-IDR2,500,000.00 |
10 |
33 |
|
> IDR2,600,000.00 |
11 |
25 |
Figure 12. Percentage of land price in Pattallassang District
4.3.4 Land price
Development in Pattallassang District that continues to occur makes land prices increase. Respondents said that land prices in Pattallassang District before converting agricultural land into settlements were still around Rp. 100,000-Rp. 500,000/m2, and now after the conversion of agricultural land into settlements, land prices have reached <Rp. 600,000-Rp. 2,600/m2.
The impacts and changes before and after the land conversion in Pattalassang sub-district from agriculture to settlements illustrate the changing characteristics of rural community life towards the aspects of urban community life. This process demonstrates the process of the village towards the city form with its features, both socially with the harvested culture that began to fade, the emergence of new activities such as arisan, and increasing social conflict. Likewise, economic impacts such as increased income along with shifting work patterns, the emergence of various side jobs, and the characteristics of increased expenses and land prices.
4.4 Settlement development direction
The planning of the Maminasata metropolitan city has implications for the development of easy access from the cities of Makassar, Maros, Gowa, and Takalar. Likewise, the government policy in establishing Pattallassang Sub-district as a new city with the function of a Satellite City has caused Pattallassang Sub-district to develop rapidly, characterized by settlements that grow and tend to be uncontrolled. The amount of agricultural land converted into territories has implications for the decline of local foodstuffs. This requires early control before a city is already in trouble. The considerable deviations in the suitability of settlement space utilization indicate the emergence of slums and a decline in urban quality.
According to Kustiwan [36], agricultural land conversion is also influenced by external, internal, and government policy factors. External factors include the dynamics of urban growth, both spatially, demographically, and economically that spur or encourage the conversion of agricultural land. Internal factors are the socio-economic conditions of households, as stated by Irawan [12].
Through the EFAS (External Strategic Factors Analysis Summary) and IFAS (Internal Factor Analysis Summary) analysis stages, internal and external indicators are evaluated and scored to determine the position. In the IFAS analysis, indicators, including strengths and weaknesses, are formulated. In the EFAS analysis, the indicators included are external opportunities and threats. After the two matrices were compiled, the results were entered into the SWOT matrix to formulate the proposed strategy in Tables 7 and 8.
Table 7. Summary of internal strategic analysis (IFAS)
|
No. |
Internal Factors |
Weight |
Rating |
X Weight Rating |
|
|
Power |
|
|
|
|
1. |
Directly adjacent to Makassar City (the capital of South Sulawesi Province) and adjacent to Maros Regency, the growth dynamics of the new city of Pattallassang are rapid. |
0.2 |
4 |
0.8 |
|
2. |
Has Mamminasata road access (Connecting Gowa-Maros-Kota Makassar in the development of Mamminasata Metropolitan Area)) |
0.2 |
3 |
0.6 |
|
3. |
Open up job opportunities and side hustles |
0.2 |
2 |
0.4 |
|
4. |
Increase community income |
0.3 |
4 |
1.2 |
|
5. |
New types of social activities increase, and community social interactions, although reduced in frequency, are still established. |
0.1 |
3 |
0.3 |
|
|
Total |
1.0 |
|
3.3 |
|
|
Weaknesses |
|
|
|
|
1. |
Building settlements by utilizing agricultural Land |
0.8 |
4 |
3.2 |
|
2. |
Rising land prices |
0.1 |
3 |
0.3 |
|
3. |
Increased social conflict |
0.1 |
1 |
0.1 |
|
|
Total |
1.0 |
|
3.6 |
|
|
Total IFAS (Strengths-Weaknesses) |
|
|
-0.3 |
Table 8. Summary of external strategic analysis (EFAS)
|
No. |
Internal Factors |
Weight |
Rating |
X Weight Rating |
|
|
Opportunities |
|
|
|
|
1. |
Pattallassang Sub-district in Gowa Regency, in the development planning of the Mamminasata Metropolitan Area, is designated as a new city with a satellite city function [15]. |
0.2 |
4 |
0.8 |
|
2. |
The new urban settlement of the eastern part of Mamminasata Satellite City was established in Panaikang Village and Paccelekang Village and integrated with the Padivalley Golf Course based in Pattallassang District [17]. |
0.3 |
4 |
1.2 |
|
3. |
The development of residential areas results in more facilities and activities. |
0.3 |
3 |
0.9 |
|
4. |
Increase the interest of new housing developers. |
0.2 |
4 |
0.8 |
|
|
Total |
1.0 |
|
3.7 |
|
|
Threat |
|
|
|
|
1. |
The increase in migrants with different backgrounds makes the environment vulnerable to conflict and settlements not by the designation, lack of facilities, the forerunner of the formation of slums. |
0.7 |
1 |
0.7 |
|
2. |
Reduced agricultural and water catchment areas can lead to a decline in food and environmental quality. |
0.3 |
2 |
0.6 |
|
|
Total |
1.0 |
|
2.2 |
|
|
Total IFAS (Opportunities-Threats) |
|
|
1.3 |
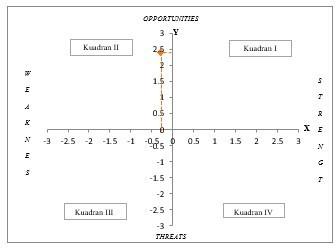
From the results of the above assessment using IFAS and EFAS supporting analysis, it is known that the position of the strategy in the SWOT quadrant matrix is X axis=-0.3 and Y axis=1.5.
Judging from Figure 13, the strategies generated in the SWOT matrix fall into quadrant II. Quadrant II shows the direction of settlement development in Pattallassang Sub-district has the potential to be implemented with a strategy that has growth opportunities but faces internal weaknesses. The focus of this strategy is to minimize internal problems so that development can be carried out by taking advantage of existing opportunities. The plan that can be carried out in the expansion of settlements in Pattallassang District is the WO strategy, namely:
Figure 13. SWOT diagram for determining strategies and directions for settlement development in Pattallassang Sub-district
The planning of the Maminasata metropolitan city has implications for the development of easy access from the cities of Makassar, Maros, Gowa, and Takalar. Likewise, the government policy in establishing Pattallassang Sub-district as a new city with the function of a Satellite City has caused Pattallassang Sub-district to develop rapidly, characterized by settlements that grow and develop tend to be uncontrolled. The amount of agricultural land converted into settlements has implications for the decline of local foodstuffs. This requires early control before a city is already in trouble. The considerable deviations in the suitability of settlement space utilization indicate the emergence of slums and a decline in urban quality.
The socio-economic impact in the Pattallassang sub-district illustrates the process of changing life from village to urban life. Socio-economic development starts from the increasing flow of urbanization and changes in the lifestyle of the people sooner or later, which is specific to the history of the development of cities in developing countries. The following process is the external pressure in the form of urban growth dynamics and internal social and economic influences on the community to switch entirely from village life to city life. ultimately implies massive conversion of agricultural land. This condition will reduce the local food landstock. If the same happens in several places in Indonesia, it will impact the reduction of national food stocks. Hence, the importance of spatial planning policies by the government, in the form of spatial planning that is planned in detail both detailed spatial plan Housing Development and Development Plans and Residential Areas equipped with zoning rules so that they can efficiently function as a control tool and be implemented consistently.
The limitations of our research on sample selection with accidental sampling, some samples are difficult to interview due to language barriers and level of understanding. We had to make sure the respondents understood our questions.
For the future, it is better to examine the process of land use change in a new city in another location for comparison. Or new city problems that have approached saturation growth. Sampling can be done by purposive sampling, represented by all layers of the independent and formal settlement community with several economic classes.
The authors thank Hasanuddin University, the Faculty of Engineering, and the Department of Urban and Regional Planning Engineering for funding the research.
[1] Volkov, S.N., Cherkashina, E.V. (2018). Transfer into use of unused agricultural lands: Significance, challenges, solutions. International Agricultural Journal, (4): 28-38. https://doi.org/10.24411/2588-0209-2019-10034
[2] Keesstra, S.D., Bouma, J., Wallinga, J., Tittonell, P., Smith, P., Cerdà, A., Montanarella, L., Quinton, J.N., Pachepsky, Y., van der Putten, W.H., Bardgett, R.D., Moolenaar, S., Mol, G., Jansen, B., Fresco, L.O. (2016). Forum paper: The significance of soils and soil science towards realization of the UN sustainable development goals (SDGS). Soil Discussions, 2016: 1-28. https://doi.org/10.5194/soil-2-111-2016
[3] Singh, M., Singh, R.B., Hassan, M.I. (2014). Microwatershed level conservation strategies for effective land management in haheom watershed, kashmir valley (J & K). In Landscape Ecology and Water Management: Proceedings of IGU Rohtak Conference. Springer Japan, 2: 341-352. https://doi.org/10.1007/978-4-431-54871-3_24
[4] Kutliyarov, D., Stafiychuk, I., Kutliyarov, A., Khisamov, R., Lukmanova, A. (2022). Retrospective result analysis of land reforms in the russian federation. International Journal of Sustainable Development & Planning, 17(3): 743-749. https://doi.org/10.18280/ijsdp.170305
[5] Sieverts, T. (2003). Cities without Cities: An Interpretation of the Zwischenstadt. Routledge.
[6] Chadchan, J., Shankar, R. (2012). An analysis of urban growth trends in the post-economic reforms period in India. International Journal of Sustainable Built Environment, 1(1): 36-49. https://doi.org/10.1016/j.ijsbe.2012.05.001
[7] Sujarto, D. (1986). Perencanaan Kota Baru. Bandung: ITB.
[8] Badan Pusat Statistik. (2011). Kabupaten Gowa Dalam Angka Tahun 2011.
[9] Badan Pusat Statistik. (2016). Kecamatan pattallassang dalam angka tahun 2016.
[10] Badan Pusat Statistik. (2020). Kabupaten Gowa Dalam Angka Tahun 2020.
[11] Shi, G., Jiang, N., Yao, L. (2018). Land use and cover change during the rapid economic growth period from 1990 to 2010: A case study of Shanghai. Sustainability, 10(2): 426. https://doi.org/10.3390/su10020426
[12] Irawan, B. (2005). Konversi lahan sawah: Potensi dampak, pola pemanfaatannya, dan faktor determinan. Forum Penelitian Agro Ekonomi, 23(1): 1-18. http://doi.org/10.21082/fae.v23n1.2005.1-18
[13] Hanaček, K., Rodríguez-Labajos, B. (2018). Impacts of land-use and management changes on cultural agroecosystem services and environmental conflicts-A global review. Global Environmental Change, 50: 41-59. https://doi.org/10.1016/j.gloenvcha.2018.02.016
[14] Leong, K.M., Wongbusarakum, S., Ingram, R.J., Mawyer, A., Poe, M.R. (2019). Improving representation of human well-being and cultural importance in conceptualizing the West Hawai ‘i Ecosystem. Frontiers in Marine Science, 6: 231. https://doi.org/10.3389/fmars.2019.00231
[15] Peraturan Presiden. (2011). Peraturan Presiden Nomor 55 Tahun 2011 Tentang Rencana Tata Ruang Kawasan Metropolitan Makassar, Maros, Sungguminasa, dan Takalar (Mamminasata).
[16] Murray, A., Skene, K., Haynes, K. (2017). The circular economy: An interdisciplinary exploration of the concept and application in a global context. Journal of Business Ethics, 140: 369-380. https://doi.org/10.1007/s10551-015-2693-2
[17] Peraturan Daerah Kabupaten Gowa Nomor 15 Tahun 2012 tentang RTRW Kabupaten Gowa Tahun 2012-2032. (2012). Indonesia.
[18] Dewi, I.A.L., Sarjana, I.M. (2015). Faktor-faktor pendorong alih fungsi lahan sawah menjadi lahan non-pertanian, manaj. Agribisnis, 3(2): 163-171.
[19] Ntlhe, D. (2022). The transformation of compact rural human settlements in south Africa-the case of elim in limpopo. International Journal of Sustainable Development & Planning, 17(1): 313-322. https://doi.org/10.18280/ijsdp.170132
[20] Utomo, M., RIfai, E., Thahir, A. (1992). Pembangunan Dan Alih Fungsi Lahan. Lampung: Universitas Lampung.
[21] Pauleit, S., Ennos, R., Golding, Y. (2005). Modeling the environmental impacts of urban land use and land cover change-a study in Merseyside, UK. Landscape and Urban Planning, 71(2-4): 295-310. https://doi.org/10.1016/j.landurbplan.2004.03.009
[22] Muriuki, G., Seabrook, L., McAlpine, C., Jacobson, C., Price, B., Baxter, G. (2011). Land cover change under unplanned human settlements: A study of the chyulu hills squatters, Kenya. Landscape and Urban Planning, 99(2): 154-165. https://doi.org/10.1016/j.landurbplan.2010.10.002
[23] Musa, M.K., Odera, P.A. (2015). Land use land cover changes and their effects on food security: A case study of kiambu county-kenya. Kabarak Journal of Research & Innovation, 3(1): 74-86.
[24] Muriithi, F.K. (2016). Land use and land cover (LULC) changes in semi-arid sub-watersheds of laikipia and athi river basins, kenya, as influenced by expanding intensive commercial horticulture. Remote Sensing Applications: Society and Environment, 3: 73-88. https://doi.org/10.1016/j.rsase.2016.01.002
[25] Baldyga, T.J., Miller, S.N., Driese, K.L., Gichaba, C.M. (2008). Assessing land cover change in kenya's mau forest region using remotely sensed data. African Journal of Ecology, 46(1): 46-54. https://doi.org/10.1111/j.1365-2028.2007.00806.x
[26] Siagian, D.R., Marbun, T., Hermanto, C., Alcantara, A.J. (2015). Landuse conversion impact assessment on landscape provisioning service for rice sufficiency in Langkat Regency, Indonesia. Procedia Environmental Sciences, 24: 3-14. https://doi.org/10.1016/j.proenv.2015.03.002
[27] Aarsten, V., Pieter, J. (1953). Ekonomi Pertanian Indonesia. Jakarta: PT.Pembangunan
[28] Christiawan, R. (2019). Conservation and development balance of the palm oil industry through sustainability regulation. In 3rd International Conference on Globalization of Law and Local Wisdom (ICGLOW 2019). Atlantis Press, pp. 24-29. https://doi.org/10.2991/icglow-19.2019.6
[29] Kokoye, S.E.H., Tovignan, S.D., Yegbemey, R.N. (2013). Land use change and food security: Has introduction of rice production in cotton zone in benin met optimal allocation of resources by households? Sustainable Food Security in the Era of Local and Global Environmental Change, pp. 287-300. https://doi.org/10.1007/978-94-007-6719-5_18
[30] Supartono, S., Ashar, K., Affandi, M. (2011). Analisis pengaruh variabel sosial ekonomi masyarakat urban terhadap kemandirian ekonomi ditinjau dari aspek keuangan, energi, dan pangan di kecamatan singosari kabupaten malang. Journal of Indonesian Applied Economics, 5(1): 37951. https://doi.org/10.21776/ub.JIAE.005.01.3
[31] Indonesia, R. (2011). Undang-undang No. 1 Tahun 2011 tentang perumahan dan kawasan permukiman. Lembaran Negara RI Tahun, (7).
[32] Yunus, H.S. (2008). Dinamika Wilayah Peri-urban: Determinan Masa Depan Kota.
[33] Hariyanto. (2010). Pola dan intensitas konversi lahan pertanian di kota semarang Tahun 2000-2009. Jurnal Geografi: Media Informasi Pengembangan dan Profesi Kegeografian, 7(1). https://doi.org/10.15294/jg.v7i1.86
[34] Sugiyono. (2007). Metodologi Penelitian Administrasi. JakartaL Grafindo.
[35] Pramono, R.W.D. (2021). Modul Teknik Analisis dan Perencanaan Wilayah. Yogyakarta: Depublish.
[36] Kustiwan, I. (2015). Permasalahan konversi lahan pertanian dan implikasinya terhadap penataan ruang wilayah, studi kasus: Wilayah pantura jawa barat. Jurnal Perencanaan Wilayah dan Kota, 8(1): 49-60.
[37] Suratiyah. (2015). Ilmu Usaha Tani. Jakarta: Penebar Swadaya.