Mohamed Elsayed Tolba*![]() | Abdel El Kaleq Ibrahim
| Abdel El Kaleq Ibrahim![]() | Tarek Wafik Mohamed
| Tarek Wafik Mohamed![]()
© 2023 IIETA. This article is published by IIETA and is licensed under the CC BY 4.0 license (http://creativecommons.org/licenses/by/4.0/).
OPEN ACCESS
In recent decades, the issue of urban poverty and deprivation become one of the most imperative problems experienced by countries at global level from the economic, political, social, and urban interaction processes, as World Bank estimated nearly 700 million persons fall below extreme poverty line in 2017. However, most studies have focused on exposure to identifying phenomenon and measuring its various elements and monitoring variables affecting it, without focusing on its spatial distributions and disparities within cities - to build revealing maps to measure disparities that raise the efficiency of planning and making urban development policies. This study aims to fill the current research gap by improving monitoring and measurement processes and developing flexible building model multidimensional. Therefore, research is related to how to formulate a methodological model for measuring urban poverty and deprivation stemming from a multiplicity of theoretical and applied approaches, diagnosis of objectives and indicators affecting it. The results showed novelty of this research is to reach development of a methodological model to control measurement and raise the efficiency of analysis and identification spatial distribution and hotspots in inner city to enhance efficiency of planning and sustainable urban development policies.
indicators, multidimensional poverty measurement, planning, poverty line, sustainable urban development, spatial distribution, urban poverty and deprivation, urban development policies
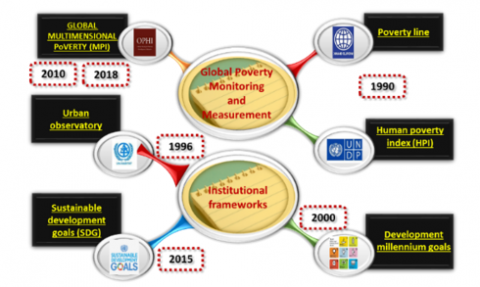
The problem of urban poverty and deprivation (UPD) has become a growing global concern. In 1990, World Development Report - issued by World Bank - focused heavily on the issue of poverty due to severity increasing of the problem and its various socio-economic repercussions. In the same context, the United Nations was concerned with the same problem in 1996 by declaring it the Year for the Eradication of Poverty, and this goal has become at the heart of global development agenda, and it has been of particular importance since the Millennium Development Goals were announced in 2000, and a quantitative target was set to reduce poverty in the world by half by 2015 [1]. Finally, the United Nations emphasized For Sustainable Development goals (2015-2030) At the beginning of 2016, the importance of social protection for the poor and the social dimension strategy as a condition for sustainable development as an ambitious step aimed at eliminating poverty and deprivation and living in dignity by 2030. Since then, the Arab countries have begun to develop their own visions of integrating them into the national and regional plans necessary to achieve Goal (1) of SDG related to poverty and to eradicate it in its various dimensions in their plans for the year 2030 [2].
As a result of the global economic shocks in recent years, poverty is widespread in urban city where the limited resources and hazards of the COVID-19 At the global level, that become a real challenge to the United Nations Sustainable Development Goal (Goal 1) of ending poverty by 2030 because of the increase in the relative and absolute size of the number of poor. in addition, The effects of the Covid 19 epidemic on urban well-being through the serious impact of non-monetary dimensions and indicators on densely populated cities [3].
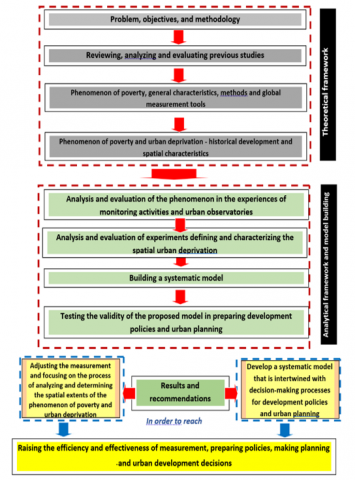
The study followed a set of scientific approaches during its stages to reach the results, (first: inductive approach, to examine the characteristics and dimensions of phenomenon and its historical and justifications, second: descriptive analytical approach, to review methods and tools for measuring phenomenon and its spatial dimensions and volunteer them in preparing urban development policies through case-experiments urban observatories and measurement initiatives for the phenomenon in the Arab world, third: comparative analysis approach, to contrast what was reached in the theoretical and applied framework to determine points of agreement and difference between them in order to reach a methodological model for measurement problem of urban poverty and deprivation).
The general framework of the study was based on the outputs of the successive topics, which included:
1. Reviewing previous studies and research in the field of study.
2. Reviewing the phenomenon of urban poverty and deprivation ... its origins, development and measurement tools.
3. Evaluate the monitoring and measurement of urban poverty and deprivation in the activities and processes of urban monitoring.
4. Analyzing and evaluating experiences of identifying and characterizing spatial scales of urban poverty and deprivation.
5. Building and testing a methodological model to raise the efficiency of monitoring methods and processes to support decision-making.
Despite a proliferation of academic contributions about urban poverty indexes, this concept raises some issues:
This study proposes a methodology to provide an evidence based index - the Multidimensional urban poverty and deprivation index- a new index consisting of various criteria that achieve the SDGs and intersect international programs and indicators for measuring poverty and urban deprivation. Even though the poverty dimensions are distinct, they are frequently combined to calculate the overall composite poverty of an urban cities and their spatial distribution.
The study highlights the development of methodological model for monitoring and measuring urban poverty and deprivation, and its spatial distributions that raise the efficiency of planning and making urban development policies for the urban regions to provide a more robust yet flexible tool that would have suitability for international. That would allow for the inclusion of broader criteria and require a more holistic approach that reflects current vulnerabilities and diverse challenges. It provides an evaluation system that is free from the prejudices of the decision maker and makes it simpler to determine management policies.
The study emphasizes Adjusting measurement and raising the efficiency of monitoring spatial distribution. To achieve better results for monitoring poverty and urban deprivation and decision-making for urban development policies. Additionally, linking planning and making sustainable urban development policies to the urban poverty and deprivation map in order to reach a distribution of development programs and projects.
Review previous studies of urban poverty and deprivation at the international, Arab, and local levels during the previous two decades was able to qualitatively classify them under three main axes:
First: Studies poverty and urban poverty and its dimensions.
Second: Studies measurement indicators and poverty geography (spatial distribution).
Third: Studies on decision-making and strategies to combat poverty.
Accordingly, this critical review of studies and research identified and highlighted knowledge gaps in need of further research effort, which are:
Table 1 shows the summary overall evaluation matrix of previous studies results in the three axes.
Table 1. Evaluation matrix of previous studies
|
Axes |
Evaluate Previous Studies |
|
Urban poverty and deprivation and its dimensions (their main features and various dimensions) - in a quantitative framework of the phenomenon and variables associated with it |
- Diversity of the characteristics and dimensions of the analysis of the phenomenon according to the spatial scope of the study, as the characteristics of poverty in the urban sector differ from the rural sector. - Poverty rates and urban poverty are affected by a set of variables that are linked with an inverse relationship or direct relationship. - Social, economic, urban and political variables are directly affected on urban and rural poverty. - Existence of overlaps between the economic and social factors that cause urban poverty. |
|
Measurement indicators and poverty geography (spatial distribution) |
- Many trends in definition of poverty, which makes it difficult to reach a specific definition of poverty. - Limited studies to determine geographical targeting of poverty within cities. - Multiple indicators of poverty and deprivation according to the study objectives and the factors that contributed to the growth of the phenomenon. - There is no unified model for measuring traits and characteristics. urban poverty. - Overemphasis of studies on poverty line determination of the family's and individual's basic needs is changing from time to time. |
|
Decision making and anti-poverty strategies |
- Adopting short, medium or long term policies to help reduce poverty and deprivation. - Weak evaluation of the effectiveness of policies directed at combating poverty, and consequently weak feedback for policy correction or development. |
Additionally, several previous studies have developed many concepts, terminology, and definitions to describe and clarify the different dimensions of urban poverty and deprivation, as shown in Table 2 and a large diversity of scholars and institutions ways to measure their indicators.
As a result, it is clear from this analytical review of urban poverty explanatory theories that poverty is not only a monetary phenomenon, but a phenomenon intertwined with a wide range of resource deprivation (food and non-food ingredient). As a social phenomenon associated with inability to provide basic needs for well-being, such as nutrition, health, education, housing… etc., this vision will contribute to identifying dimensions and indicators that are closely related to the target methodological model.
Therefore, in this paper, we accept the definition that urban poverty and deprivation is "a multidimensional phenomenon of deprivation, which combines income poverty and its interaction with other social, economic, urban, political and cultural dimensions and indicators, based on the spatial distribution of the phenomenon and the analysis of poverty, vulnerability and social disparities." The characteristics of spatial areas of urban poverty and deprivation can be identified in the following:
Table 2. Urban poverty and deprivation definitions in time series
|
Year |
Source |
Definition |
|
1990 |
World bank [4] |
Inability to achieve a minimum standard of living. |
|
1995 |
United nations [5] |
Lack of material income and sufficient income-generating resources to ensure the satisfaction of basic needs, deprivation of basic services such as health and education, lack of access to clean water sources and adequate housing, in addition to non-participation in decision-making in civil and political life. |
|
1998 |
UNDP [6] |
Loss of basic human needs. |
|
2002 |
UNDP [7] |
It is the inability of people to possess the human capabilities necessary to ensure the entitlements of human well-being in a social entity, be it a person, a family, or a local community. |
|
2003 |
ESCWA [8] |
A state of deprivation of economic, social and human benefits or pillars. |
|
2008 |
UNDP [9] |
A minimum standard of living is considered among the poor who cannot meet their basic needs, and it is estimated on the basis of the concept of income or consumer spending. |
|
2017 |
ESCWA [10] |
Inability to enjoy basic rights and fundamental freedoms, and that the deprivation of ability represents a more complete measure of poverty than the measure of income. |
Source: Researcher, 2021
Figure 1 shows different dimensions of poverty and their interactions between income and inability to achieve a standard of living.
Figure 1. Different dimensions of poverty
The research problem is related to insufficiency relative of methodologies and processes for monitoring and measuring of urban poverty and deprivation phenomenon, basically about monitoring, and analyzing the spatial distributions and disparities of phenomenon, and the efficiency of its use in making development policies and urban planning.
In the same context, the critical vision of previous studies and current monitoring and measurement indicates that there is a great potential to raise efficiency of monitoring and measurement processes through developing a methodological model focuses on a deep understanding of spatial dimensions, which can contribute to achieving better interaction and intertwining with preparation of urban development decision-making processes concerned with reducing urban poverty based on multidimensional analysis of spatial characteristics of the phenomenon.
The problem of urban poverty and deprivation includes many sub-problems, as shown in Figure 2.
Figure 2. Research problem and its intertwined dimensions
Source: Researcher, 2021
This research is focused on "developing a methodology for monitoring and measuring the phenomenon of UPD, based on an integrated multi-dimensional vision, with the aim of raising the efficiency of process of analyzing and determining the spatial ranges of phenomenon within cities in a way that supports efficiency of the processes of making and implementing urban development policies."
Therefore, research followed four practical steps to achieve objectives, namely:
From the discussion of previous literature, the phenomenon of urban poverty and deprivation requires an appropriate methodology or framework to design a new model to reformulate the various components was designed through a set of steps to derive a result, as shown in Figure 3.
Figure 3. Framework of methodology research structure
Source: Researcher, 2021
3.1 Study area
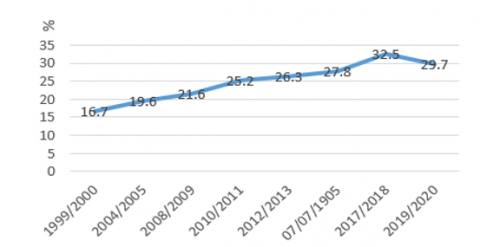
Egypt is the third most populous country in Africa and the most inhabited in the Middle East. It also has a population of 114 million in 2022. Despite being classified as a middle-income country, The poverty rate has increased from 16.7% in 1999 / 2000 to 21.6% in 2008 / 2009 and 27.8% in 2015, reached its highest rate in 2017 / 2018 (32.5%), then fell by 2.8% during the fiscal year of 2019 / 2020, recording 29.7 percent. About a third of Egypt's population was considered poor [11], as shown in Figure 4.
Accordingly, the result of national poverty measurement estimates for Egypt also showed in urban governorates witnessed the highest increase in 2017 / 2018, and Egypt recorded for four decades (1980-2017) an increase in the urban poverty rate from (18.2%-24.5%), as Cairo governorate jumped from the sixth rank, with an increase of 13% in terms of urban poverty, to the thirteenth rank [12]. as shown in Figure 5.
Figure 4. Egypt poverty rate according national poverty line from (1999 / 2000-2019 / 2020)%
Source: CAPMAS, 2020
Figure 5. Egypt Urban poverty rate according to national poverty measurement (1981-2017)
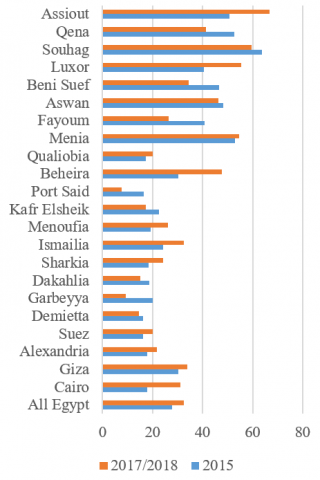
The situation is obviously different for governorates. To overview the unified poverty rates and changes across regions, we compare their poverty incidence across governorates depending on the 2015 and 2017 / 2018. Figure 6 shows that about 15 out of 27 governorates have experienced an increase in poverty rates while poverty rates have decreased in the rest. Where urban governorates experienced a high rise in poverty rates between 2015 and 2018; for example, Cairo and Alexandria governorates [13].
Figure 6. Poverty evolution rate according to national poverty line in Egypt Governorates
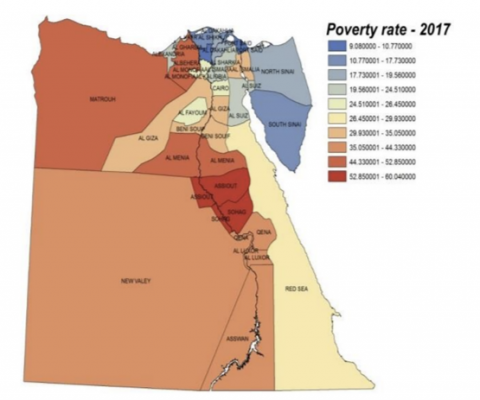
Additionally, there is no spatial distribution of poverty at urban level sector (critical areas within cities) in Egypt, as the unit of measurement is usually urban / Rural agglomerations or governorates or administrative boundary, as shown in Figure 7 [14].
Figure 7. Poverty maps across of Egypt's governorates 2017
Source: Maps created using ArcMap based on Poverty Map data, CAPMAS (2018)
3.2 Different dimensions of the phenomenon
Urban poverty is characterized by cumulative deprivation - that is, one dimension of poverty is often the cause or contributor to another dimension, and on the other hand urban poverty and deprivation can be temporary or permanent as it is considered a dynamic situation and is not necessarily an indicator of economic failure, And the different dimensions of multidimensional poverty can be summarized through intertwining and interaction, as shown in Table 3 [15].
3.3 Data collection
There are many emerging best practices and methods for measuring urban poverty and deprivation designed in order to improve their policies and develop programs targeting this social group. So, the various practices and methods of these organizations have been reviewed, analyzed and evaluated to using the results and lessons learned in building and developing the proposed methodological model, as shown in Table 4 and Figure 8.
Table 3. Dimensions of multidimensional poverty
|
Dimensions |
Characteristics (Features) |
|
Economic |
Inability to provide living expenses for consumption, ownership and purchase of goods, access to nutrition, security, quality of life |
|
Humanity “human development” |
Includes: health, education, food security and provision of facilities and shelter (weak capacity) |
|
Political |
Absence of human rights, the right to be heard, has some effect on public policies and political priorities, denial of basic freedoms or human rights, which is one of the main aspects of poverty |
|
Cultural and social |
Inability to participate as an important member of society, these abilities must be traced back to social status, dignity and other cultural conditions to integrate into a society that is highly valued by the poor |
|
Fragility and vulnerability "preventive" |
Absence of the ability to resist economic and external crises and the susceptibility to large losses in case of crises |
|
Urban |
Absence of ability to secure minimum shelter, infrastructure facilities, and basic services associated with housing |
Source: Deniz Baharoglu and Christine Kessides; urban poverty, chapter16
Figure 8. Global poverty monitoring and measurement methods
Source: Researcher, 2021
Table 4. Practice for measuring PUD components
|
Program |
Year |
Host |
Objectives |
Focal Points |
Indicators |
Advantages |
Defects |
|
Human development indicators |
1990 |
United Nations Development Programme - UNDP |
Empowering people rather than marginalizing them, expanding their choices and opportunities |
Human Poverty Index -Demographic trends -Health -Knowledge acquisition (education) -Economic development -Women's empowerment Security and Justice |
A set of indicators in different sectors A multidimensional poverty index was developed Includes 10 indicators and three dimensions in 2010 |
- Easy quantitative indicator - Can be used to detect rural and urban poverty -Can be modified for heterogeneity |
- One dimension - Ignore other dimensions of poverty |
|
Center for Social Deprivation Research |
1991 |
Scottish Government |
Development of a multi-deprivation index in geographical areas |
Consists of 7 dimensions. -Employment and income - Health -Education Access to services- Crime- -Housing |
(14) indicators |
- Can be used to detect poverty in geographical areas - Decompose deprivation patterns and spatial dimensions |
- Limited number of indicators - Standardization of indicators' relative weights |
|
Program |
Year |
Host |
Objectives |
Focal Points |
Indicators |
Advantages |
Defects |
|
Urban indicators [16] |
1996 |
United Nations Human Settlements Programme UN- Habitat |
Establishing sustainable urban surveillance systems to support local planning and management processes Linking policies or monitoring urban conditions and forms |
-General background -Social and economic development -Environment Management -Structure Greeting -Transport and Communications -Localities -Housing |
(46) Core Indicators (124) comprehensive indicators It was developed in 2001 to reach 23 basic indicators. and 9 qualitative indicators |
- Easy quantitative indicator - Multiple indicators associated with poverty characteristics - Can be used to detect poverty in geographical areas |
-There are many trends in his account |
|
Measuring poverty in the 2015 Millennium Development [17] |
2000 |
United Nations and approved by the Member States |
Monitoring activities for progress towards a comprehensive vision of development, peace and human rights through specific core values ... necessary for international relations in the twenty-first century |
Consists of eight targets 21 targets to measure progress in achieving. The target first ciliary point is the eradication of extreme poverty and hunger |
There are 60 indicators that include the first objective. (9) Indicators related to measuring poverty |
- Applicable across administrative borders and different regions - Quantitative indicator is easy to calculate Include the physical dimension (Income) |
- It does not take into account the different dimensions of poverty measurement - Weak geographical targeting within cities |
|
Multidimensional poverty index MPI [18] |
2010 |
United Nations Human Settlements Program |
Develop a guide to the dimensions of poverty to identify the state of poverty in a particular society |
Based on three main dimensions: -Education -Health -Standard of living |
10 indicators |
comprehensive -quantitative -Applicable across different regions Provides more reliable information on poverty - Possibility to add indicators and more dimensions |
- Ignore the physical dimension (income) - The characteristics of poverty in urban areas are not taken into account - Limited number of dimensions and pointers - Standardization of the relative weights of the indices |
|
Multidimensional deprivation evidence MUDI [19] |
2010 |
ALkire and Santos |
A guide to measuring household deprivation in various dimensions |
Consists of Five dimensions: -Economy -Environmental hazards -Standard of living -Financial access - Social segmentation |
10 indicators |
-comprehensive -quantitative - Applicable across different geographic regions -Focusing on the Diverse Dimensions of Deprivation |
- Standardization of the relative weights of the dimensions according to the number of indicators - Limited number of indicators - Ignoring the human development aspect (health and education) |
|
Indicators for measuring poverty in the 2030 sustainability goals – SDG [20] |
2015 |
United Nations and approved by the Member States |
A global call to action to end poverty, protect the planet and ensure that all people enjoy peace and prosperity integration of evidence between the target 1 and target 11 of the sustainability goals to help cities measure urban deprivation |
Based on 17 is targets, and represents the main targets (1): to eradicate poverty |
There are 232 indicators, including target (1): (12) indicators |
-quantitative - Applicable across different geographies |
Limited number of target indicators (1) |
|
Urban deprivation guide UDI [21] |
2016 |
ESCWA |
integration of evidence between the target 1 and target 11 of the sustainability goals to help cities measure urban deprivation |
Consists of four dimensions: - Economy -Housing and Infrastructure -Education - Health |
(12) indicators |
- Quantitative -Applicable across different regions Provides reliable information about poverty |
- Unification of the relative weights of the dimensions according to the dimension - Limited number of indicators |
|
Regional multidimensional poverty indicators [22] |
2018 |
ESCWA, UNICEF and the Oxford Poverty and Human Development Initiative |
Helping cities measure and analyze multidimensional poverty |
Consists of three dimensions: -Education -Health -Standard of living |
(12) indicators |
-Comprehensive -Quantitative - Applicable across different regions - Provides more reliable information about poverty |
- It does not differentiate between rural and urban poverty - Ignoring the material dimension - income - Do not take into account characteristics of poverty in urban areas, such as economic housing, social security, and access to finance |
Data source: The researcher (World Bank group, 2018) (UNDP&OPHI, 2019) (UNCHS-Habitat, 1996 (United Nations Development Program), 2018 (Economic and Social Commission for Western Asia 2017), (Heba El-Leithy, 2009))
The results of previous analysis and evaluation indicate that efficiency and effectiveness of monitoring and measurement processes of the phenomenon are mainly related to dealing with all the variables and the factors that make up them and their various overlaps and entanglements. In this context, the most important features can be observed as follows:
1- Absence of a governing monitoring system.
2- Multiplicity of global systems and initiatives to measure urban poverty and deprivation and link between indicators.
3- Multiplicity of concepts and the absence of a unified and precise concept.
4- Different methods of measurement from one society to another, and within the same society from time to time.
5- Adopting the concept of multi-dimensional poverty and deprivation to raise the efficiency of policymaking, development and urban planning.
6- Analyzing systems of variables, their interrelationships, and their relative weights in terms of their impact on the phenomenon.
3.4 Dimensions, indicators and methods of measurement
In this context, Study used activities and operations of urban monitoring in urban observatories and specialized studies of the phenomenon in some Arab countries to prove the validity of this model - (10) selected cities about 45% of the total countries of the Arab world distributed geographically, where five countries are located in the African continent and five countries in the Asian continent - as inference to selected experiments to extract dimensions, indicators, and measurement methods by imposing the employment of results and lessons learned in building and development of proposed methodological model, in steps as shown in Figure 9.
Figure 9. Criteria using in modle building
According to the case study and comparative analysis of the experiences of monitoring activities in local initiatives or urban observatories in the Arab world, it was found that there is a set of dimensions that amounted to (12 dimensions) and (73 indicators) related to indicators differ due to goals of their design, The dominant and most frequent dimensions reached (8 dimensions), while the frequency indicators reached (30 indicators), as shown in Table 5.
Table 5. Dimensions and indicators used
|
Dimensions |
Jordan |
Oman [23] |
Mauritania [24] |
Tunisia [24] |
Lebanon [25] |
Sudan [26, 27] |
Saudi Arabia [28, 29] |
Egypt [30, 31] |
Iraq [32] |
Frequency Ratio |
|
Education |
√ |
√ |
√ |
√ |
√ |
√ |
√ |
√ |
√ |
100 |
|
Health and nutrition |
√ |
√ |
|
|
√ |
|
√ |
√ |
√ |
70 |
|
Housing |
√ |
√ |
√ |
√ |
√ |
|
√ |
√ |
√ |
90 |
|
Living environment |
√ |
√ |
√ |
√ |
√ |
√ |
√ |
√ |
√ |
100 |
|
Assets |
√ |
√ |
√ |
√ |
√ |
√ |
|
|
√ |
80 |
|
Economic /Employment |
|
√ |
√ |
√ |
√ |
√ |
√ |
√ |
|
60 |
|
Communication and networking |
|
√ |
√ |
√ |
√ |
|
√ |
|
|
60 |
|
Entertainment |
|
|
√ |
√ |
√ |
|
√ |
|
|
30 |
|
Environmental quality |
|
|
|
|
|
|
√ |
√ |
|
20 |
|
Social services |
|
|
|
|
|
|
√ |
√ |
|
30 |
|
Political participation |
|
|
|
|
|
|
√ |
√ |
|
30 |
|
No. of indicators |
17 |
10 |
14 |
10 |
18 |
10 |
31 |
27 |
17 |
73 |
|
No. of dimensions |
5 |
7 |
7 |
7 |
8 |
4 |
12 |
9 |
5 |
12 |
Source: Researcher, 2021
3.5 Lessons learned as guides for this model
A set of features and principles that contribute to development of a model for measuring urban poverty and deprivation can be identified as:
At Spatial Level:
- Accommodating a standardized monitoring system and measurement method that can be applied efficiently and valid for all countries in analyzing and determining spatial scopes of urban poverty and deprivation.
- Focusing monitoring of poverty spots at the urban level to increase the efficiency and effectiveness of the interventions.
- Relationship of influences to the methodological model with its efficiency in monitoring at the level of micro spatial units within cities.
Additionally, to identify prevalence in urban areas, and the degree of differences between urban neighborhoods, through:
1- Determining the scale of the phenomenon at the level of the city as a whole and its characteristics.
2- Determining the spatial scopes and accurate spatial distribution of the phenomenon.
3- Determining boundaries and characteristics of the regions and their variation and degrees of variation.
4- Determining the policies of the interventions according to the characteristics of the regions to raise the efficiency of decision-making in the face of the growing phenomenon of urban poverty and deprivation.
5- Raising the efficiency of directing and focusing programs related to urban poverty and deprivation from critical areas.
6- Building a proposed methodological model to raise the efficiency of measurement and spatial monitoring processes.
At Dimensions, Indicators, and methods of Measurement Level:
-Poverty cannot be measured using a one-dimensional context only in monetary terms. Poverty is a complex and multi-dimensional phenomenon that arises from the interaction of economic, political, and social processes.
-Absence of a unified monitoring system and a governing framework capable of measuring poverty and urban deprivation.
-Multiplicity of monitoring indicators used for measurement due to differences in its objectives to determining dimensions and indicators used and their relative weights.
-Different measuring methodology of urban poverty and deprivation based on the availability of data in monitoring and measurement process.
-Measures of urban poverty and deprivation resorted to personal control in their design and change of results.
-Designing a flexible model that needs to develop monetary and non-monetary dimensions and indicators related to the measurement of urban poverty and deprivation.
-Agreement of some indicators between different practice represents the basic building for the future standardized monitoring system.
-Dependence of some experiments on complementary monitoring indicators, which differ from one study to another within each dimension, such as disappearance of indicators of standard of living in the European Union program to reach full coverage and its inability to find discrepancies.
3.6 Theoretical and analytical study overlaps and links
After what was presented and discussed on the methodological steps outlined in the previous section. Through of monitoring, analysis and evaluation of many lessons learned, and importance of integrating measurement of poverty and urban deprivation as an interconnected and integrated system to build and develop a methodological model for measuring and monitoring the phenomenon of poverty and urban deprivation in order to analysis of variances and determining spatial zones as a basic issue within the city.
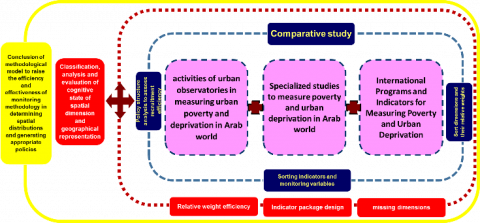
Figure 10. Theoretical and analytical study overlaps and links
Source: Researcher, 2022
Figure 10 show the impact of theoretical and analytical study overlaps and links to extract the methodological model with high flexibility and applicable to measure and monitor the phenomenon of poverty and urban deprivation in various and multiple cases.
As a result of the collection and analysis of urban poverty and deprivation, Designing the integrated framework done for monitoring and measurement in the framework of sequence of objectives of the methodological model within the following requirements and characteristics:
4.1 Designing the integrated framework for monitoring and measurement.
Figure 11 shows the technical steps for building proposed methodological model, and Table 6 results of the proposed framework for monitoring and measuring urban poverty and deprivation indicators where the measurement model was divided into (6) main dimensions consisting of (22) sub-dimensions and (67) indicators.
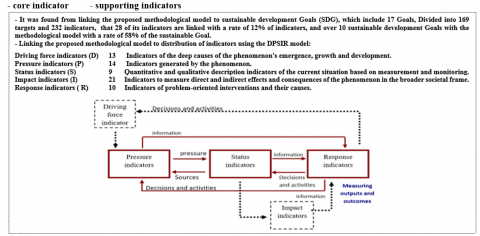
The indicators were also classified into two groups. Core indicators are a set of repeated indicators that have been selected from studies and experiments, which have proven their efficiency in expressing the previous phenomenon. As for the supporting indicators, they are a set of supporting indicators for standard methodological model from the inputs of the experiments of various monitoring activities, according to the study area.
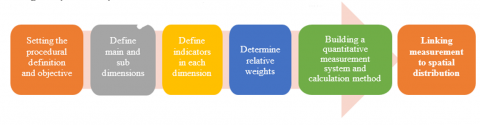
Figure 11. Technical steps to build up model
Table 6. Comprehensive framework for monitoring
|
Link Program |
DPSIR |
Indications |
Sub Dimensions |
Main Dimensions |
||
|
Local Monitoring |
Global Program |
SDG |
||||
|
√ |
|
D |
Household income distribution rate. |
Income |
Economic |
|
|
√ |
|
SDG1 |
S |
Poor households below national poverty line |
||
|
√ |
|
S |
Poor families below the poverty line 1.9 3.2 dollars per day. |
|||
|
√ |
√ |
SDG1 |
P |
Share family expenses. |
||
|
√ |
√ |
SDG1 |
P |
Lowest 10% consumption share for highest 10% of population. |
||
|
√ |
|
SDG10 |
P |
Average per capita family income. |
||
|
√ |
|
SDG8 |
S |
Percentage of informal employment. |
Employment |
|
|
√ |
√ |
SDG8 |
S |
Unemployment rate. |
||
|
√ |
|
SDG8 |
D |
Child labor. |
||
|
√ |
√ |
|
R |
Percentage of population receiving credit. Percentage of families with a bank account. |
Credit |
|
|
√ |
√ |
SDG8 |
R |
|||
|
√ |
√ |
|
R |
Car ownership rate for families Average house price to income (m2) |
Assets and Savings |
|
|
√ |
|
|
I |
|||
|
√ |
√ |
SDG3 |
D |
Percentage of coverage of health insurance services. |
Health |
Humanity "human development" |
|
√ |
|
|
R |
Share family expenses on health. |
||
|
√ |
√ |
SDG3 |
I |
Child mortality rate (infants and under five ( |
||
|
√ |
√ |
SDG3 |
I |
Mortality rate from infectious diseases (malaria, respiratory system, etc. |
||
|
√ |
|
SDG3 |
I |
Maternal mortality rate. |
||
|
√ |
|
|
I |
Disability rate. |
||
|
√ |
√ |
SDG3 |
D |
Births under medical staff |
||
|
√ |
√ |
SDG4 |
I |
Enrollment rate in pre-university education (primary, preparatory, secondary) |
Education |
|
|
√ |
√ |
|
I |
Study years. |
||
|
√ |
√ |
|
S |
Adult illiteracy rate (male/female ( |
||
|
√ |
√ |
SDG3 |
I |
Continuing education |
||
|
√ |
√ |
|
P |
Percentage of holders of a university degree. |
||
|
√ |
|
|
R |
Share family's expenditures on education. |
||
|
√ |
|
|
D |
Registration in kinder garden programs. |
||
|
√ |
√ |
SDG2 |
P |
Average per capita calorie intake. |
Nutrition |
|
|
√ |
|
SDG2 |
I |
Percentage of underweight children underfive ages. |
||
|
√ |
|
|
D |
Average family size |
Demographics |
Social and Cultural |
|
√ |
|
|
D |
Percentage of households headed by a woman. |
||
|
√ |
|
|
I |
Dependency rate. |
||
|
√ |
|
|
P |
Population density. |
||
|
√ |
√ |
SDG1 |
R |
Percentage of families covered by social security. |
Social Unity |
|
|
√ |
|
|
D |
Divorce rate. |
||
|
√ |
|
|
P |
First age of females at marriage. |
||
|
√ |
|
|
D |
Percentage of participation in elections of those aged 18 years and over. |
Participation and Empowerment |
|
|
√ |
|
SDG16 |
I |
Percentage of families participating in social organizations |
||
|
√ |
|
|
R |
Citizen satisfaction with services |
||
Source: Researcher, 2022
4.2 Steps to analyze the spatial distribution of phenomenon and variations at the level of micro-spatial units
This part means explaining how measurement is designed at the level of micro-spatial units within cities by explaining the methodology for calculating the localization of the degree of phenomenon and then identifying the areas of hot spots, analyzing the spatial variations, and trying to interpret them through their association with many different economic, social and urban variables, Measurement design steps at the level of small spatial units include the following:
1. Determination of the variables for which data are available at the level of micro units and calculation of the value of each indicator according to the method of calculation adopted and internationally recognized.
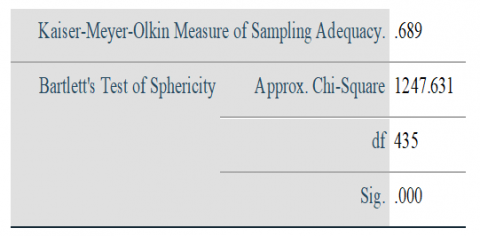
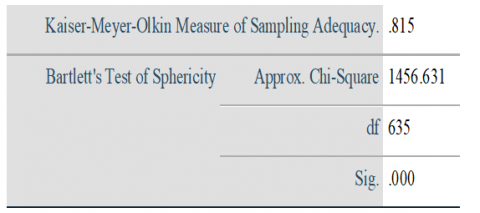
2. Introduction of statistical data on indicators to the SPSS statistical analysis programme.
3. Preparing matrix of correlation between all variables (produced indicators) (Correlation coefficients Matrix) and calculation of correlations between indicators, the purpose of which is to determine the strength and direction of the relationship between indicators from all dimensions in accordance with the dimension of urban poverty and deprivation
4. Factor analysis procedure to summarize and deploy the range of influential variables with higher linkages to key and sub-dimensional indicators.
5. Arranging saturations on factors according to the degree of prevalence and effect of the variable for other variables while excluding saturations below 30% and selecting the first main component of valuation factors (latent root - greater than one true) which represents the highest value for variation before and after the rotation, Preparing prevalence table by analysis of the first main component to show the relative weight of each indicator according to the extent of its impact on the rest of the indicators and weakness of the values lost.
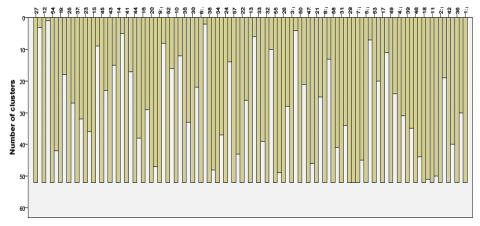
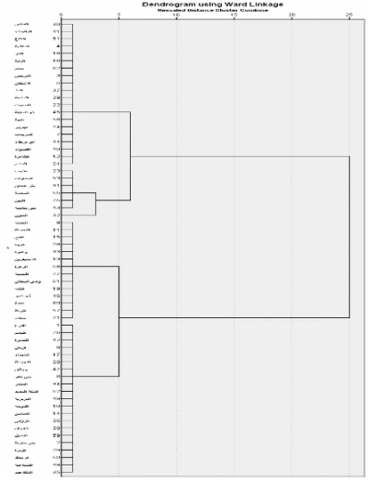
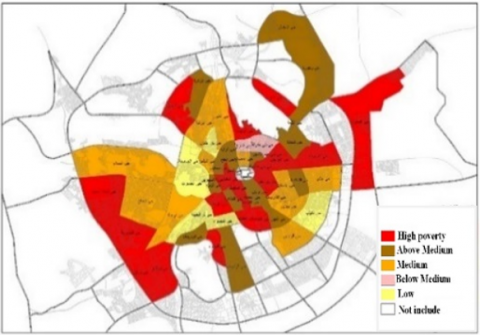
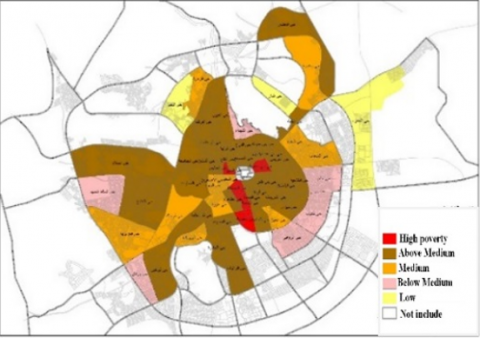
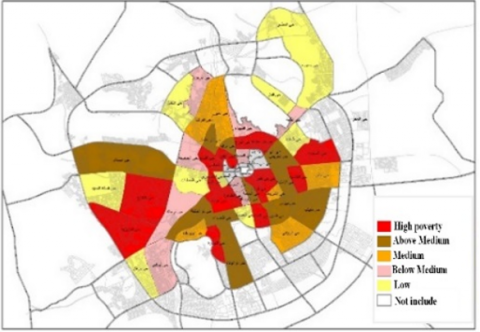
6. Preparing the cluster analysis, which is a grouping of groups, each of which includes a number of (neighborhoods) cases, which are characterized by a strong correlation (similarity) among them. by using (K-means cluster analysis), which is used to classify the neighborhoods according to the degree of their homogeneity with the indicators produced from the correlation matrix that is denied by the factor analysis and classify them into (5) levels representing “low poverty and deprivation”, “below average”, “medium”, “above Average", "high" in three stages, as shown in Figure 12. GIS program was used to process the geographical representation of the results of the aggregate analysis.
Figure 12. Spatial distribution of urban poverty on (5) levels
First stage: grouping homogeneous spatial domains with each other into clusters to classify them using k flat means for all the indicators specified before preparing the factor analysis as well as for the basic indicators in addition to the effect of these indicators on the interrelationships of the DPSIR model, whether for the basic indicators or the supplementary indicators (Map 1).
Second stage: grouping homogeneous spatial domains together into clusters to classify them using k flat means for the indicators selected after preparing factor analysis (Map 2).
Third stage: grouping homogeneous spatial domains together into clusters to classify them using k flat means for the indicators selected after preparing the factor analysis, distributing each dimension to one of the main dimensions of the methodological model (Map 3).
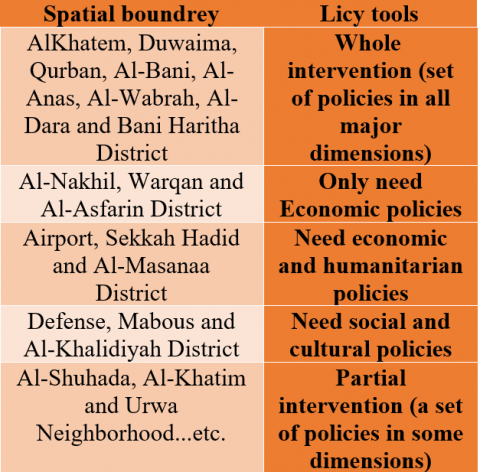
7- Formulating policies to confront the phenomenon of poverty and deprivation, development and urban planning within the framework of the variations in the dimensions affecting the state of urban poverty in each neighborhood, according to the indicative, as shown in Table 7.
Table 7. Indicative model for linking spatial disparities with policy formulation
|
Spatial Ranges |
Classification of Neighborhoods According to the Main Dimensions of Methodological Model |
Determine the Most Appropriate Combination of Policy Tools |
||||||
|
economic |
Humanitarian |
social and cultural |
urban |
politics and security |
urban environment |
|
||
|
Domain/District 1 |
√ |
√ |
√ |
√ |
√ |
√ |
Total interference |
|
|
District 2 |
√ |
√ |
|
√ |
|
|
Partial interference |
|
|
District 3 |
|
√ |
|
√ |
|
|
Partial interference |
|
|
District 5 |
|
√ |
√ |
|
|
|
Social intervention and human development |
|
|
District 6 |
√ |
|
|
|
|
|
Economic intervention |
|
|
District... |
|
|
|
|
|
|
|
|
In this context, the design of intervention policies, programs and projects is basically linked and intertwined with the qualitative characteristics that are monitored at every spatial scale.
Accordingly, Monitoring and measurement efficiency and their role in policymaking and guiding urban development needs,
- Identifying the most appropriate combination of policy instruments according to the different dimensions of the problem of urban poverty and deprivation in all spheres from the clear diagnosis of the situation of each sphere.
- Absence of human intervention in determining the relative importance of indicators and their impact on spatial scoping.
- Focus of the model on preparing urban poverty and deprivation maps that constitutes a kind of guidance and pressure on decision-making and policies.
- Dependence on the data of the SPSS statistical analysis programme to determine the cluster analysis fully according to the variables introduced and their geographical representation in GIS.
4.3 Model test
The testing process aims to measure the efficiency of methodological model in comparison with results of traditional monitoring systems in Madinah city (KSA) as case study for years 2010 and 2017 due to Unique studies that dealt with a classification of neighborhoods by socio-economic and urban characteristics, linking to activities of urban observatories, which are currently spread in a number of cities, and Availability of data to verify results for a number of monitoring cycles. Through:
- Overcoming the errors and shortcomings of previous problems.
- Verifying the effectiveness of the model in analyzing and determining the spatial distributions and variances within cities
- Effectiveness of employing the model within the broader framework of development policy-making and urban planning.
Table 8 shows a comparative study and evaluation of Madinah city for the years 2010 and 2017, using the steps of measurement design at the level of the smallest spatial units and monitoring the differences, variances and interconnected relationships on the one hand by analyzing the spatial discrepancies and trying to explain them, and on the other hand employing the results of monitoring in policy making by emphasizing the linkage and interaction of measurement with the objectives and their use within the framework of the DPSIR model.
Table 8. Comparative study and evaluation of Madinah city
|
Comparisons |
2010 |
2017 [33] |
|
Source |
Households survey data of socio-economic characteristics in 2010 at level of inhabited neighborhoods |
Households survey data of socio-economic characteristics in 2017 at level of inhabited neighborhoods |
|
Dimensions |
5 main dimensions and 15 sub-dimensions, and the main political and security dimension has been neglected |
5 main dimensions and 15 sub-dimensions, and the main political and security dimension has been neglected |
|
Number of indicators intersected with model |
29 indicators representing 45% of the total number of indicators in the model. |
33 indicators representing 50% of the total number of indicators in the model. |
|
Accuracy and representation of the data analysis |
||
|
Number of indicators in first component of factor analysis |
The first component was chosen to express poverty and urban deprivation, as there is the highest value of variance before and after the rotation (11 indicators) |
The first component was chosen to express poverty and urban deprivation, as there is the highest value of variance before and after the rotation (14 indicators) |
|
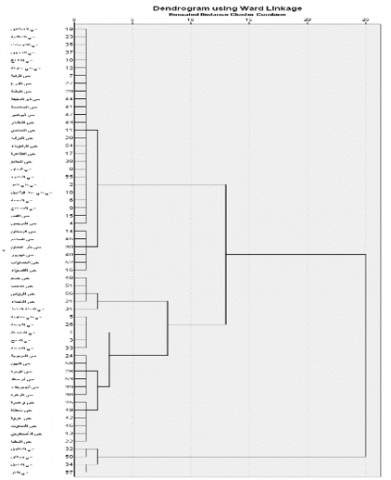
Cluster analysis “ Dendrogam Tree” According indicators intersected 2010 |
||
|
Cluster analysis “ Dendrogam Tree” According to first component indicators 2010 |
||
|
Cluster analysis “ Dendrogam Tree” According indicators intersected 2017 |
||
|
Cluster analysis “Dendrogam Tree” According to first component indicators 2017 |
||
|
Spatial distrubution by using Gis In 2010 According to 29 indicator |
||
|
Spatial distrubution by using Gis In 2010 According to cluster analysis 11 indicator |
||
|
Spatial distrubution by using Gis In 2017 According to 33 indicator |
||
|
Spatial distrubution by using Gis In 2017 According to cluster analysis 14 indicator |
||
|
Proposed Policy Tools |
||
TEST ASSESSMENT
This study contributes to develop an integrated connected system to monitor and measure the urban poverty and deprivation and employ it in policy making and formulation of programs and projects that target effective dealing with the phenomenon (monitoring and measurement efficiency / spatial distribution/ decision support - to achieve its objectives), and the preparation was launched with two main pillars, first: study of the theoretical framework and case studies, and second is to build and validate the proposed methodological model (Model Building and testing) Through test on the case of the study in Madinah city to be used in decision-making support.
Therefore, the significance of this model comes in:
• Provide maps of urban poverty and deprivation and their role in pressure on decision-making.
• Providing ways and mechanisms to assist decision-makers in follow-up and evaluation processes.
• Improve the formulation of more effective urban policies in cities.
• Understand how social and economic system works in cities and use this knowledge to increase the effectiveness of national and local plans and strategies.
• Comparative analysis of information (indicators) over any spatial and temporal extent at any time.
The most important results can be formulated as follows:
First: The phenomenon of urban poverty and deprivation is characterized by its complexity as a result of the multiplicity of different variables that make up the phenomenon and affect it, which are linked to it sometimes as a cause and at other times as a result of it, which in turn are affected by the interaction of economic, social, developmental, interfacial and political factors in society as the basic foundation for sustainable development and the reflection of all of this in the end on Urban poverty and deprivation.
Second: Controlling the making of urban development and planning policies related to urban poverty and deprivation through disciplined building model that produces an objective picture of situation within cities and analysis of spatial disparities in them helps to raise efficiency of decision-making and policies and translating this spatial map into executive programs and projects related to policies, decisions, and executive tracks and update performance mechanisms through monitoring, verification, and evaluation cycles.
Third: The integrity, coherence and efficiency of the methodological model is based on accurate identification of the objectives, which are briefly represented in:
The proposed methodological model constitutes a flexible framework to a large extent in the selection and employment of indicators according to each case due to the variation of the desired goals and spatial analysis of the study on the following:
1- Covering many dimensions and developing a list of indicators used in monitoring and measurement by adding indicators that were absent in previous monitoring experiences.
2- Raising the efficiency of monitoring spatial distribution of urban poverty and deprivation.
3- Raising the efficiency of outputs to support decisions and formulate development policies and urban planning.
Despite the partial and macro findings of this study, the issue of poverty and urban deprivation remains a matter of controversy and debate in various academic and research bodies and international organizations...etc. This part is concerned with making recommendations on future research directions, as well as the possibilities of its development in terms of expansion in the context of application as follows:
1. Evaluation of the efficiency and effectiveness of the model, as the model is tested at the level of small spatial scales within cities in different situations and contexts by incorporating more future-related indicators to provide more accurate results when running the statistical analysis.
2. Measuring the efficiency and effectiveness of the model's outputs in developing specific and clear directions for preparing policies and plans for sustainable development and urban planning.
3. Developing the preparation of detailed maps (spatial distribution) of poverty and urban deprivation as inputs to urban planning processes that can be presented to planners and decision makers to help determine priorities for policy interventions by integrating the scale of poverty and urban deprivation with an assessment of the phenomenon of social vulnerability and resilience.
|
UPD |
Urban poverty and deprivation |
|
MDG |
Millennium Development Goals |
|
SDG |
Sustainable development Goals |
|
UNDP |
United nation development program |
|
ESCWA |
Local Nusselt number along the heat source |
| OPHI | Oxford Poverty & Human Development Initiative |
|
HPI |
Human poverty index |
|
MPI |
Multidimensional poverty indicator |
|
D |
Driving force |
|
P |
Pressure |
|
S |
state |
|
I |
Impact |
|
R |
Response |
|
GIS |
Geographic information systems |
|
KSA |
Kingdome of suadia arabia |
[1] Ahmed El-Sayed El-Naggar. (2005). Poverty in the Arab World, Publications of the Center for Political and Strategic Studies in Al-Ahram, Cairo.
[2] Economic and Social commission for Western Asia. (2016). Measuring Urban Poverty in the Arab Region: Localizing Global and National strategies. United Nation, New York.
[3] Sumner, A., Hoy, C., Ortiz-Juarez, E. (2020). Estimates of the Impact of COVID-19 on Global Poverty (No. 2020/43). WIDER working paper. United Nations University (UNU-WIDER).
https://doi.org/10.35188/UNU-WIDER/2020/800-9
[4] International Bank for Reconstruction and Development Poverty. (1990). World Development Report, translated by Al-Ahram Center for Translation and Publishing, Al-Ahram Foundation, Egypt.
[5] United Nations. (1995). The statement issued by the World Summit on Social Development in Copenhagen.
[6] United Nations Statistics Division. (2005). Poverty Statistics Handbook: Concepts, Methods and Uses for Policy Purposes, UNSD, New York.
[7] United Nations Development Program. (2002). Arab Human Development Report 2002, Regional Office for Arab States, p. 90.
[8] Economic and Social Commission for Western Asia. (2003). Poverty and Measurement Methods in the ESCWA Region: An Attempt to Build a Database for Poverty Indicators, United Nations, New York, p. 5.
[9] Adeeb Nehme. (2009). Multiplicity of Poverty and its Study Methods, a research paper at a meeting of experts of the United Nations Development Program on poverty measurement, Beirut.
[10] Economic and Social Commission for Western Asia. (2017). The Arab Report on Multidimensional Poverty, United Nations, New York, pp. 20-21, adapted.
[11] Badawy, M.M., Elmouety, E.A.A., Mahmoud, M.M. (2022). Assessing the multidimensional vulnerability of lagging regions: A case study of New Valley Governorate Egypt. International Journal of Sustainable Development and Planning, 17(6): 1873-1885. https://doi.org/10.18280/ijsdp.170622
[12] Central Agency for Public Mobilization and Statistics. (2018). The most important indicators of income, expenditure and consumption research, Egypt.
[13] Elshahawany, D.N., Elazhary, R.H. (2022). Government Spending and Regional Poverty Alleviation: Evidence from Egypt. Economic Research Forum (ERF).
[14] World Bank. (2020). Poverty & equity brief: Middle East & North Africa, Arab Republic of Egypt. https://www.worldbank.org/poverty.
[15] Urban Poverty. (2001). Deniz Baharoglu and Christine Kessides. Macroeconomic and sectoral approaches, 2: 123-159. https://www.intussen.info/OldSite/Documenten/Noord/Internationaal/WB/PRSP%20Sourcebook/11%20Urban%20poverty.pdf.
[16] UNCHS (UN-Habitat) (1995). Indicators Program, Monitoring Human settlements "Abridged survey", Nairobi.
[17] Economic and Social Commission for Western Asia -ESCWA. (2023). Methodologies for Assessing World Poverty, United Nationsو Beirut.
[18] World Bank. (2018). Poverty and Shared Prosperity 2018, Washington.
[19] Sulaiman, J., Azman, A., Khan, Z. (2014). Re-modeling urban poverty: A multidimensional approach. International Journal of Social Work and Human Services Practice, 2(2): 64-72.
[20] Mitchell, C., Nogales, R., Oldiges, C., Scharlin-Pettee, S., Sebidi, K., Vollmer, F., Oxford Poverty and Human Development Initiative. (2018). Global Multidimensional Poverty Index 2018: The most detailed picture to date of the world’s poorest people. University of Oxford, UK.
[21] Sarangi, N., Abu-Ismail, K., El-Laithy, H., Ramadan, R. (2015). Towards better measurement of poverty and inequality in Arab countries: A proposed pan-Arab multipurpose survey. ESCWA Working Paper. Beirut: ESCWA. https://www.unescwa.org/sites/default/files/pubs/pdf/better-measurement-poverty-inequality-arab-countries-english.pdf.
[22] UNDP, OPHI. (2019). Global multidimensional poverty index 2019- Illuminating inequalities, united nation, New York. https://ora.ox.ac.uk/objects/uuid:f0b62a48-e028-473a-9c86-44822ba46427.
[23] Ghani, M.I.A., Al-Awadi, T. (2014). Spatial Variation of Deprivation Levels in the Sultanate of Oman. Journal of Arts and Social Sciences, Sultan Qaboos University, Sultanate of Oman. http://doi.org/10.24200/jass.vol7iss1pp27-60
[24] Economic and Social Commission for Western Asia. (2015). Methodology for Measuring and Studying Urban Poverty in Tunisia and Nouakchott, in cooperation with the Arab Urban Development Institute, United Nations, Beirut, Lebanon.
[25] Economic and Social Commission for Western Asia "ESCWA". (2021). Integrating Geospatial and Statistical Information to Support Sustainable Development Goals Indicators, United Nations, Beirut, Lebanon.
[26] Economic and Social Commission for Western Asia "ESCWA". (2015). Methodology for Measuring and Studying Urban Poverty - Tripoli’s Case Study, United Nations, Beirut, Lebanon.
[27] Ballon, P., Duclos, J. (2015). Multidimensional Poverty in Sudan and South Sudan. OPHI Working Papers, NO. 93, University of Oxford.
[28] UN-Habitat. (2019). CPI PROFILE Al-Madinah Al-Munawarah. Ministry of Municipal and Rural Affairs, Kingdom of Saudi Arabia.
[29] Un-habitat. (2020). State of urban development in Al-Qassim “Key Statistics in 13 Urban Areas”. Qassim Urban Observatory, Kingdom of Saudi Arabia.
[30] Elshahawany, D.N., Elazhary, R.H. (2020). Government spending and regional poverty alleviation: Evidence from Egypt. Department of Economics, Faculty of Commerce, Zagazig University, Egypt.
[31] International Labour Organization. (2022). Egypt COVID-19 country case study. Economic Research Forum.
[32] Al-Saadi, A.F. (2013). Geography of Poverty in Iraq. Journal of the College of Basic Education, 12: 399-414. University of Babylon, Iraq. https://www.iasj.net/iasj/pdf/9f8002617fce0351.
[33] Al Madinah Region Development Authority. (2023). Al Madinah city voluntary local review “localization the sustainable Development goals”. Urban Observatory, Kingdom of Saudi Arabia.