Mahesh Kumar*![]() | Navneet Raj | Rupesh Roshan Singh
| Navneet Raj | Rupesh Roshan Singh![]()
© 2023 IIETA. This article is published by IIETA and is licensed under the CC BY 4.0 license (http://creativecommons.org/licenses/by/4.0/).
OPEN ACCESS
In this research paper, the researcher attempts to calculate the level and quality of corporate sustainability reporting practices of companies in India that use the Global Reporting Initiative (GRI). The study also seeks to measure the relative reporting performance of these companies and rank them based on sustainability disclosure criteria—namely economic, environmental, social, and governance parameters—as outlined in the Global Reporting Initiative Guidelines (GRI-G4). A Multi-Criteria Decision Making technique is employed to assess improvements in the sustainability reporting practices of GRI-based reporting companies in India. The present study uses a content analysis technique to examine the level and quality of sustainability disclosure based on the GRI-G4 reporting framework. A binary coding system is applied to measure the level of corporate sustainability reporting (CSR), wherein '1' indicates that the item is disclosed and '0' indicates otherwise. To calculate the quality of sustainability disclosure, a four-point scale (ranging from '0' to '3') is used. Furthermore, the Multi-Criteria Decision Making (MCDM) technique, such as Entropy, is used to calculate criteria weight, and the Technique for Order of Preference by Similarity to Ideal Solution (TOPSIS) is used for ranking. The findings of this study are useful for various stakeholders, including potential investors, asset managers, rating agencies, NGOs, customers, academics, students, and policy makers like the Securities and Exchange Board of India (SEBI) and the Ministry of Corporate Affairs, as they make more informed decisions.
sustainability, sustainability disclosures, GRI-G4 framework, entropy, TOPSIS, tipple bottom line, Indian companies ranking and MCDM techniques
With the adoption of the sustainable development concept as defined by the Brundtland Commission of the United Nations on Environment and Development in 1987, the perspective of enterprises is changing worldwide. An enterprise is now seen as a unit comprising environmental, social, and economic dimensions, and the maintenance of these three dimensions allows for its sustainable development. As such, today's business leaders have started looking beyond their companies' financial performance to sustain their businesses over time. The integration of social, economic, environmental, and governance issues into business strategies has become increasingly necessary. In a world of shifting expectations, corporations must account for their impact on the communities and environments in which they operate. Business sustainability has, in fact, become one of the most critical issues worldwide.
Sustainability, especially in an accounting context, has become increasingly relevant to society. Sustainability Reporting has emerged as an essential tool used by companies striving for more sustainable operations. The primary aim of business sustainability management is to integrate social and environmental aspects with the economic aspects of business, aligning them with the overall business strategy. The secondary aim is to report these aspects, thereby increasing the benefits to stakeholders and enhancing their decision-making processes.
As an integral part of their business strategy and in pursuit of broader business goals, many corporations have voluntarily begun publishing sustainability information to meet their shareholders' growing demands. Therefore, to address the specific information needs of stakeholders, it is imperative for business organizations to involve stakeholders in the reporting process. This involvement can extend to issues concerning employees, the environment, and corporate philanthropy. In this regard, the key performance indicators (KPIs) suggested by the Global Reporting Initiative for sustainability reporting are gaining momentum [1]. These performance indicators are increasingly being used in decision-making, strategic planning, performance management, and risk management by stakeholders. These activities should be summarized in a separate sustainability report for stakeholders' information [2].
Investors are increasingly demanding information on both the financial and non-financial activities of companies, as well as information relating to overall sustainability in capital markets, for their investment decisions [3]. The drivers of this demand could be company-specific factors or broad contextual factors. However, the fundamental drivers of sustainability reporting are considered to be the maximization of shareholder wealth, preservation of organizational legitimacy, and management of corporate reputation risk.
1.1 Sustainability accounting and reporting
Sustainability Accounting is a type of accounting that goes beyond mere financial or quantifiable disclosures, encompassing non-financial aspects as well. The extensive scope of this accounting concept benefits governments, suppliers, employees, and customers. Such reporting may be accomplished through Corporate Social Responsibility (CSR), sustainability reporting, and non-financial reporting. A broader disclosure that covers various dimensions aids in fostering a healthier global economy and ensures that businesses benefit society at large. Sustainability Accounting transcends traditional financial accounting, aiming for economic and social improvement rather than overemphasizing monetary aspects, thereby ensuring transparency for stakeholders. It has expanded the accounting field to cover non-financial dimensions and the organizational impact on society and the environment, modifying traditional cost and financial accounting practices by adjusting bookkeeping and disclosures to include social and environmental dimensions.
Sustainability Reporting is a report prepared by an organization to communicate its economic, environmental, and social impact to stakeholders such as investors, government, employees, etc., to help them understand its underlying motives towards sustainability. Over the last decade, companies worldwide have increasingly adopted sustainability reporting. It enhances both the internal performance and external reputation of organizations compared to those that do not prepare sustainability reports.
1.2 GRI-G4 framework-a brief introduction
"Established in 1997 as an independent body by the Coalition for Environmentally Responsible Economies and the United Nations Environment Programme, the GRI introduced the framework for environmental reporting." Following the establishment of a multi-stakeholder Steering Committee in 1998, the GRI framework was expanded to include economic, social, and governance aspects in its reporting. The first GRI guidelines were published in June 2000, followed by the second version in 2002. The third version, G3, which contained detailed instructions for sustainability reporting, was published in 2006. G3.1 was published in 2011, and G4 was published in 2013. According to KPMG survey reports (2008, 2013), the GRI framework is a widely accepted reporting framework for economic, social, and environmental performance. The general and specific disclosure aspects of the GRI framework for sustainability reporting are agreed upon by a majority of stakeholders worldwide.
The GRI-G4 framework has four categories: Governance, Economic, Environment, and Social, each with different aspects. Companies following GRI guidelines for disclosing their corporate sustainability report on these four categories. The governance category has seven aspects, the economic category has four, the environment category has twelve, and the social category has twenty-nine. The Social category includes four sub-categories: labor practices and decent work, human rights, society, and product responsibility. Each aspect includes several indicators, as outlined in the GRI-G4 framework. The GRI-G4 Framework contains a total of 52 aspects and 149 indicators across different aspects.
"Besides the GRI framework, other guidelines for reporting sustainability issues include the Dow Jones Sustainability Index (DJSI), the Sustainability Accounting Standards Board (SASB), the United Nations Global Compact (UNGC), and the International Integrated Reporting Councils (IIRC)." While the scope of sustainability reporting in other frameworks is subjective, the GRI-G4 framework is objective. This objective nature makes the GRI-G4 framework unique among other frameworks, which are largely subjective in nature.
For the last two decades, researchers worldwide have emphasized the importance of corporations publishing sustainability reports. Some researchers have focused on the frequency of reporting on different parameters of sustainability, while others have used qualitative assessment techniques to provide insight into corporate sustainability reporting practices. Some literature found that governance disclosure was the highest and environmental disclosure the least in the overall ESG disclosure [4]. The researchers also found that ESG disclosure practices were influenced by the auditor type rather than company size and profitability. Some studies reported that companies disclose positive aspects of sustainability and conceal negative aspects [5]. Bradford examined the understanding of external parties regarding sustainability reporting activities performed by companies and observed varying practices among different companies and industries [6]. Larger companies and those with a longer operational history tend to have positive sustainability disclosure, whereas company profits, leverage, growth, and advertising intensity correlate negatively with sustainability disclosure [7].
In contrast, a content analysis study based on the GRI-G4 framework with a sample of 10 PSU banks found that these banks are not properly following sustainability reporting disclosure and transparency practices [8]. Jain and Winner [9] examined the corporate sustainability reporting of the 200 largest state-owned and private Indian companies and found that while most companies show commitment towards the environment, only a few report their environmental impacts in accordance with the GRI framework. A comparative study between developed and developing economies based on sustainability reporting through content analysis by Bhatia and Tuli observed greater disclosure in developing nations compared to developed nations [10]. Yet, a study by Abeydeera [11] within a specific national context revealed that global institutions dominate sustainability reporting, limiting the potential for local institutions to transform business as usual. Sustainability reporting is seen as a tactic for impression management that organizations use to improve their public image [12]. For multinational corporations in Austria, the UK, and South Africa, reporting outcomes are considered crucial for policy implications concerning companies, investors, regulators, and stakeholders [13].
Goyal et al. [14] used the analytic hierarchy process (AHP) to prioritize corporate sustainability practices and improve corporate sustainability performance in the manufacturing sector. In contrast, Dev and Shankar [15] developed a hierarchy-based interpretive structural model (ISM) to understand the sustainable boundary and found that enablers with high driving power and low dependence require more attention due to their strategic importance. In other studies, Faisal et al. [16] applied a multi-criteria decision model to understand the impact of Triple Bottom Line (TBL) dimensions on supplier selection decisions. The outcome was a rank order of potential supplier firms, in terms of economic, social, and environmental dimensions. Similarly, Kumar and Rahman [17] applied multi-criteria decision-making techniques, such as ISM and fuzzy AHP, to analyze the sustainable supply chain of Indian automobile companies and found that it is vital for supply chain developers to gain support from partners and minimize pressure from stakeholders. Neumüller et al. [18] used another multi-criteria decision-making technique, such as ANP and GP, to propose a comprehensive methodology and problem-specific model for configuring the optimal strategic supplier portfolio. In their study, Aras et al. [19] applied both content analysis and MCDM techniques, such as entropy and TOPSIS, to study the sustainability performance with prime dimensions of governance, economics, social and environment on a bank. A comprehensive evaluation of the sustainable development level of 287 cities in China through the Multi-Criteria Decision Making technique TOPSIS-Entropy found that the overall level of urban sustainable development in China is not high [20]. In another study by Celal Bayar in home appliance firms using the Analytic Hierarchy Process and TOPSIS, the researcher tried to measure corporate sustainability and ranked the best-performing industries [21].
Through literature review it has been found that limited research has been done on sustainability performance of Indian Companies [9, 22, 23] and no ranking of sustainability reporting Indian companies based on sustainability criteria such as governance, economic, environment and social [19]. Researcher has framed these objectives to full fill the gaps in the existing literature. First objective is to examine the level and quality of the disclosure of corporate sustainability reporting practices (CSRP) of GRI based reporting companies in India. And second objective is to measure the relative reporting performance of GRI based reporting companies and rank these companies based on sustainability disclosure using Multi-Criteria Decision Making technique. To check whether there is improvement in sustainability reporting practices or not, researcher has tested this null hypothesis(H01): There has been no significant improvement in the sustainability reporting practices of GRI based reporting companies in India. Findings of the study will be useful for investors, asset managers and ratings agencies, corporate stakeholders, including NGOs, customers, academics and students, and policy makers like SEBI and Ministry of Corporate Affairs. The results of this research will contribute directly to the knowledge of the corporations providing voluntary information in the form of sustainability reports and the growing importance of the development of globally accepted sustainability reporting standards.
3.1 Content analysis technique
Content analysis technique is “used in this study for extracting information in a numeric form from the published sustainability reports of the select companies”.
A binary coding system is "used to measure the level of corporate sustainability reporting (CSR), i.e., ‘1’ if the item is disclosed or ‘0’ otherwise”.
For calculating the “quality of sustainability disclosure, a four-point scale (ranging from ‘0’ to ‘3’) is used”. ‘1’ is assigned if the item is partly disclosed, ‘2’ if the item is fully disclosed in narrative form, ‘3’ if it is disclosed in quantitative form, and ‘0’ it not disclosed.
Post obtaining “the item-wise score, the overall disclosure score for sustainability performance is computed by using the following equation”:
$\mathrm{I}_{\mathrm{k}}=\sum_{\mathrm{i}=0}^{\mathrm{n}} \mathrm{Xik} / \mathrm{N}_{\mathrm{k}}$ (1)
where, Nk is the maximum expected score for each category, Xik “assumes value ‘0’-‘3’ in a four-point scale”.
Research type is descriptive in nature.
3.2 Sampling procedure and sample size
The present study will be “based on the secondary data collected from sustainability reports published in the respective company’s website. The population of this study comprises all listed companies”. As the empirical evidence relating to the CSR in the context of India is very limited, the present study relies on disclosures uploaded in the website of GRI (2018) in selecting the sample of the study. The sample companies will be selected on the basis of the following criteria; the company must be a listed company on NSE or BSE; the company must be publishing its sustainability reports either on its own website or uploaded on GRI website; and the company must be publishing its respective sustainability report continuously at least for a period of six years as per the GRI guidelines. See Table 1, there are 116 Indian companies which are reporting on sustainability parameters as per GRI-G4 database (GRI 2018) from 2014 to 2019. From preliminary scrutiny it was found that about 53 companies which are regular in sustainability reporting on continuous basis for past 6 year’s but excludes all financial companies because financial companies following GRI-G4 report along with ‘GRI Financial Services Sector Supplement’. Therefore, the sample size is 53.
Sample Size: All the listed companies except financial sector which are disclosing sustainability report for six years (2014-2019) as per GRI G-4 guidelines have been considered for the study.
3.3 Research framework
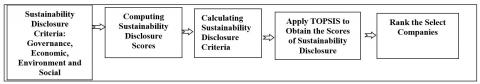
Figure 1 presents the framework which is followed for the calculation of rank of the select companies under study. Here researcher first identify the different criteria under study. Second step is calculating the data from the sustainability reports published by the companies under study. Third step is normalizing the data and applying other different procedures which are mention in the research methodology section of Entropy to calculate the criteria weight. Fourth step is to apply TOPSIS (Technique for order preference by similarity to ideal solution) along with Entropy weight to calculate scores of sustainability disclosure. Finally, on the basis of scores obtain in the fourth step, ranking of companies are done.
Figure 1. Framework for ranking of companies
Table 1. Selection of companies for the study
|
No. of Indian companies reporting as per GRI G4 Guidelines |
116 |
|
No. of financial companies excluded (GRI G4 + Financial Sector Supplement guideline) |
(08) |
|
No. of companies whose sustainability reports not available for last 6 years |
(37) |
|
No. of companies not listed on either BSE/NSE |
(18) |
|
No. of listed companies finally considered for this study |
53 |
3.4 Entropy
The average amount of information, surprise, or uncertainty present in a random variable's potential outcomes is known as the entropy of the variable in information theory. Information entropy, sometimes known as Shannon entropy in his honor, was first developed by Claude Shannon in his 1948 publication A Mathematical Theory of Communication. Take a biased coin as an illustration, with a chance of p for heads and a probability of 1-p for tails. A coin flip has an entropy of one bit when p=1/2, when there is no reason to expect one result over another. In this instance, there is the greatest amount of surprise. The event is known and there is no entropy when p=0 or p=1, respectively. Entropy method can be explained in these four steps as follows consecutively:
Step 1: structure of the decision matrix. Supposing there are ‘n’ alternatives (Y={ Yi |i= 1, 2,..., n}) and ‘m’ criteria(X={ Xj |j=1,2,... , m}) in any problem, decision matrix (DM) can be expressed as follows:
X1 X2 X3 … Xm
$\mathrm{DM}=\left[\begin{array}{ccccc}a_{11} & a_{12} & a_{13} & \cdots & a_{1 m} \\ a_{21} & a_{22} & a_{23} & \cdots & a_{2 m} \\ a_{31} & a_{32} & a_{33} & \cdots & a_{3 m} \\ \vdots & \vdots & \vdots & \ddots & \vdots \\ a_{n 1} & a_{n 2} & a_{n 3} & \cdots & a_{n m}\end{array}\right] \begin{aligned} & Y 1 \\ & Y 2 \\ & Y 3\\ &...\\ & Y n\end{aligned}=[Aij] \mathrm{nxm}$
Note: ‘i’ represents row and ‘j’ represents column elements of a matrix and [Aij]nxm is a matrix of order n x m.
Step 2: normalization of decision matrix. The decision matrix needs to be normalized for each criterion Xj(j=1, 2, ... , m). The normalize decision matrix (NDM) will be NDM=[xij].
$x_{i j}=a_{i j} / \sum_{i=1}^n a_{i j}$ (2)
where, i=1, 2, 3…. n & j=1, 2, 3, …, m.
In this step, each data entry in a column is divided by sum of all the column data. Which make the data standardized i.e., in probability form.
Step 3: How to calculate entropies: The entropy Bj of the set of attributes j defined as given in Eq. (3):
$B_j=-\mathrm{K} \sum_{i=1}^n x_{i j} * \log \left(x_{i j}\right)$ (3)
where, i=1, 2.., n & j= 1, 2,…….., m and K is constant whose value is K = 1/log(m), m is number of criteria that gives value of Bj between 0 to1 (0≤Bj≤1).
Step 4: How to calculate Entropy weight: Degree of divergence (ddj) is calculated for each criteria Xj(j=1,2,…m) by this formula (4),
$d d_j=1-B_j$ (4)
The higher the value of ddj shows criteria Xj is more important for the problem, the criteria weight can be calculated by this formula (5),
$c w_j=\frac{d d_j}{\sum_{j=1}^m d d_j}$ (5)
where, j=1, 2, ……m.
Entropy (Bj), Degree of Diversion (ddj=1-Bj) and Criteria Weight (CWj) values are calculated by given equation above. Degree of divergence is calculated one minus Entropy (1-Bj). Since Entropy values show randomness in the data, so high value of Entropy means randomness is high in the data, so degree of divergence is low. Degree of divergence is actual information in the given data set by removing randomness in the data. Criteria Weight is calculated dividing each column of degree of divergence by sum of all degree of divergence i.e., weightage average.
3.5 TOPSIS
Technique for order preference by similarity to ideal solution (TOPSIS) method was developed by Hwang and Yoon [24], is most popular and commonly used as multi-criteria decision making (MCDM) methods and is work on the concept the selected alternative should have the minimum distance from the positive-ideal solution and the maximum from the negative-ideal solution. The positive ideal solution maximizes the benefit criteria and minimizes the cost criteria and negative-ideal solution maximizes the cost criteria and minimizes the benefit criteria. TOPSIS method assumed that each criteria hasn’t equal weight, so, it needs criteria weights from the decision maker [24]. At the end of the procedure, it produces performance score between 0 to1 on that basis alternatives are ranked. These are the steps of TOPSIS method as follows:
Step 1: construct the decision matrix: Supposing there are ‘n’ alternatives (Y={ Yi |i = 1, 2, ..., n}) and ‘m’ criteria (X={ Xj |j = 1, 2,... , m}) in a problem, decision matrix (DM) is expressed given in Entropy section.
DM= [Aij] nxm
Note: ‘i’ represents row and ‘j’ represents column of a matrix and [Aij]nxm is a matrix of order n x m.
Step 2: normalization of decision matrix (NDM): The decision matrix needs to be normalized for each criterion Xj(j=1,2,... ,m). The normalize decision matrix will be NDM=[xij].
$x_{i j}=a_{i j} / \sqrt{ }\left(\sum_{i=1}^n a_{i j}^2\right)$ (6)
where, i=1, 2, 3…. n & j=1, 2, 3……, m.
In this step, each data entry in a column is divided by sum of all the column data. Which make the data standardized i.e. in probability form.
Step 3: calculate the weighted normalized decision matrix (WNDM): Elements in each column of matrix NDM=[xij] are multiplied with the relevant criteria weight (cwj) (Eq. (5)) value and matrix WNDM=[bij] is created.
$\mathrm{WNDM}=\left[b_{i j}\right]=\left[c w_j\right] *\left[x_{i j}\right]$ (7)
where, i=1,2,…n & j=1, 2, …, m.
Step 4: calculate the distance from the best ideal solution (BIS) and the worst ideal solution (WIS): The distance of each alternative from positive ideal solution and negative ideal solution is calculated as given equations:
$\begin{gathered}\mathrm{BIS}=\left\{\left(\max _i\left[b_{i j}\right] \mid j \in J_1\right),\left(\min _i\left[b_{i j}\right] \mid j \in J_2\right) \mid \mathrm{i}=1,2,3 \ldots \mathrm{n} \& \mathrm{j}=1,2,3, \ldots, \mathrm{m}\right\}\end{gathered}$ (8)
$\begin{aligned} & =\left[b_1^{+}, b_2^{+}, b_3^{+} \ldots \ldots, b_j^{+}, \ldots ., b_n^{+}\right]=V_{+} \\ \text {WIS }= & \left\{\left(\min _i\left[b_{i j}\right] \mid j \epsilon J_1\right),\left(\max _i\left[b_{i j}\right] \mid j \epsilon J_2\right) \mid \mathrm{i}=1,\right. \\ & 2,3, \ldots \mathrm{n} \& \mathrm{j}=1,2,3, \ldots \mathrm{m}\} \\ = & {\left[b_1^{-}, b_2^{-}, b_3^{-}, \ldots \ldots \ldots b_j^{-}, \ldots \ldots . b_n^{-}\right]=V_{-} }\end{aligned}$ (9)
where, J1 and are benefits and cost criteria, respectively.
V+ is best ideal solution which is calculated by finding the maximum value in the criteria column.
V- is worst ideal solution which is calculated by finding the minimum value in the criteria column.
Step 5: calculate the separation from best ideal solution (BIS) and worst ideal solution (WIS) between the alternatives: Calculation of the separation from best ideal solution (V+) and worst ideal solution” (V-) between the alternatives: with the help of distance formula given by Euclidean which is define as:
$S_i^{+}=\sqrt{ }\left(\sum_{j=1}^m\left(\left[b_{i j}\right]-V_{+}\right)^2\right)$ (10)
where, i=1, 2, 3, …, n.
$S_i^{-}=\sqrt{ }\left(\sum_{j=1}^m\left(\left[b_{i j}\right]-V_{-}\right)^2\right)$ (11)
where, i=1,2, 3, …, n.
Step 6: calculate the coefficient of separation:
$P_i=\frac{s_i^{-}}{s_i^{+}+S_i^{-}}, P_i \in[0,1] \forall i=1,2,3, \ldots \ldots, n$ (12)
On the basis of value of Pi preferred order can be obtain and chose the rank in descending order of values Pi.
4.1 Level of sustainability disclosures
Sustainability disclosure matrix or decision matrix (DM) is the matrix that is formed by data of the categories (criteria) and alternatives. In this sustainability disclosure matrix, there are four criteria such as Governance, Economic, Environment and Social as well as there are 53 alternatives. Alternatives are the name of the companies which are under studies. We can say sustainability disclosure matrix data is the raw data for the purpose of study of first objective level and quality of disclosure and second objectives ranking of companies understudy. There are two sustainability disclosure matrix under the study. First sustainability disclosure matrix is for the level of disclosure and second matrix is for quality of disclosures. So, there are two set of ranking for the companies separately for level of disclosure and quality of disclosure.
All the companies selected for the purposes of this study purported better sustainability disclosures in terms of ‘Governance (81.5 per cent)’, followed by ‘Economic (78.3 per cent)’ reporting and then by ‘Environmental (71.5 per cent)’ reporting while level of ‘Social (64.3 per cent)’ disclosures stood at the last.
4.2 Relative performance of sample companies
Post obtaining “the item-wise score, the overall disclosure score for sustainability performance is computed by using the following equation”:
Ik= $\sum_{i=0}^{\mathrm{n}} \mathrm{X_{ik}}$/Nk, where Nk is the maximum expected score for each category, Xik “assumes value ‘0’-‘3’ in a four-point scale”.
Table 2 presents the company data for level and quality of disclosure of the selected companies on individual basis. After scoring the companies on the basis of scale defined above we rank the level and quality of companies’ sustainability reporting and disclosures from highest to lowest. Relative Performance of Sample Companies is calculated using Eq. (1). So, ADANI POWER level of disclosure is 73.3% and quality of disclosure is 59.7% and so on.
4.3 Result of Paired t –test: Examining change in the sustainability reporting practices
In Table 3, Paired T- test is applied for the purpose of testing the hypothesis under study. It tests whether there is any improvement in the sustainability scores from 2014 over 2019 by comparing mean differences and found that mean differences is 8.5283 which is positive and significant. Mean difference positive means sustainability mean score of 2019 is greater than sustainability mean score of 2014. It means that there is improvement in disclosure of sustainability over the period under study. The results clearly shows that sustainability practices of selected companies has improved over the study period (t value: 2.481. df=52 and p < 0.05). Therefore, null hypothesis is hereby rejected.
4.4 Rank based on quality of disclosure
Calculation of the separation from best ideal solution (V+) and worst ideal solution” (V-) between the alternatives: with the help of distance formula given by Euclidean which is define as
$S 1=\sqrt{ }\left(\sum_{j=1}^m\left(\left[b_{i j}\right]-V_{+}\right)^2\right)$ from Eq. (10) and
$S 2=\sqrt{ }\left(\sum_{j=1}^m\left(\left[b_{i j}\right]-V_{-}\right)^2\right)$, from Eq. (11)
Table 4 presents the decision matrix of quality of corporate disclosures of the selected Indian companies (53) on the basis of GRI reporting standards. The determinants of GRI reporting used for analysis in the decision matrix presented above are governance, economic, environment and social criteria. In Table 4, transparency quality of disclosure is found to be highest in INDIAN OIL CORPORATION(IOC), followed by ACC, NTPC, KBL, and JUBILIANT, respectively, in comparison to the other companies under study.
While the quality of completeness and transparency in sustainability reporting found to be least in JAIN IRRIGATIONS, followed by JK CEMENT, BHARTI AIRTEL, OIL INDIA LTD., TVS Motors respectively, in comparison to the other companies under study. Thus, it can be said that the quality of sustainability disclosures (considering all 4 aspects of disclosures under study as per their weight-age) is best in IOC followed by ACC, NTPC, KBL and JUBILIANT respectively while least in JAIN IRRIGATIONS, followed by JK CEMENT, BHARTI AIRTEL, OIL INDIA, TVS Motors respectively in consideration of quality of ‘governance’, ‘economic’, ‘environmental’ and ‘social’ disclosures in their CSR reporting.
Findings: All the companies selected for the purposes of this study purported better sustainability disclosures in terms of ‘Governance (81.5 per cent)’, followed by ‘Economic (78.3 per cent)’ reporting and then by ‘Environmental (71.5 per cent)’ reporting while level of ‘Social (64.3 per cent)’ disclosures stood at the last. The analysis reveals that the level of sustainability disclosures on all the 149 indicators of GRI-G4 framework is 73.5% and quality of disclosures is 67.06% which is considered to be good for selected companies. The mean differences of the sustainability scores of the companies selected for the purposes of this study were found to be positive and significant which quantitatively justifies the improvement in the transparency of the sustainability disclosures over the period of 2014-2019. Mean difference positive means sustainability mean score of 2019 is greater than sustainability mean score of 2014. The results showed that sustainability practices of selected companies has improved over the study period (t value: 2.481. df=52 and p < 0.05). This implies the evolution of better transparency in the corporate sustainability disclosures with the period of time and advancement. Among the companies studied in present research, level of disclosures as per GRI standards was found to be highest in INDIAN OIL CORPORATION(IOC), followed by ACC, NTPC, KBL, and JUBILIANT and while the quality of completeness and transparency in sustainability reporting was least in JAIN IRRIGATIONS, followed by JK CEMENT, BHARTI AIRTEL, OIL INDIA LTD., TVS Motors respectively.
Table 2. Relative performance of sample companies
|
S.N |
Name of Companies |
Level |
Quality |
S.N |
Name of Companies |
Level |
Quality |
|
1 |
ADANI POWER |
.733 |
.597 |
28 |
Hindustan Zinc Limited |
.826 |
.812 |
|
2 |
AMBUJA CEMENT |
.833 |
.819 |
29 |
NTPC |
.860 |
.756 |
|
3 |
BHARTI AIRTEL |
.453 |
.433 |
30 |
PETRONET-LNG |
.614 |
.437 |
|
4 |
BHEL |
.847 |
.759 |
31 |
RFC (rastriya chemical & fertilizers) |
.686 |
.680 |
|
5 |
BPCL |
.826 |
.863 |
32 |
RIL |
.790 |
.709 |
|
6 |
ASIAN PAINTS LIMITED |
.810 |
.777 |
33 |
SHREE CEMENT LTD |
.781 |
.800 |
|
7 |
COAL India Ltd |
.871 |
.836 |
34 |
Jain Irrigation Systems |
.532 |
.377 |
|
8 |
GAIL INDIA |
.840 |
.817 |
35 |
TATA MOTORS |
.676 |
.664 |
|
9 |
GMR ENERGY |
.689 |
.478 |
36 |
TATA POWER |
.770 |
.790 |
|
10 |
HAVELLS |
.794 |
.789 |
37 |
TATA STEEL |
.808 |
.848 |
|
11 |
HCC |
.738 |
.533 |
38 |
TCS |
.828 |
.641 |
|
12 |
HCL |
.738 |
.712 |
39 |
VodaPhone-IDEA |
.536 |
.553 |
|
13 |
HINDALCO INDUSTRIES |
.808 |
.752 |
40 |
WIPRO |
.724 |
.524 |
|
14 |
HPCL |
.545 |
.674 |
41 |
CHAMBEL FERTILISER &CHEMICAL |
.628 |
.546 |
|
15 |
ARVIND LIMITED |
.651 |
.643 |
42 |
The Indian Hotels Co. Ltd |
.645 |
.485 |
|
16 |
INDIAN OIL |
.916 |
.707 |
43 |
INFOSYS |
.829 |
.860 |
|
17 |
ITC |
.853 |
.812 |
44 |
JK CEMENTS |
.642 |
.478 |
|
18 |
WELSPUN INDIA |
.734 |
.742 |
45 |
TATA CHEMICALS |
.663 |
.702 |
|
19 |
JINDAL STEEL |
.624 |
.451 |
46 |
TECH-MAHINDRA |
.697 |
.820 |
|
20 |
JSW STEEL |
.550 |
.600 |
47 |
Dr. Reddy's India |
.743 |
.769 |
|
21 |
JUBILANT INDUSTRIES |
.784 |
.544 |
48 |
Oil India Limited |
.566 |
.493 |
|
22 |
JUBILIENT LIFE SCIENCE |
.850 |
.644 |
49 |
ONGC |
.758 |
.663 |
|
23 |
KANSAI NEROLAC |
.908 |
.802 |
50 |
TVS Motors |
.643 |
.443 |
|
24 |
KIRLOSKAR BRTHERS LTD |
.857 |
.728 |
51 |
ACC |
.889 |
.799 |
|
25 |
MAHINDRA LIFE SPACE DV |
.689 |
.690 |
52 |
NALCO |
.694 |
.617 |
|
26 |
MAHINDRA&MAHINDRA LTD |
.735 |
.721 |
53 |
Mindtree |
.848 |
.794 |
|
27 |
MARUTI_SUZUKI |
.604 |
.560 |
|
|||
Table 3. Result of paired t-test
|
Input Variables |
Mean Difference |
Std. Deviation |
‘t’ value |
Significance |
|
Sustainability Score (2014 and 2019) |
8.52830 |
25.0219 |
2.481 |
0.016 |
Table 4. Rank based on quality of disclosure
|
Companies Name |
S1 |
S2 |
S1+S2 |
S2/(S1+S2) |
Rank (1-53) |
|
ADANI POWER |
0.045883029 |
0.023969677 |
0.069852706 |
0.343146008 |
43 |
|
AMBUJA CEMENT |
0.019654723 |
0.048429727 |
0.06808445 |
0.711318469 |
15 |
|
BHARTI AIRTEL |
0.06434949 |
0.00952106 |
0.073870551 |
0.128888443 |
51 |
|
BHEL |
0.020285006 |
0.051259093 |
0.071544099 |
0.716468494 |
13 |
|
BPCL |
0.015830625 |
0.051701742 |
0.067532367 |
0.765584623 |
7 |
|
Asian Paints Limited |
0.024958781 |
0.042772554 |
0.067731335 |
0.631503192 |
22 |
|
COAL India Ltd |
0.019568224 |
0.048157707 |
0.067725931 |
0.711067482 |
16 |
|
GAIL INDIA |
0.019486329 |
0.048964576 |
0.068450905 |
0.715324014 |
14 |
|
GMR ENERGY |
0.026659238 |
0.04166293 |
0.068322168 |
0.609801055 |
25 |
|
HAVELLS |
0.031455277 |
0.037397384 |
0.068852661 |
0.543150889 |
31 |
|
HCC |
0.026419485 |
0.044466955 |
0.07088644 |
0.627298462 |
23 |
|
HCL |
0.038105739 |
0.029985188 |
0.068090927 |
0.440369799 |
35 |
|
HINDALCO INDUSTRIES |
0.029618497 |
0.039018962 |
0.068637459 |
0.568479114 |
29 |
|
HPCL |
0.041527695 |
0.027677535 |
0.06920523 |
0.399934148 |
37 |
|
Arvind Limited |
0.043937291 |
0.027415704 |
0.071352995 |
0.384226392 |
40 |
|
Indian Oil Corporation(IOC) |
0.004578414 |
0.064394697 |
0.068973111 |
0.933620309 |
1 |
|
ITC |
0.025136806 |
0.043354563 |
0.068491369 |
0.632993088 |
21 |
|
Welspun India |
0.019477441 |
0.054453745 |
0.073931186 |
0.736546349 |
9 |
|
JINDAL STEEL |
0.039906508 |
0.030058332 |
0.069964841 |
0.429620536 |
36 |
|
JSW STEEL |
0.024977469 |
0.043640073 |
0.068617542 |
0.635990039 |
20 |
|
JUBILANT INDUSTRIES |
0.01594343 |
0.053052065 |
0.068995496 |
0.768920708 |
5 |
|
JUBILIENT LIFE SCIENCE |
0.018154827 |
0.050468255 |
0.068623082 |
0.735441391 |
10 |
|
KANSAI NEROLAC |
0.01582715 |
0.051860424 |
0.067687574 |
0.766173478 |
6 |
|
KIRLOSKAR BRTHERS LTD |
0.01695364 |
0.057283587 |
0.074237227 |
0.771628867 |
4 |
|
MAHINDRA LIFE SPACE DV |
0.028475395 |
0.040247562 |
0.068722957 |
0.585649454 |
27 |
|
MAHINDRA&MAHINDRA LTD |
0.029856621 |
0.038779281 |
0.068635901 |
0.564999948 |
30 |
|
MARUTI_SUZUKI |
0.049698971 |
0.018812745 |
0.068511716 |
0.274591643 |
44 |
|
Hindustan Zinc Limited |
0.020305125 |
0.047836506 |
0.068141631 |
0.702015864 |
18 |
|
NTPC |
0.01438315 |
0.053767254 |
0.068150404 |
0.788949897 |
3 |
|
PETRONET-LNG |
0.057340695 |
0.01292377 |
0.070264465 |
0.183930384 |
48 |
|
RASTRIYA CHEMICAL& FERTILIZERS |
0.036298568 |
0.033125639 |
0.069424207 |
0.477148249 |
34 |
|
RIL |
0.018732816 |
0.049220849 |
0.067953665 |
0.724329565 |
11 |
|
SHREE CEMENT LTD |
0.026388039 |
0.041233684 |
0.067621723 |
0.609769787 |
26 |
|
Jain Irrigation Systems |
0.06651824 |
0.003828064 |
0.070346304 |
0.05441742 |
53 |
|
TATA MOTORS |
0.034586791 |
0.033709944 |
0.068296735 |
0.49358061 |
32 |
|
TATA POWER |
0.023493598 |
0.046004234 |
0.069497831 |
0.661952075 |
19 |
|
TATA STEEL |
0.018700298 |
0.048983384 |
0.067683681 |
0.723710392 |
12 |
|
TCS |
0.041799186 |
0.027538752 |
0.069337938 |
0.397167162 |
39 |
|
VodaPhone-IDEA |
0.047046941 |
0.026936424 |
0.073983365 |
0.36408758 |
42 |
|
WIPRO |
0.052402746 |
0.017734856 |
0.070137602 |
0.252858034 |
45 |
|
CHAMBEL FERTILISER &CHEMICAL |
0.051723918 |
0.016820054 |
0.068543972 |
0.245390715 |
46 |
|
The Indian Hotels Co. Ltd |
0.055878168 |
0.015109236 |
0.070987404 |
0.212843899 |
47 |
|
INFOSYS |
0.020136402 |
0.048111333 |
0.068247735 |
0.70495135 |
17 |
|
JK CEMENTS |
0.061779285 |
0.008505772 |
0.070285057 |
0.121018214 |
52 |
|
TATA CHEMICALS |
0.026717464 |
0.0428949 |
0.069612364 |
0.616196574 |
24 |
|
TECH-MAHINDRA |
0.044271402 |
0.025927942 |
0.070199344 |
0.36934735 |
41 |
|
Dr. Reddy's India |
0.029095756 |
0.039381571 |
0.068477327 |
0.5751038 |
28 |
|
Oil India Limited (OIL) |
0.061781467 |
0.011348271 |
0.073129738 |
0.155179977 |
50 |
|
ONGC |
0.035749874 |
0.034287974 |
0.070037848 |
0.489563503 |
33 |
|
TVS Motors |
0.05963068 |
0.011658919 |
0.0712896 |
0.16354306 |
49 |
|
ACC |
0.01137662 |
0.056419205 |
0.067795825 |
0.832192914 |
2 |
|
NALCO |
0.041934786 |
0.027744504 |
0.069679291 |
0.398174322 |
38 |
|
Mindtree |
0.017130793 |
0.050517281 |
0.067648073 |
0.746765995 |
8 |
The study revealed the evolution of better transparency and quality of sustainability disclosures by the Indian companies in accordance with the GRI standards. The research unveiled the factual observation that companies in India are becoming more serious about sustainability reporting to communicate to their stakeholders about their responsibility toward the economy, society and environment. The study also concludes the statistically significant impact of the transparency and quality of the sustainability disclosures of the companies over the progress of the company. The results are well supported by the fact that the improvement in the quality and transparency of the sustainability reporting not only makes a company compliant with the GRI standards but also creates its goodwill in the eyes of the stakeholders that company is serious about the benefit of the stakeholders and environment at large which in turn increases the investment as well as turnover of the company. Thus, though the sustainability disclosures are the part of non-financial aspects of a corporate but still play a whip hand in the image and progress of the company in the foreseeable future which is one of the most favourable factor for the corporates in the modern world in light of growing investor awareness round the world. Though the selected companies were found to be compliant with the disclosure standards of GRI sustainability reporting guideline, yet the analysis revealed a need to upgrade the disclosures of such corporate for achieving better transparency and quality of reporting. It has also been observed that quality of corporate disclosures in terms of governance is better in most of the companies but majority of them lack the transparency and quality of the aspects of economic disclosures in their sustainability reporting. The conclusion of the study is justified by the fact that in the recent past, various laws and Government of India as concentrated on ‘good corporate governance’ which eventually increased the quality of governance disclosures. Further, strict implementation of the environmental laws governing the liabilities and disclosures on ‘no fault basis’ lead to improvement in the aspects of environmental aspects of the sustainability disclosures of the companies in India. But comprehensive guidelines and regulations on economic disclosures is still awaited which is the major reason for Indian corporate lacking in the transparency and quality of economic disclosures in their sustainability reporting.
Investors before investing should see whether the target companies generating sustainability report or not and give priority on which companies that generating sustainability report as compare to those who don’t generate sustainability report. Companies should publish their sustainability report according to GRI-G4 Framework as it contains all most parameter on which companies should report. Further, companies should also frame and adopt voluntary guidelines to facilitate better transparency in the sustainability report. Stakeholders should be vigilant toward the reporting of the corporate and should contribute suggestions to build transparent sustainability disclosure mechanisms.
Recommendations: Policy makers and regulatory authorities should make ‘transparent sustainability disclosures’ mandatory (as per GRI G4 guidelines) for mid cap and large cap companies. Regulations should be made to get sustainability compliance and disclosures audited by third party to enhance the level of compliance and accountability. Corporate should draft effective sustainability policies and voluntary disclosure guidelines and should review and update them on periodical basis. Corporate should train management and employees to comply with the sustainability reporting with more transparency and should organize training for acquaint their management with latest sustainability reporting standards and requirements. Corporate should give equal importance to financial and non-financial reporting. Investors must refer the sustainability report along with financial data before investing in the corporate and must regularly review such reports for making informed investments and decisions.
Notwithstanding the research insight and its implication, this study has certain limitations. One of such limitation is the sample size and the study is limited to only those companies which have been reporting on sustainability parameters of GRI-G4 framework for 6 years (2014-2019) and listed either on National Stock Exchange or Bombay Stock Exchange but financial companies are excluded because these companies following GRI-G4 report along with GRI Financial Services Sector Supplement. Further, the time period considered for the study is only six years. Therefore, researchers should be thoughtful while generalizing the findings of the study. Future research can be conducted with increased sample size and number of years. Further study can be done sector wise ranking of companies and comparison study on sustainability disclosures among sectors. There can be comparison study on sustainability disclosures among Large Cap, Mid Cap and Small Cap companies.
[1] https://www.globalreporting.org/standards/global-sustainability-standards-board/.
[2] Adams, C., Evans, R. (2004). Accountability, completeness, credibility and the audit expectations gap. Journal of Corporate Citizenship, 14: 97-115. 10.9774/GLEAF.4700.2004.su.00010
[3] https://www.sebi.gov.in/legal/regulations/jun-2018/sebi-alternative-investment-funds-regulations-2012-last-amended-on-may-10-2019-_34621.html.
[4] Otu Umoren, A. (2016). Environmental, social and governance disclosures: A call for integrated reporting in Nigeria. Journal of Finance and Accounting, 3(6): 227-233. https://doi.org/10.11648/j.jfa.20150306.19
[5] Diouf, D., Boiral, O. (2017). The quality of sustainability reports and impression management: A stakeholder perspective. Accounting, Auditing and Accountability Journal, 30(3): 643-667. https://doi.org/10.1108/AAAJ-04-2015-2044
[6] Bradford, M., Earp, J.B., Williams, P.F. (2017). Understanding sustainability for socially responsible investing and reporting. Journal of Capital Markets Studies, 1(1): 10-35. https://doi.org/10.1108/jcms-10-2017-005
[7] Bhatia, A., Tuli, S. (2017). Corporate attributes affecting sustainability reporting: An Indian perspective. International Journal of Law and Management, 59(3): 322-340. https://doi.org/10.1108/IJLMA-11-2015-0057
[8] Kumar, R., Pande, N., Afreen, S. (2018). Developing a GRI-G4-based persuasive communication framework for sustainability reporting (SR): Examining top 10 Indian banks. International Journal of Emerging Markets, 13(1): 136-161. https://doi.org/10.1108/IJoEM-01-2017-0015
[9] Jain, R., Winner, L.H. (2016). CSR and sustainability reporting practices of top companies in India. Corporate Communications, 21(1): 36-55. https://doi.org/10.1108/CCIJ-09-2014-0061
[10] Bhatia, A., Tuli, S. (2018). Sustainability reporting: An empirical evaluation of emerging and developed economies. Journal of Global Responsibility, 9(2): 207-234. https://doi.org/10.1108/jgr-01-2018-0003
[11] Abeydeera, S., Tregidga, H., Kearins, K. (2016). Sustainability reporting more global than local? Meditari Accountancy Research, 24(4): 478-504. https://doi.org/10.1108/MEDAR-09-2015-0063
[12] Sandberg, M., Holmlund, M. (2015). Impression management tactics in sustainability reporting. Social Responsibility Journal, 11(4): 677-689. https://doi.org/10.1108/SRJ-12-2013-0152
[13] Al Farooque, O., Ahulu, H. (2017). Determinants of social and economic reportings: Evidence from Australia, the UK and South African multinational enterprises. International Journal of Accounting and Information Management, 25(2): 177-200. https://doi.org/10.1108/IJAIM-01-2016-0003
[14] Goyal, P., Rahman, Z., Kazmi, A.A. (2015). Identification and prioritization of corporate sustainability practices using analytical hierarchy process. Journal of Modelling in Management, 10(1): 23-49. https://doi.org/10.1108/JM2-09-2012-0030
[15] Dev, N.K., Shankar, R. (2016). Using interpretive structure modeling to analyze the interactions between environmental sustainability boundary enablers. Benchmarking, 23(3): 601-617. https://doi.org/10.1108/BIJ-05-2013-0063
[16] Faisal, M.N., Al-Esmael, B., Sharif, K.J. (2017). Supplier selection for a sustainable supply chain. Benchmarking: An International Journal, 24(7): 1956-1976. https://doi.org/10.1108/bij-03-2016-0042
[17] Kumar, D., Rahman, Z. (2017). Analyzing enablers of sustainable supply chain: ISM and fuzzy AHP approach. Journal of Modelling in Management, 12(3): 498-524. https://doi.org/10.1108/JM2-02-2016-0013
[18] Neumüller, C., Lasch, R., Kellner, F. (2016). Integrating sustainability into strategic supplier portfolio selection. Management Decision, 54(1): 194-221. https://doi.org/10.1108/MD-05-2015-0191
[19] Aras, Guler, Tezcan, N., Kutlu Furtuna, O., Hacioglu Kazak, E. (2017). Corporate sustainability measurement based on entropy weight and TOPSIS. Meditari Accountancy Research, 25(3): 391-413. https://doi.org/10.1108/medar-11-2016-0100
[20] Ding, L., Shao, Z.F., Zhang, H.C., Xu, C., Wu, D.W. (2016). A comprehensive evaluation of urban sustainable development in China based on the TOPSIS-Entropy method. Sustainability (Switzerland), 8(8). https://doi.org/10.3390/su8080746
[21] Celal Bayar, M. (2018). Corporate sustainability performance measurement: An application on home appliance firm. DEU Journal of GSSS, 20(3): 461-484. https://doi.org/10.16953/deusosbil.418845
[22] KPMG. (2013). Indian corporate responsibility reporting survey. http://www.kpmg.com/IN/en/IssuesAndInsights/ArticlesPublications/Documents/India-Corporate-Responsibility-Reporting-Survey-2013.pdf.
[23] Quick, R. (2008). Voluntary sustainability reporting practices in Germany: A study on reporting quality. Publications of Darmstadt Technical University, Institute for Business Studies (BWL), Darmstadt Technical University, Department of Business Administration, Economics and Law, Institute for Business Studies (BWL). https://EconPapers.repec.org/RePEc:dar:wpaper:35699.
[24] Hwang, C.L., Yoon, K. (1981) Multiple Attribute Decision Making: Methods and Applications. Springer-Verlag, New York. http://dx.doi.org/10.1007/978-3-642-48318-9