Sayaka Ono*![]() | Takuji W. Tsusaka
| Takuji W. Tsusaka![]()
© 2023 IIETA. This article is published by IIETA and is licensed under the CC BY 4.0 license (http://creativecommons.org/licenses/by/4.0/).
OPEN ACCESS
This study examines stakeholder perceptions of environmental, economic, and social indicators for selecting Polyethylene terephthalate recycling technologies in India, Pakistan, Sri Lanka, and Thailand. An online survey was conducted with 154 stakeholders from these countries. The survey data were analyzed using descriptive and inferential statistical methods. The results showed that global warming potential and total energy demand were the most important environmental indicators across all countries. Capital costs and profits from main recycling businesses were of utmost importance economically. Social indicators such as working environment and job creation opportunities were also deemed significant. However, the study found differences across countries. For instance, water consumption and solid waste generation were more important for Pakistan than for Thailand, while acidification potential and photochemical oxidant formation were more important for Thailand. Moreover, electricity cost was more significant in Sri Lanka, while job creation opportunity was more important in India, Pakistan, and Sri Lanka than in Thailand. The findings of this study can inform decision-making processes for policymakers and industry leaders in the plastic recycling field, aiding them in the transition toward a circular economy.
plastic recycling, PET recycling, multi-country analysis, key informant, inferential analysis
Plastic waste mismanagement is a considerable focus at global, regional, national, and local levels due to its contribution to environmental pollution. Mismanaged plastic often ends up in various forms in the environment, including oceans, polluting the air, water, and soil. Every year, at least eight million metric tons (MTs) of plastic find their way into the sea [1]. Asia and the Pacific region, in particular, is the world's most polluted area. Because of the burgeoning plastic pollution resulting from large volumes of mismanaged plastics, Asia has attracted global and regional focus and attention from academic and civil society. For instance, Thailand, India, and Sri Lanka are among the world's top 20 nations emitting marine plastic waste [2]. At the national level, India accounted for 21.0% of the total mismanaged plastic waste in 2019, while Thailand and Pakistan each contributed 2.2% [3]. Sri Lanka also generated 640 thousand MTs of mismanaged plastic waste [4].
This study focuses on four countries in the region, namely India, Thailand, Pakistan, and Sri Lanka, chosen due to their variations in national income levels and geographical characteristics. India is categorized as a middle-income country, while Thailand falls into the upper middle-income group. Sri Lanka and Pakistan are classified as lower middle-income countries. In terms of geographical characteristics, India, Pakistan, and Thailand are continental states, while Sri Lanka is an island nation. These geographical characteristics impact waste management practices. For instance, island states face distinct challenges, including limited land availability for landfills and high import costs for waste management operations [5].
The countries studied exhibit unique situations in terms of the volume of plastic waste generated and their status of plastic waste management. Each year in Thailand, 2.88 MTs of plastics are discarded without being recycled [6], with the estimated per capita mismanaged plastic waste standing at 19.56 kg in 2019. The recycling rate in Thailand remains low at 21.4% [3]. In India, material recycling dominates, representing the significant majority (94%) of the total recycling efforts, while chemical recycling plays a marginal role, accounting for less than 1% [7]. Sri Lanka generated an estimated 1.75 MTs of plastic waste annually in 2017 [8], with the amount of mismanaged plastic waste standing at 7.29 kg per capita [3]. In Pakistan, around 3.9 MTs of plastic waste were produced annually in 2020 [9], with the percentage of mismanaged waste estimated at 46.3%, equating to 6.2 kg per capita in 2019 [3].
Recycling not only offers the potential to decrease oil usage and reduce carbon dioxide emissions, but it also helps to reduce the volume of waste that requires disposal [10]. As a fundamental aspect of the waste hierarchy paradigm, a principle that has been prevalent for over forty years [11], recycling is crucial for achieving a circular economy for plastic waste, especially considering the growing volumes of such waste. Moreover, according to an Australian study on life-cycle assessment (LCA), recycling strategies for plastic-based products can provide significant environmental benefits [12].
Recycling methods vary in their trajectories, procedures, outcomes, and the scale and nature of the operations. They can range from small-scale, decentralized systems to large-scale, integrated configurations. ASTM standards identify four types of plastic recycling: primary, secondary, tertiary, and quaternary, while ISO 15270 classifies primary and secondary recycling as mechanical recycling, tertiary recycling as chemical recycling, and quaternary recycling as energy recovery [10]. One approach to understanding recycling technologies is by focusing on the output generated after the recycling process. For instance, Letcher [13] classifies plastic recycling methods based on the distinct pathways that lead to various end products.
Polyethylene terephthalate (PET) is a plastic material extensively used, primarily for packaging materials such as bottles and containers for various consumer products [10]. Globally, PET is among the most recycled polymers, with PET bottles reaching a 55% recycling rate in 2013 [14, 15]. The recycling potential of PET notably surpasses that of other common plastic materials due to its compatibility with multiple treatment methods [16, 17].
There are several PET recycling technologies developed and implemented worldwide, including material and chemical recycling. Material recycling of PET, also referred to as mechanical recycling [18], has several benefits such as simplicity, low initial investment, and minimal negative environmental impacts. However, it also has limitations such as the inability to process thermoset PET, and the degradation of product properties with each recycling cycle [19], which can result in lower-quality recycled PET (rPET) [18]. Chemical recycling can yield higher quality rPET but is currently more expensive and less widely available [20]. Additionally, the manufacturing cost of chemical recycling tends to be higher than that of mechanical recycling, limiting its economic attractiveness [19].
Evaluating the impacts of recycling technologies is critical, with comparisons often based on environmental impacts. The Life Cycle Assessment (LCA) is a commonly used method, as demonstrated by Shen et al. [21]. Martin et al. [22] emphasized that recycling PET bottle waste in Brazil consistently outperforms incineration and landfilling, though it necessitates improvements in source separation and recycling cooperative management. Gileno and Turci [23] compared two PET bottle recycling methods in Brazil, both of which have a lower environmental impact than virgin PET, and identified areas for improvement in logistics and industrial processes. Other studies focus on economic aspects, such as cost estimation, profitability, and break-even analysis [24]. Social aspects are also considered, with studies examining the environmental and social impacts of PET bottle disposal alternatives [25].
Notable studies have explored the environmental and economic impacts of PET bottle waste management using various methods and scenarios. Zhang et al. [26] discovered that optimizing production procedures and substituting energy sources in the recycling process in China can mitigate the environmental and economic burdens of manufacturing blankets from recycled PET bottles. Shahbaz et al. [27] demonstrated that pyrolysis, a process that produces value-added products from PET waste, offers environmental and economic benefits, with process simulations aiding in optimizing production parameters. The recycling methods of material and chemical PET in Japan are under investigation, considering various indicators related to the economy, environment, and society [28].
Some literature, albeit limited, has explored public attitudes toward plastic recycling technologies and individual perceptions of chemical recycling. Jones et al. [29] studied attitudes toward gasification, a chemical recycling method, in Germany and the UK using online questionnaires and educational videos. Even though there was limited initial awareness, they identified predominantly favorable opinions on gasification, especially waste-based gasification, with developer trust being a key determinant of attitudes. Similarly, Lee et al. [30] examined stakeholder perceptions of chemical recycling in Germany and its potential to transition carbon-intensive industries toward a circular carbon economy. Through qualitative surveys and workshop discussions, they uncovered stakeholder understanding of chemical recycling, its benefits and challenges, and necessary policy and regulatory measures for effective implementation, providing crucial insights for decision-making and policy formulation.
Understanding stakeholders' perceptions about sustainable indicators is vital, especially when choosing PET recycling technologies. This understanding can enhance decision-making processes for policymakers, industry leaders, and other stakeholders in the plastic recycling field, facilitating the transition toward a circular economy. Nonetheless, there is a significant lack of stakeholder perception surveys focusing on PET recycling technology, especially in Asian countries. Therefore, this research aims to examine variations in preferences for environmental, economic, and social indicators during the process of PET recycling technology selection in the target countries. Comparing the countries can help identify the unique perspectives of plastic recycling in each nation.
2.1 Data collection
An online survey was designed and preliminarily piloted at the Asian Institute of Technology before being rolled out to the research countries. The survey was completed by 154 individuals from the four countries under investigation, representing a variety of informant groups (see Table 1). The survey questionnaire comprised two sections: the respondent's basic information and the perceived importance of each indicator from environmental, economic, and social perspectives when choosing a PET recycling technology.
The first section collected information about the respondent's role within their organization, gender, age, level of education, type of organization, and years of experience in the field of plastic waste management and recycling.
The second section elicited rankings for each indicator. The question, "To what extent do you believe the following criteria are important for decision-making in recycling technology selection?" was posed from environmental, economic, and social perspectives. This section required the respondents to rank each indicator.
Table 2 provides a list of these indicators. The questionnaire was designed so that higher scores would signify greater importance attributed to the indicators. For the environmental and economic aspects, the maximum score was eight, reflecting the presence of eight sub-indicators for each aspect. For the social aspect, the maximum score was five to match the five social sub-indicators.
Table 1. Survey responses
|
Countries |
|||||
|
Stakeholder |
India |
Pakistan |
Sri Lanka |
Thailand |
Total |
|
Government |
6 |
12 |
7 |
18 |
43 |
|
Private sectors |
15 |
9 |
9 |
11 |
44 |
|
Nonprofit organization |
6 |
5 |
3 |
7 |
21 |
|
Research institute |
11 |
9 |
1 |
8 |
29 |
|
Others |
1 |
1 |
8 |
7 |
17 |
|
Total |
39 |
36 |
28 |
51 |
154 |
Table 2. The list of criteria assessed
|
Perspective |
# |
Criteria |
Details |
|
Environmental |
1 |
Global warming potential (GWP) |
This is the warming effect on the earth’s surface arising from the emissions of a gas relative to carbon. |
|
2 |
Total energy demand |
This is the energy usage when each alternative is implemented. |
|
|
3 |
Acidification potential |
This is a measure of the SO2 emissions. Acidification has an important impact on marine, coastal, and freshwater habitats. Calcifying organisms, juvenile stages, and coral reefs ecosystems are particularly vulnerable to this process. Species diversity and ecosystem resilience are expected to decrease in the near future. |
|
|
4 |
Eutrophication potential |
This indicates the enrichment of aquatic ecosystems with nutritional elements (e.g., nitrogen and phosphorus compounds). It causes excessive algae growth, which releases toxins harmful to higher energy forms, and reduces light and oxygen in the water, harming other aquatic life. |
|
|
5 |
Photochemical oxidant formation |
This criterion can be related to air pollution, photochemical oxidant formation, (photochemical) ozone creation, or ozone formation. The photochemical oxidants are secondary air pollutants (also called summer smog) formed by the reaction of sunlight on carbon monoxide, and reactive hydrocarbons (e.g., ethane) in the presence of nitrogen oxides. It is connected in problems of smog, crop damage, and the degradation of works of art. |
|
|
6 |
Abiotic resource depletion |
Abiotic depletion refers to the depletion of nonliving resources such as fossil fuels, minerals, clay, and peat. |
|
|
7 |
Water consumption |
The amount of wastewater consumption across the recycling processes. |
|
|
8 |
Solid waste generation by weight |
The amount of solid waste across the recycling processes. |
|
|
Economic |
9 |
Capital cost |
This is basically the sum of the acquisition costs and assembly of the equipment plus the costs of constructing the infrastructure needed for the operation. |
|
10 |
Operating profit from main recycling business |
This is considered as the profit from selling the recycled products and gate fees in the recycling business. |
|
|
11 |
Profit from other activities |
This refers to the profit generated from non-recycling activities, such as subsidies or other unrelated business operations. |
|
|
12 |
Solid waste treatment cost |
This cost refers to the expenses associated with managing and treating solid waste generated during the recycling process. |
|
|
13 |
Wastewater treatment cost |
This cost refers to the expenses associated with treating and managing the wastewater generated during the recycling process. |
|
|
14 |
Water cost |
Water is often used in recycling processes for cleaning and cooling. |
|
|
15 |
Electricity cost |
Electricity is used to power machinery and equipment in recycling facilities. |
|
|
16 |
Feedstock cost |
Feedstock cost for the recycling. |
|
|
Social |
17 |
Job creation opportunity |
This refers to the employment opportunities generated by a specific management alternative. |
|
18 |
Working environment |
The working environment refers to the physical and psychological aspects of a workplace that can affect employees’ performance, well-being, and overall experience. |
|
|
19 |
Confirming to national/local policy |
This refers to the extent to which each alternative aligns with national or local policies and regulations. |
|
|
20 |
Capacity for managing and accepting each alternative |
The ability to handle and implement different treatment alternatives, considering the resources, infrastructure, and expertise needed. |
|
|
21 |
Corporate social responsibility (CSR) |
This refers to a company’s commitment to ethical, social, and environmental responsibilities, which can include initiatives aimed at improving the well-being of communities, employees, and the planet. |
To select the indicators, we drew upon previous studies and also considered additional indicators based on our insights.
From an environmental perspective, Life Cycle Assessment (LCA) studies served as the foundation for indicator selection, given that LCA is a key method for evaluating the environmental impact of plastic waste management systems [31]. We selected the following seven criteria: Global Warming Potential (GWP), energy requirement, potential for acidification, potential for eutrophication, potential for photochemical oxidant formation, potential for abiotic resource depletion, and potential for solid waste. Given its importance in cleaning contaminated plastic waste and enhancing recycling efficiency, water consumption was also included.
To determine the economic criteria, we reviewed previous comparative studies on waste management options. Gomes et al. [32], Larraine et al. [33], and Valle et al. [34] all consider capital cost, while operational cost is frequently used as a comparison indicator for waste management options [32-35]. To reflect realistic operational practices, we further divided operational cost into feedstock, waste treatment, wastewater treatment, and water and electricity costs for inclusion as criteria. Additionally, we considered the operational profits of both recycling and non-recycling businesses to assess their influence on technology selection.
For social factors, we incorporated literature that compares waste management methods. Both Deshpande et al. [36] and Rochat et al. [37] consider job creation as a criterion in their studies, while Bhagat et al. [38] examine national/local policies. Deshpande et al. [36] and Rochat et al. [37] also refer to the capacity to manage and accept each alternative. Corporate Social Responsibility (CSR) is also seen as a critical factor in promoting recycling, as it can increase the consumption of recycled goods [39]. Moreover, we included working conditions as a criterion, given that employees in the recycling industry often face health risks and severe biological impacts, although these effects have likely not been quantified [40].
Our online survey collected responses from 154 respondents across the four target countries (see Table 1). The private sector provided the highest number of respondents (44), followed by the government sector (43). Additionally, 29 and 21 respondents came from research institutes and the non-profit sector, respectively. By country, Thailand had the highest number of respondents (51), followed by India (39), Pakistan (36), and Sri Lanka (28).
2.2 Data analysis
Both descriptive and inferential analyses were carried out on the survey data. The descriptive analysis was performed to outline the collected variables, while the Kruskal-Wallis H test [41] was applied to investigate the differences in the indicator values across the countries. Following the H test, Dunn’s post-hoc test was used to examine the bilateral differences in all pair-wise comparisons. The Shapiro test [42] was conducted on all the indicators, confirming the nonparametric nature of the variables collected on an ordinal scale and thus justifying the use of the above-mentioned tests.
The H test has been employed in prior studies to analyze perceptions among stakeholders, as these are often measured on an ordinal scale. For instance, Dehghani and Rahmatinia [43] used the H test to compare knowledge and attitudes among hospital workers and educational groups, and analyzed their relationship with the success of a health course. They found no significant difference between the four groups studied. Deveci and Yiğit [44] used the H test to explore students’ preferences for homework across public schools in Turkey, stratified by course. Additionally, Pulur et al. [45] applied the H test to analyze the anxiety levels among national basketball team nominees aged 13 to 15 and compared this across different school types.
The null and alternative hypotheses of our study are as follows:
Null Hypothesis: There is no statistically significant difference across India, Sri Lanka, Pakistan, and Thailand regarding the informants’ perception of environmental, economic, and social criteria for selecting PET recycling technologies.
Alternative Hypothesis: There is a statistically significant difference across India, Sri Lanka, Pakistan, and Thailand regarding the informants’ perception of environmental, economic, and social criteria for selecting PET recycling technologies.
Given the limited sample size and the constraints of the data collection method, this study adopts p < 0.10 as the threshold for statistical significance in the inferential analysis.
Figures 1 to 3 depict the average scores of environmental, economic, and social indicators for each of the four countries under study. Tables 3 and 4 display the top three indicators across all the countries and the results of the H test, respectively.
With regard to environmental criteria, Global Warming Potential (GWP, average score: 5.52) and total energy demand (average score: 5.49) emerged as particularly important across all the countries (see Figure 1 and Table 3).
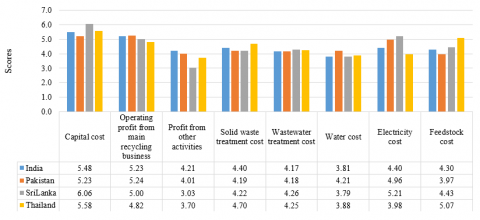
In terms of economic criteria, the capital cost was deemed the most important in all the countries, with the exception of Pakistan, where profit from the recycling business took the top spot (see Figure 2 and Table 3). The Dunn’s test results for electricity cost showed a significant difference between Thailand and Sri Lanka, with Sri Lanka scoring higher (see Table 4).
As for social criteria, job creation opportunities or working environment were generally considered the most important across all the countries (see Figure 3 and Table 3). Confirming national/local policy also consistently ranked third in all four countries. From the social perspectives, Corporate Social Responsibility (CSR) was found to be the least important criterion across these countries. The job creation opportunity criterion revealed that Thailand scored significantly lower than the other countries, while Thailand had a significantly higher score for acceptance capacity compared to India (see Table 4).
Figure 1. Average scores for environmental indicators
Figure 2. Average scores for economic indicators
Figure 3. Average scores for social indicators
Table 3. Ranking of all the indicators in the four countires
|
Perspective |
Ranking |
Country |
||||
|
All Countries |
India |
Pakistan |
Sri Lanka |
Thailand |
||
|
Environmental |
1 |
Total energy demand |
Total energy demand |
Global warming potential, Total energy demand |
Total energy demand |
Global warming potential |
|
2 |
Global warming potential |
Global warming potential |
Global warming potential |
Total energy demand |
||
|
3 |
Water consumption |
Water consumption |
Water consumption |
Water consumption |
Photochemical oxidant formation |
|
|
Economic |
1 |
Capital cost |
Capital cost |
Operating profit from main recycling business |
Capital cost |
Capital cost |
|
2 |
Operating profit from main recycling business |
Operating profit from main recycling business |
Capital cost |
Electricity cost |
Feedstock cost |
|
|
3 |
Electricity cost |
Solid waste treatment cost |
Electricity cost |
Operating profit from main recycling business |
Operating profit from main recycling business |
|
|
Social |
1 |
Working environment |
Job creation opportunity |
Job creation opportunity |
Working environment |
Working environment |
|
2 |
Confirming to national/local policy |
Working environment |
Working environment |
Job creation opportunity |
Capacity for managing and accepting each alternative |
|
|
3 |
Capacity for managing and accepting each alternative |
Confirming to national/local policy |
Confirming to national/local policy |
Confirming to national/local policy |
Confirming to national/local policy |
|
Table 4. The differences in the perceptions across countries based on the Kruskal-Wallis H test and the Dunn’s post-hoc test
|
# |
Aspect |
Criteria |
Dunn’s Test |
H Test |
||||
|
India |
Pakistan |
Sri Lanka |
Thailand |
H Statistic |
p-Value |
|||
|
1 |
Environmental |
Acidification potential |
< Thailand |
× |
< Thailand |
> India & Sri Lanka |
13.45 |
0.003 |
|
2 |
Photochemical oxidant formation |
× |
< Thailand |
× |
> Pakistan |
12.56 |
0.006 |
|
|
3 |
Water consumption |
× |
> Thailand |
× |
< Pakistan |
6.20 |
0.008 |
|
|
4 |
Solid waste generation by weight |
× |
> Thailand |
× |
< Pakistan |
11.89 |
0.043 |
|
|
5 |
Economic |
Profits from profit from other activities |
> Sri Lanka |
× |
< India |
× |
7.45 |
0.058 |
|
6 |
Electricity cost |
× |
× |
> Thailand |
< Sri Lanka |
10.52 |
0.015 |
|
|
7 |
Feedstock cost |
× |
< Thailand |
× |
> Pakistan |
7.74 |
0.052 |
|
|
8 |
Social |
Job creation opportunity |
> Thailand |
> Thailand |
> Thailand |
< India, Pakistan, Sri Lanka |
20.54 |
0.000 |
|
9 |
Capacity for managing and accepting each alternative |
< Thailand |
× |
× |
> India |
11.30 |
0.01 |
|
NB: “<” and “>” indicate the directions (i.e., “smaller than” and “larger than”, respectively) when the differences are statistically significant, while “×” indicates statistical insignificance of the differences, with the threshold at the 10% significance level.
This section provides an analysis of significant indicators to contribute to the strengthening of each country’s plastic recycling initiatives. The identified trends should be incorporated in developing plastic recycling in the respective countries.
4.1 Perception of environmental indicators
GWP was one of the most important environmental indicators, ranking highly in most countries. This is likely due to the numerous studies which have employed GWP as an indicator to measure the environmental impacts of waste management and its effect on informants’ perspectives. For instance, Lazarevic et al. [31] conducted a review of 10 papers to assess the environmental impact categories used for the LCA, with all the articles using GWP as an impact category. Wiesinger et al. [46] conducted a scenario analysis of the historical GWP100 emissions from municipal solid waste in Denmark, concluding that one of the factors contributing to the decrease in GWP100 from 1970 to 2010 was the transition of means of plastic waste management from landfill to recycling. GWP is also used as a key performance indicator in political documents. For example, the Thai government formulated objectives to reduce greenhouse gas (GHG) emissions by 7-20% by 2020 and 25% by 2030. These targets were reaffirmed in the “Intended Nationally Determined Contribution” submitted to the United Nations Framework Convention on Climate Change on October 1, 2016. The waste sector was chosen by the Thai government as a primary area for mitigation enhancement, in conjunction with additional sectors: power generation, transportation, industry, agriculture, forestry, and urban management [47]. In addition, GWP is a major topic when assessing the benefits of plastic recycling. Turner et al. [48] found that the recycling of Low-Density Polyethylene emitted 29 kg CO2e/t, and yet still resulted in a significant reduction in GHG emissions if the waste was properly source segregated.
Total energy demand was found to be the primary factor in India, Pakistan, and Sri Lanka, and the second most significant factor in Thailand. This finding provides an important insight into the development of chemical recycling technology, as the total energy demand can be a key factor of chemical recycling promotion. Nikiema and Asiedu [49] argued that high energy costs can promote the potential for producing energy through chemical recycling. Nevertheless, chemical recycling is highly energy-intensive, making it unsuitable as an environmentally friendly technology. Even if the byproducts are burned for energy generation, no existing chemical recycling technology can yield a net-positive energy balance, and no signs of improvement in this regard can be observed in the foreseeable future [50]. Therefore, for countries promoting chemical recycling, it is essential to create a conducive environment where chemical recycling companies have access to environmentally friendly energy resources for plastic recycling.
In summary, to develop an effective initiative for promotion of plastic recycling, it is essential to clearly elucidate the benefits of implementing recycling technology, such as the reduced GWP and low total energy demand. For instance, the Environmental Protection Agency in the United States has begun to discuss potential regulations on pyrolysis and gasification in chemical recycling, as current regulations do not require chemical recycling to meet pollution standards [51]. This regulation will require chemical recycling facilities to meet the regulation on pollutants including nitrogen oxides, which presents a significant contribution to GWP [52]. This regulation may assist informants in selecting better recycling technologies.
Acidification potential in Thailand was regarded as more important than in India and Sri Lanka when choosing plastic recycling technology. Ocean acidification, which refers to the reduction in the pH of seawater because of increased uptake of CO2 from the air, can have a major effect on the composition and function of marine ecosystems. There is no direct relationship between acidification potential and plastic recycling. However, the findings of the review by Ramesh and Vinodh [52] encompassing the LCA of fossils and biopolymers draw attention to significant environmental concerns related to acidification potential. Numerous studies emphasize the analysis of acidification’s impact when examining the environmental implications of these polymers, primarily attributable to improper waste management practices such as landfilling.
Regarding photochemical oxidant formation, studies have shown that plastics can create volatile organic compounds (VOC) during recycling that can react with nitrogen oxides in the presence of sunlight and form photochemical oxidants like ozone [53]. These photochemical oxidants can cause air pollution with a potential negative impact on human health. Photochemical oxidant formation was considered as more important in Thailand than in Pakistan. As Thailand and Pakistan ratified both the Vienna Convention for the Protection of the Ozone Layer and the Montreal Protocol on Substances that Deplete the Ozone Layer, it is obliged for these countries to phase out chlorofluorocarbons and hydrochlorofluorocarbon chemicals. One of the central goals of the Thai government is to introduce environment-friendly production into the industry and embrace the concept of green industries [54]. This may potentially result in an elevated perception of photochemical oxidants in Thailand, thereby contributing to increased scores in the survey of this study.
In terms of water consumption and plastic recycling technology, Thailand and Pakistan differed significantly in terms of population access to water, and the water dependency ratio. Data from the AQUASTAT Database [55] indicate that, in 2019, 97.8% of the Thai population had access to water, while in Pakistan that figure was 89.9%. The water dependency ratio was 77.7% in Pakistan and 47.8% in Thailand. The higher scores on the importance of water consumption in Pakistan are likely attributed to this difference. This observation suggests that recycling methods reliant on thermal processes may be less favorable in Pakistan, given the substantial volume of waste consumed during the recycling procedure. Furthermore, Thailand and Pakistan had the significant difference in the importance of solid waste generation. This discrepancy may be attributed to the dire state of waste management in Pakistan. A comprehensive solid waste management system is absent in all urban centers within Pakistan. The entire process is inadequately administered, ranging from designated collection sites to transportation and ultimate disposal of solid waste. The accumulated waste is discarded in open areas, subsequently, leading to environmental contamination, and giving rise to a multitude of environmental issues [56]. Given the disparities between Thailand and Pakistan, it is advisable for Pakistan to prioritize the adoption of plastic recycling technologies that consume less water and generate less solid waste.
4.2 Perception of economic indicators
Thailand, India, and Sri Lanka displayed the highest scores on capital costs among other economic indicators, which is aligned with more favorable perceptions of material recycling. Nikiema and Asiedu [49] note that the high implementation cost is a limiting factor for application of chemical recycling, while affordability is a key driver for material recycling. They further report that the investment cost to process 1 MT/day for material recycling is estimated to be between USD 2,000 and 10,000, while the cost for chemical recycling is estimated at USD 857,000. To overcome the high capital cost of chemical recycling, government support can be useful. For example, the Japanese government provides financial support to adopt the advanced equipment for plastic recycling which contributes to the reduction of CO2 emissions [57].
Besides, the profitability of recycling businesses was highlighted as a key indicator when evaluating the recycling technologies in the four countries. Material recycling of plastics can be more cost-effective when the costs of sorting and waste management are kept to a minimum and value chains are effective for collecting quality plastic materials. On the other hand, chemical recycling plants are financially viable only when large volumes of plastics are processed with the price of outputs being competitive against crude oil [49]. In other words, the market for recycled products should be guaranteed. Obstacles recognized in the recycled plastics in Norwegian countries encompass the insufficiency in the procurement and requisition of recycled plastics, predominantly ascribed to the compartmentalized market of supplementary materials [39].
Consequently, considering the importance of capital costs and operating profit of recycling businesses among the informants, these factors should be taken into consideration by the focal countries. Specifically, to promote material recycling, governments should explore methods to reduce the costs associated with sorting and separation. This reduction can greatly benefit the operating profit of the main recycling business. Moreover, in the promotion of chemical recycling, it is crucial to establish an enabling environment that minimizes capital costs and ensures the profitability of the products generated through recycling.
India’s score for profits from other businesses was considerably higher than Sri Lanka’s. This can be attributed to the public’s expectations of their respective governments. In Sri Lanka, the country’s bankruptcy and debt crisis are projected to continue until 2026 [58], with low expectations of financial support from the government. Conversely, the government of India is expected to provide financial support to the plastic recycling industry. For instance, the Energy and Resources Institute, a leading think tank, proposes a National Plastic Recycling Fund, which would provide an institutional mechanism for the collection and recycling of plastic waste, creating enterprises and providing monetary incentives to waste collectors and recyclers [59].
The electricity cost was deemed to be of particular importance in Sri Lanka when selecting plastic recycling technologies, compared to Thailand. This can be due to the greater impact of electricity costs on the lives of those in Sri Lanka. According to the International Energy Agency (IEA), the average electricity cost in Thailand was USD 0.072 (7.2 baht) per kilowatt-hour (kWh), whereas the World Bank states that the average electricity cost in Sri Lanka was USD 0.085 (8.5 Sri Lankan rupees) per kWh [60]. According to the GDP per capita based on the purchasing power parity, Sri Lanka has USD 5,069 whereas Thailand has USD 8,739, indicating that electricity costs are a greater burden for Sri Lankan people as compared to Thai people [61].
The score for feedstock cost was significantly higher in Thailand than in Pakistan. This may be related to Thailand’s ban on plastic imports. For instance, due to import restrictions, the scarcity of imported feedstock has hindered recyclers of all sizes from maximizing their operational capabilities, combining high-quality imported feedstock with domestic feedstock, and producing higher value products [62]. The differences in economic indicators between the countries would suggest considering incentives to reduce electricity costs in Sri Lanka and feedstock costs in Thailand.
4.3 Perception of social indicators
In Sri Lanka and Thailand, working environments were deemed as the most important in the selection of plastic recycling, whereas it was perceived as the second most significant indicator in India and Pakistan. The identified importance may be attributed to the high level of risk awareness in these countries. The use of machinery, tools, and other heavy equipment for processing plastic necessitates a safe and secure working environment. For instance, at Swedish recycling centers, investigations found that physically demanding tasks such as lifting heavy waste and correcting misplaced waste pose the highest risk of injuries. The frequency of both major and minor injuries is high in the recycling industry [63].
The findings indicate that job creation opportunities are viewed as a more important factor in India, Sri Lanka, and Pakistan than in Thailand. This is likely due to the lower unemployment rate in Thailand (1.4%) in comparison to the higher rates in India (6.4%), Sri Lanka (4.6%), and Pakistan (6.5%) [64]. Job creation opportunities were ranked first in India and Pakistan and second in Sri Lanka, which implies that promotion of PET recycling technology requires to emphasize job creation opportunities in these countries.
Despite the growing importance of sustainable recycling practices for plastic waste management, there is a research gap in stakeholders’ perceptions of plastic recycling technologies, which could otherwise enhance decision-making processes for policymakers and industry leaders to accelerate the transition toward a circular economy. This study administered an online survey with 154 key informants to evaluate the significance of environmental, economic, and social criteria in selecting plastic recycling technology in India, Sri Lanka, Pakistan, and Thailand. Descriptive and inferential analyses were employed to examine the data collected from the survey.
The findings from this research indicate that to effectively promote PET recycling technologies, capital cost and profit of recycling businesses should be considered alongside two social indicators: working environment and job creation opportunities. Total energy usage and the potential for global warming received the attention as an environmental indicator.
With regard to the distinction between the countries, Pakistani informants were more attentive to water consumption and the generation of solid waste from the environmental perspective, in comparison to Thailand, presumably due to the lack of available water and the profusion of improper waste. Conversely, Thai informants are more aware of acidification potential and photochemical oxidant formation as compared to India, Sri Lanka, and Pakistan in terms of recycling technology selection. From the economic standpoint, Indian informants anticipate gaining profit from non-recycling activities such as subsidies, in comparison to Sri Lanka. The electricity cost may influence the informants’ perspectives when selecting plastic recycling technologies, given Sri Lanka’s higher score. Lastly, the higher unemployment rate may be linked to the increased importance of job opportunities in selecting plastic recycling technologies.
To increase plastic recycling to deal with the current plastic waste pollution, the indicators with higher scores should be emphasized in promotion of the implementation of PET recycling technologies, reflecting the key informants’ perspectives.
This study has certain limitations. First, the quality of the responses from the informants may not be high. It is important to note the diverse understanding of plastic recycling technologies among the informants, and the structure of the survey did not necessarily account for such differences, which may have affected the accuracy of the elicited data. Second, the survey respondents were sampled through snowball networking, which implies that the sample may not be representative of the population of relevant informants. Future research should consider accounting for the diverse understanding of plastic recycling technologies among informants and using a more representative sample to enhance the accuracy of responses and external validity of the findings.
[1] Boucher, J., Friot, D. (2017). Primary microplastics in the oceans: A global evaluation of sources. International Union for Conservation of Nature. https://doi.org/10.2305/IUCN.CH.2017.01.en
[2] Akenji, L., Bengtsson, M., Hotta, Y., Kato, M., Hengesbaugh, M. (2020). Policy responses to plastic pollution in Asia. In Plastic Waste and Recycling, pp. 531-567. https://doi.org/10.1016/B978-0-12-817880-5.00021-9
[3] Meijer, L.J.J., van Emmerik, T., van der Ent, R., Schmidt, C., Lebreton, L. (2021). More than 1000 rivers account for 80% of global riverine plastic emissions into the ocean. Science Advances, 7(18): eaaz5803. https://doi.org/10.1126/sciadv.aaz5803
[4] Sevanatha Urban Resource Centre. (2019). Sustainable low-income settlements: Lessons from Sri Lanka. https://urban-links.org/wp-content/uploads/SL-Sevanatha_6-13-19.pdf.
[5] Agamuthu, P., Herat, S. (2014). Sustainable waste management in small island developing states (SIDS). Waste Management & Research: The Journal for a Sustainable Circular Economy, 32(8): 681-682. https://doi.org/10.1177/0734242X14544869
[6] World Bank. (2021). Market study for Thailand plastics circularity: Opportunities and barriers. https://www.worldbank.org/en/country/thailand/publication/market-study-for-thailand-plastics-circularity-opportunities-and-barriers.
[7] Singh, S.G. (2021). Plastic recycling: decoded. centre for science and environment (CSE). Plastic recycling: decoded. centre for science and environment.
[8] Ministry of Environment. (2021). National Action plan on plastic waste management 2021-2030. "Sobadam Piyasa", Robert Gunawardana Mawatha, Battaramulla, Sri Lanka. https://ccet.jp/sites/default/files/2021-08/srilanka_report_web_fin_pw.pdf.
[9] Jamal, S. (2021). Pakistan to support innovative recycling solutions to tackle plastic pollution. Pakistan - Gulf News. https://gulfnews.com/world/asia/pakistan/pakistan-to-support-innovative-recycling-solutions-to-tackle-plastic-pollution-1.77373360.
[10] Hopewell, J., Dvorak, R., Kosior, E. (2009). Plastics recycling: Challenges and opportunities. Philosophical Transactions of the Royal Society B: Biological Sciences, 364(1526): 2115-2126. https://doi.org/10.1098/rstb.2008.0311
[11] Van Schoubroeck, S., Springael, J., Van Dael, M., Malina, R., Van Passel, S. (2019). Sustainability indicators for biobased chemicals: A Delphi study using Multi-Criteria Decision Analysis. Resources, Conservation and Recycling, 144: 198-208. https://doi.org/10.1016/j.resconrec.2018.12.024
[12] Ross, S., Evans, D. (2003). The environmental effect of reusing and recycling a plastic-based packaging system. Journal of Cleaner Production, 11(5): 561-571. https://doi.org/10.1016/S0959-6526(02)00089-6
[13] Letcher, T.M. (2020). Chapter 1—Introduction to plastic waste and recycling. In Plastic Waste and Recycling, pp. 3-12. Academic Press. https://doi.org/10.1016/B978-0-12-817880-5.00001-3
[14] Bhanderi, K.K., Joshi, J.R., Patel, J.V. (2023). Recycling of polyethylene terephthalate (PET Or PETE) plastics - An alternative to obtain value added products: A review. Journal of the Indian Chemical Society, 100(1): 100843. https://doi.org/10.1016/j.jics.2022.100843
[15] Statista. (2022). Plastic packaging and PET bottles recycling rate worldwide from 2015 to 2021 [Data set]. https://www.statista.com/statistics/504529/plastic-packaging-and-pet-bottles-recycling-rate-worldwide/.
[16] Brivio, L., Tollini, F. (2022). Chapter Six - PET recycling: Review of the current available technologies and industrial perspectives. In Advances in Chemical Engineering, pp. 215-267. https://doi.org/10.1016/bs.ache.2022.09.003
[17] Nikles, D.E., Farahat, M.S. (2005). New motivation for the depolymerization products derived from poly (Ethylene Terephthalate) (PET) waste: A review. Macromolecular Materials and Engineering, 290(1): 13-30. https://doi.org/10.1002/mame.200400186
[18] Al-Salem, S.M., Lettieri, P., Baeyens, J. (2009). Recycling and recovery routes of plastic solid waste (PSW): A review. Waste Management, 29(10): 2625-2643. https://doi.org/10.1016/j.wasman.2009.06.004
[19] Raheem, A.B., Noor, Z.Z., Hassan, A., Abd Hamid, M.K., Samsudin, S.A., Sabeen, A.H. (2019). Current developments in chemical recycling of post-consumer polyethylene terephthalate wastes for new materials production: A review. Journal of Cleaner Production, 225: 1052-1064. https://doi.org/10.1016/j.jclepro.2019.04.019
[20] George, N., Kurian, T. (2014). Recent developments in the chemical recycling of postconsumer poly (ethylene terephthalate) waste. Industrial & Engineering Chemistry Research, 53(37): 14185-14198. https://doi.org/10.1021/ie501995m
[21] Shen, L., Worrell, E., Patel, M.K. (2010). Open-loop recycling: A LCA case study of PET bottle-to-fibre recycling. Resources, Conservation and Recycling, 55(1): 34-52. https://doi.org/10.1016/j.resconrec.2010.06.014
[22] Martin, E.J.P., Oliveira, D.S.BL., Oliveira, L.S.B.L., Bezerra, B.S. (2021). Life cycle comparative assessment of pet bottle waste management options: A case study for the city of Bauru, Brazil. Waste Management, 119: 226-234. https://doi.org/10.1016/j.wasman.2020.08.041
[23] Gileno, L.A., Turci, L.F.R. (2021). Life cycle assessment for PET-bottle recycling in Brazil: B2B and B2F routes. Cleaner Environmental Systems, 3: 100057. https://doi.org/10.1016/j.cesys.2021.100057
[24] Diware, D.V., Goje, A., Mishra, D.S. (2014). Study of profitability and break-even analysis for glycolytic depolymerization of poly (Ethylene terephthalate) (PET) waste during chemical recycling of value added monomeric products. http://ijssbt.org/volume1.1/pdf/7%20Study%20of%20Profitability%20and%20Break-Even%20Analysis.pdf.
[25] Foolmaun, R.K., Ramjeeawon, T. (2013). Comparative life cycle assessment and social life cycle assessment of used polyethylene terephthalate (PET) bottles in Mauritius. The International Journal of Life Cycle Assessment, 18(1): 155-171. https://doi.org/10.1007/s11367-012-0447-2
[26] Zhang, R., Ma, X., Shen, X., Zhai, Y., Zhang, T., Ji, C., Hong, J. (2020). PET bottles recycling in China: An LCA coupled with LCC case study of blanket production made of waste PET bottles. Journal of Environmental Management, 260: 110062. https://doi.org/10.1016/j.jenvman.2019.110062
[27] Shahbaz, M., AlNouss, A., Mckay, G., Mackey, H., Ansari, T.A. (2022). Techno-economic and environmental analysis of pyrolysis process simulation for plastic (PET) waste. In Computer Aided Chemical Engineering, pp. 115-120. https://doi.org/10.1016/B978-0-323-95879-0.50020-5
[28] Ono, S., Tsusaka, T.W. (2023). Assessing the selection of pet recycling options in japan: Multi-criteria decision analysis. Polish Journal of Environmental Studies, 32(5): 1-10. https://doi.org/10.15244/pjoes/167400
[29] Jones, C.R., Lee, R.P., Kaklamanou, D. (2022). Understanding public perceptions of chemical recycling: A comparative study of public attitudes towards coal and waste gasification in Germany and the United Kingdom. Sustainable Production and Consumption, 32: 125-135. https://doi.org/10.1016/j.spc.2022.04.011
[30] Lee, R.P., Tschoepe, M., Voss, R. (2021). Perception of chemical recycling and its role in the transition towards a circular carbon economy: A case study in Germany. Waste Management, 125: 280-292. https://doi.org/10.1016/j.wasman.2021.02.041
[31] Lazarevic, D., Aoustin, E., Buclet, N., Brandt, N. (2010). Plastic waste management in the context of a European recycling society: Comparing results and uncertainties in a life cycle perspective. Resources, Conservation and Recycling, 55(2): 246-259. https://doi.org/10.1016/j.resconrec.2010.09.014
[32] Gomes, C., Nunes, K., Helenaxavier, L., Cardoso, R., Valle, R. (2008). Multicriteria decision making applied to waste recycling in Brazil☆. Omega, 36(3): 395-404. https://doi.org/10.1016/j.omega.2006.07.009
[33] Larrain, M., Van Passel, S., Thomassen, G., Van Gorp, B., Nhu, T.T., Huysveld, S., Van Geem, K.M., De Meester, S., Billen, P. (2021). Techno-economic assessment of mechanical recycling of challenging post-consumer plastic packaging waste. Resources, Conservation and Recycling, 170: 105607. https://doi.org/10.1016/j.resconrec.2021.105607
[34] Valle, R., Cardoso, R., Xavier, L.H., Gomes, C.F.S. (2004). Multiple criteria decision making and environmental impact assessment for destination of plastic material waste through thor system.
[35] Coban, A., Ertis, I.F., Cavdaroglu, N.A. (2018). Municipal solid waste management via multi-criteria decision making methods: A case study in Istanbul, Turkey A. Çoban, Irem Firtina Ertis, N. Çavdaroğlu Publis. Journal of Cleaner Production, 180: 159-167. https://doi.org/10.1016/j.jclepro.2018.01.130
[36] Deshpande, P.C., Skaar, C., Brattebø, H., Fet, A.M. (2020). Multi-criteria decision analysis (MCDA) method for assessing the sustainability of end-of-life alternatives for waste plastics: A case study of Norway. Science of The Total Environment, 719: 137353. https://doi.org/10.1016/j.scitotenv.2020.137353
[37] Rochat, D., Binder, C.R., Diaz, J., Jolliet, O. (2013). Combining material flow analysis, life cycle assessment, and multiattribute utility theory: Assessment of end-of-life scenarios for polyethylene terephthalate in tunja, Colombia. Journal of Industrial Ecology, 17(5): 642-655. https://doi.org/10.1111/jiec.12025
[38] Bhagat, S., Bhardawaj, A., Mittal, P., Chandak, P., Akhtar, M., Sharma, P. (2016). Evaluating plastic waste disposal options in Delhi to arrest soil contamination using multi criteria decision analysis. IIOAB Journal, 7: 25-35.
[39] Milios, L., Holm Christensen, L., McKinnon, D., Christensen, C., Rasch, M.K., Hallstrøm Eriksen, M. (2018). Plastic recycling in the Nordics: A value chain market analysis. Waste Management, 76: 180-189. https://doi.org/10.1016/j.wasman.2018.03.034
[40] Poole, C.J.M., Basu, S. (2017). Systematic Review: Occupational illness in the waste and recycling sector. Occupational Medicine (Oxford, England), 67(8): 626-636. https://doi.org/10.1093/occmed/kqx153
[41] Chan, Y., Walmsley, R.P. (1997). Learning and understanding the kruskal-wallis one-way analysis-of-variance-by-ranks test for differences among three or more independent groups. Physical Therapy, 77(12): 1755-1761. https://doi.org/10.1093/ptj/77.12.1755
[42] Royston, J.P. (1982). An extension of shapiro and wilk’s W test for normality to large samples. Applied Statistics, 31(2): 115. https://doi.org/10.2307/2347973
[43] Dehghani, M.H., Rahmatinia, M. (2018). Dataset on the knowledge, attitude, and practices of biomedical waste management among Tehran hospital׳s healthcare personnel. Data in Brief, 20: 219-225. https://doi.org/10.1016/j.dib.2018.08.002
[44] Deveci, I., Yiğit, N. (2015). The homework assignment preferences of middle school students in science course in Turkey. Journal of Elementary Education, 25(2): 1-26.
[45] Pulur, A., Karabulut, E., Uzun, A., Eroğlu, K. (2014). Examination of the trait anxiety levels among male basketball players in the ages from 13 to 15 in view of various variables. Turkish Journal of Sport and Exercise, 14(3): Article 3. https://doi.org/10.15314/tjse.97893
[46] Wiesinger, H., Wang, Z., Hellweg, S. (2021). Deep dive into plastic monomers, additives, and processing aids. Environmental Science & Technology, 55(13): 9339-9351. https://doi.org/10.1021/acs.est.1c00976
[47] Wichai-utcha, N., Chavalparit, O. (2019). 3Rs Policy and plastic waste management in Thailand. Journal of Material Cycles and Waste Management, 21(1): 10-22. https://doi.org/10.1007/s10163-018-0781-y
[48] Turner, D.A., Williams, I.D., Kemp, S. (2015). Greenhouse gas emission factors for recycling of source-segregated waste materials. Resources, Conservation and Recycling, 105: 186-197. https://doi.org/10.1016/j.resconrec.2015.10.026
[49] Nikiema, J., Asiedu, Z. (2022). A review of the cost and effectiveness of solutions to address plastic pollution. Environmental Science and Pollution Research, 29(17): 24547-24573. https://doi.org/10.1007/s11356-021-18038-5
[50] Tabrizi, S., Rollinson, A.N, Hoffmann, M., Favoino, E. (2020). Understanding the environmental impacts of chemical recycling. https://eeb.org/library/understanding-the-environmental-impacts-of-chemical-recycling/.
[51] Grose, J. (2021). EPA might finally regulate the plastic industry’s favorite kind of recycling. https://grist.org/regulation/epa-might-finally-regulate-the-plastic-industrys-favorite-kind-of-recycling/.
[52] Ramesh, P., Vinodh, S. (2020). State of art review on life cycle assessment of polymers. International Journal of Sustainable Engineering, 13(6): 411-422. https://doi.org/10.1080/19397038.2020.1802623
[53] Fehsenfeld, F., Calvert, J., Fall, R., Goldan, P., Guenther, A.B., Hewitt, C.N., Lamb, B., Liu, S., Trainer, M., Westberg, H., Zimmerman, P. (1992). Emissions of volatile organic compounds from vegetation and the implications for atmospheric chemistry. Global Biogeochemical Cycles, 6(4): 389-430. https://doi.org/10.1029/92GB02125
[54] World Bank. (2020). Partnering with industries for sustainable ozone protection and climate change mitigation in Thailand. https://www.worldbank.org/en/results/2020/02/03/partnering-with-industries-for-sustainable-ozone-protection-and-climate-change-mitigation-in-thailand.
[55] Food and Agriculture Organization of the United Nations (FAO). (2023). AQUASTAT database. https://wbwaterdata.org/dataset/aquastat-database/resource/ddf5d63e-3774-4b37-9232-6243f49586d9.
[56] Manzoor, M., Gul, I., Iqrar, I., Arshad, M. (2020). Solid waste management practices in pakistan. in sustainable waste management challenges in developing countries. IGI Global, pp. 248-269. https://doi.org/10.4018/978-1-7998-0198-6.ch010
[57] Japan Waste Research Foundation. (2023). End of acceptance for the project to promote the introduction of advanced resource circulation equipment for building a decarbonized society. https://www.jwrf.or.jp/individual/prj_000821.html.
[58] Agence France-Presse. (2023). Sri Lanka bankruptcy to last until 2026: President. https://www.zawya.com/en/world/indian-sub-continent/sri-lanka-bankruptcy-to-last-until-2026-president-a6mv0j2d.
[59] The Energy and Resources Institute (TERI). (2020). Green is the only way to grow: 7 ideas for Budget 2020. https://www.teriin.org/press-release/green-only-way-grow-7-ideas-budget-2020.
[60] International Energy Agency. (2023). Countries. https://www.iea.org/countries.
[61] NationMaster. (2023). Economy: Sri Lanka and Thailand compared. https://www.nationmaster.com/country-info/compare/Sri-Lanka/Thailand/Economy.
[62] World Bank. (2021). Market study for Thailand plastics circularity: Opportunities and barriers. https://www.worldbank.org/en/country/thailand/publication/market-study-for-thailand-plastics-circularity-opportunities-and-barriers.
[63] Engkvist, I.L. (2010). Working conditions at recycling centres in Sweden - Physical and psychosocial work environment. Applied Ergonomics, 41(3): 347-354. https://doi.org/10.1016/j.apergo.2009.06.008
[64] Trading Economics. (2023). Unemployment rate by country in Asia. https://tradingeconomics.com/country-list/unemployment-rate?continent=asia.