Abdulrazak Nur Mohamed*![]() | Abdikani Yusuf Abdulle
| Abdikani Yusuf Abdulle![]()
© 2023 IIETA. This article is published by IIETA and is licensed under the CC BY 4.0 license (http://creativecommons.org/licenses/by/4.0/).
OPEN ACCESS
With the recent worldwide financial crisis, government debt has become a focal point of economic attention. This fundamental economic concept reflects the amount a nation owes in international loans. Rapid loan accumulation has brought Somalia's economy to the brink of a debt crisis, threatening the long-term economic stability of the region. This study examines the asymmetric relationship between government debt and GDP growth in Somalia from 1980 to 2020. It employs non-linear autoregressive distributed lag (NARDL) methods to investigate the asymmetric effects of government debt on GDP growth. The findings indicate a negative relationship between government debt and GDP growth; an increase in government debt significantly impairs GDP growth. The estimated long-run parameters for negative shocks to government debt are -0.711 and -2.88, respectively, suggesting that a decrease in government debt will lead to an increase in GDP growth. These results argue that for Somalia to stimulate GDP growth, it must maintain its obligations at a rational level and strive for fiscal sustainability. Policy implications include fiscal debt management, prioritizing public investments, and increasing revenue through tax reforms, anti-corruption measures, and promoting business initiatives to finance public investments and reduce debt.
economic growth, fiscal policy, government debt, non-linear, Somalia
In light of the recent worldwide financial crisis, government debt, a fundamental economic concept, has been a primary focus of economic attention over the last ten years. This debt represents the amount a nation owes in loans worldwide, to entities ranging from individuals and corporations to other governments. The terms 'sovereign debt' and 'government debt' are often used interchangeably. Typically, 'government debt' refers only to national debt, though some countries also include debts owed by municipalities, states, and provinces. Therefore, when comparing government debt across nations, it's crucial to use consistent terminology.
Regardless of its label, government debt is essentially an accumulation of the annual budget deficit. It arises when government officials spend more money than they collect in taxes over a period of time. According to the International Monetary Fund's 2021 report, the global debt surged to \$226 trillion, or 256% of GDP, in 2020 as countries grappled with the pandemic [1]. Additionally, while global public debt rose by 20%, government borrowing accounted for just over half of this increase. This marks a significant cumulative growth since the global financial crisis, with the public debt's share of total debt swelling to levels unseen in more than 50 years. In 2020, private debt grew by 10%, largely due to support from governments and central banks.
However, the growth in debt has varied dramatically between nations due to the vastly different abilities of governments and central banks to assist citizens and companies during the pandemic and the severe economic downturn. For instance, Greece has been in debt for many years and has struggled to repay its creditors since it became the epicenter of the global crisis in 2008/2009. The IMF provided a rescue package, and numerous major European banks extended loans. Greece's national debt, which exceeds its GDP, has not recovered; it has continued to rise over the past few years and remains uncontrolled even a decade later. Greece's national debt, amounting to 205.6% of its gross domestic product, was the highest in the European Union.
In Sub-Saharan Africa, low- and middle-income countries saw a massive increase in debt, reaching \$702 billion in 2020 [2]. In Somalia, the economy and human capital have suffered immense losses due to a prolonged civil conflict. Although macroeconomic conditions are gradually improving, Somalia remains fragile and highly vulnerable to security and climatic shocks. Frequent climatic shocks have directly affected agricultural, fishery, and livestock operations, which constitute most of the economic activity, and have exacerbated the existing vulnerabilities. These conditions justify the staff's tailored shock scenarios. Nevertheless, significant foreign aid has been extended in recent years to promote social and economic stability and to rebuild institutions.
Improved conditions have contributed to favorable real growth rates, averaging approximately 2.5% between 2013 and 2018, with an anticipated increase to around 3.5% in the mid-term. Since 1980, Somalia has not taken out any international loans, yet the country bears a considerable burden of foreign government debt. From 1991 onwards, this debt, including arrears and late fees, has steadily increased. The principal amount overdue comprises \$1.7 billion of the current \$4.5 billion debt, with unpaid interest accounting for \$1.0 billion and late interest submission penalties amounting to $1.8 billion. The largest proportion of the debt is owed to the Paris Club (53%), followed by multilateral creditors (32%) and non-Paris Club bilateral creditors (14%). The total domestic debt, representing 15% of the overdue central government amount, accounts for 1.5% of GDP.
According to a World Bank report in 2015, Somalia's gross foreign debt was projected to rise to approximately 128% of GDP by 2039. Furthermore, according to the World Bank's Criminal Procedure and Investigations Act, Somalia's debt-carrying capacity is weak. Main threats to the outlook include instability, external financing, and the economy, further emphasizing the unsustainability of the current debt load in Somalia. A rapid accumulation of loans has pushed Somalia's economy towards a debt crisis, threatening the region's long-term economic stability. Most foreign debt was used to finance ambitious public investment programs, and from 1960 until the late 1980s, a large portion of the foreign debt financed the government's military expenditure.
Currently, Somalia's foreign public debt is unsustainable, and the country is in financial distress due to the large proportion of debt in arrears compared to GDP. This research investigates the asymmetric relationship between government debt and GDP growth in Somalia. Moreover, the study aims to determine the strength of the relationship between government debt and economic growth, and how government debt affects short and long-term GDP in Somalia.
The remainder of the article is organized as follows: Section 2 briefly reviews the literature examining the relationship between government debt and economic growth, discussing whether these relationships are negative or positive, and whether causality is unidirectional, bidirectional, or exhibits mixed relations. Section 3 presents the methodology, model specifications, and data. Section 4 is dedicated to the empirical analysis, discussing methodological issues and study findings. Finally, Section 5 concludes the study and offers recommendations.
The data suggests that Somalia's economy is becoming increasingly dependent on external debt. As one of the least developed economies, Somalia relies on foreign debt to correct economic disruptions and enhance societal welfare. However, growing dependence on foreign debt may lead to future difficulties in debt repayment, thus increasing the burden. The primary aim of this paper is to examine the asymmetric effects of Somalia's government debt on economic growth over the period from 1980 to 2020.
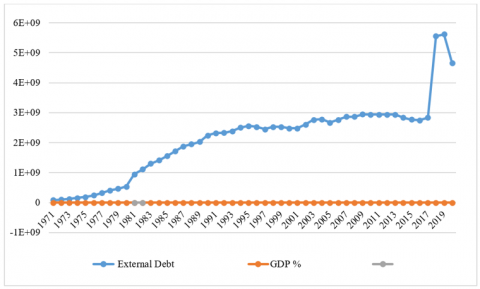
As shown in Figure 1, public debt grew slowly between 1975 and 1980, increasing to a high of 71% in 1980. It also rose sharply to 17.4% in 1991. Furthermore, Figure 1 illustrates that government debt as a percentage of GDP climbed rapidly from 17% in 1993 to 28.4% in 2005. Somalia's external debt for 2020 was \$4,659,652,465, a 17.11% decrease from 2019. Meanwhile, 2019's external debt was \$5,621,339,497, a 1.13% increase from 2018. Furthermore, Somalia's external debt for 2018 was \$5,558,434,813, representing a 96.17% increase from 2017. Somalia's external debt for 2017 was \$2,833,531,570, a 3.24% increase from 2016.
Much research has connected the relationship between government debt and economic growth. Developed and developing countries have examined how these two elements are related. Time series, cross-sections, or panel data have all been used in studies on the connections between government debt and economic progress in developed and developing countries. Yusuf and Mohd [3] used the Autoregression Distributed Lag model to analyze the effect of public debt on Nigeria's economic growth using annual data from 1980 to 2018. The empirical results showed that the short-term effects of foreign debt were growth-enhancing, and the long-term effects were growth inhibitors. The long-term benefits of domestic debt outweigh any short-term drawbacks. Long-term and short-term growth were equally slowed down by debt service payments, demonstrating the impact of the debt overhang. Asteriou et al. [4] examined the impact of public debt on short- and long-term economic growth in 14 Asian countries between 1980 and 2012. The authors use an ARDL model, and a mean group (MG) estimate to account for heterogeneity in the short-run and long-run links. Control factors like average years of schooling, trade openness, and investment ratios are included in the model to counteract the bias from missing data. The authors estimate that a one percentage point increase in the government debt-to-GDP ratio would cause economic growth to fall by 0.012 to 0.125 percentage points. Long-term magnitude differences between the two regimes are slightly more significant, ranging from 0.091 to 0.132 percentage points, indicating that an increase in public debt will significantly negatively affect economic growth.
Salmon [5] concluded that public debt negatively affects growth using AMECO data. The sample comprises 12 countries that are members of the Eurozone from 1995 to 2016. The study used a modified least squares approach for its time series analysis. As control variables, we employ investment, human capital, trade openness, and a dummy variable for the global financial and economic crisis of 2009. According to the authors, the cornerstone of national monetary policy in the Eurozone should be fiscal consolidation. Ghourchian and Yilmazkuday [6] used two-stage least squares techniques and similar control variables to examine government consumption and debt's effects on economic growth in 83 countries from 1960 to 2014. According to the research, an increase of 1 percentage point in the ratio of government debt to GDP would, on average, across all countries, result in a 0.01 percentage point decline in real GDP growth. In comparison, an increase of 1 percentage point in the ratio of government consumption to GDP would result in a 0.1 percentage point decline in real economic growth.
Lim [7] revisits the relationship between debt and growth from a perspective that fully accounts for private and state debt. The study sample spans the years 1952 to 2016 and includes 41 countries. It begins with a baseline vector autoregression (VAR) model and estimates the panel VAR using the expanded approach of moments (GMM). Lim claims that there is a negative correlation between the rate of total debt generation and economic growth, with everyone standard deviation rising in the former resulting in a 0.2 percentage point reduction in the latter. In Namibia, research conducted by Amwaama [8] uses the Auto-Regression Distributed Lag (ARDL) bound tests and utilizes quarterly data from 1993Q4 to 2015Q5. The results demonstrated that the budget deficit harmed the growth rate in the long and short periods. This research differs from past investigations of the relationship between Namibian government debt and economic growth. The current study advances the discipline in the ways listed below. It begins by offering reasonable policy recommendations by looking at the relationship between public debt and economic growth using the most up-to-date robust econometrics methodologies.
Between 1995 and 2015, Sharaf [9] examined how public debt affected the economies of six ASEAN countries: Indonesia, Malaysia, the Philippines, Singapore, Thailand, and Vietnam. The General Method of Moments (GMM) estimation technique was employed to determine how government debt indicators affected economic growth. The results indicated that although population growth significantly negatively impacts these countries' development, public debt, gross fixed capital formation (GFCF), foreign direct investment (FDI), and the real effective exchange rate positively impacted economic development. The report's foundation is statistics from ASEAN countries, which cannot be applied to Nigeria. The impact of government debt on Nigeria's economic expansion was studied by Didia and Ayokunle [10] the research used annual data from 1982 to 2017 using a two-stage least square regression technique. In the study, savings, capital expenditures, domestic debt, and foreign debt were all simulated as functions of GDP. The findings demonstrated that internal debt positively impacted growth, but external debt significantly negatively affected it. The research suffered from considerable variable omission bias since the method utilized to account for the intricate interactions between the examined variables was insufficient.
In Nigeria, Elom-Obed et al. [11] examined the relationship between Nigeria's public debt and economic progress using annual data from 1980 to 2015 and the Vector Error Correction Model (VECM). The parameters included in the analysis were RGDP, foreign debt, domestic debt, and domestic private savings. Because of the research's poor estimating methodology and substantial variable omission bias, it was difficult to get precise coefficient values for the study variables. The study's findings demonstrated how domestic and foreign debt seriously impedes Nigeria's economic development. Makhoba et al. [12] assessed the effect of public debt on Malaysia's sustainable economic growth from 1970 to 2015. This study used the Autoregression Distribution Lage (ARDL) approach to explore the dynamic relationship between public debt and economic growth. The results showed a one-way causal link between rising GDP and rising state debt. The value findings of this study were significant. Actions state that increasing government debt is a critical macroeconomic element for stimulating economic activity conducive to long-term growth. The investigation did not turn up any data from which it could infer conclusions about when public debt begins to hamper long-term economic growth.
Kur et al. [2] examined the relationship between government debt and economic progress in nations in the Eurozone using time series data spanning the years 1961 to 2013. Using the Auto-Regression Distributed Lag (ARDL) method, the link between the two variables, government debt, and economic growth, was investigated. The results showed that public debt significantly impacts the long-term performance of euro area member states. Still, depending on the pace of national economic growth, the short-term consequences could be favorable. The research carried out in European countries provides a framework for examining how public debt impacts economic growth in Nigeria. Ordinary Least Square (OLS) analysis was performed by Shoewu et al. [13] to examine the impact of foreign debt on Nigeria's economic growth using annual data from 1980 to 2013. The study focused on external debt as a proportion of overall debt stock and used the OLS estimating technique, which cannot distinguish between the long- and short-run effects of foreign debt on growth. The supply of foreign debt, the cost of debt payment, and the exchange rate are all independent variables, while GDP was a dependent variable. The empirical results showed that although the stock of foreign debt and debt service payments had a negative impact on growth, the exchange rate had a positive impact.
Olamide and Maredza [14] looked at the effect of state debt on real economic growth in South Africa from 1980 to 2014. The empirical results demonstrated that South Africa's economy is now doing badly, and this conclusion is statistically significant. Inflation and trade openness are used as the two macroeconomics control variables in the smooth transition regression (STR) model, and it is shown that the link between public debt and real GDP relies on the size of the national debt. But if South Africa's governmental debt rises beyond the 31.37% debt-to-GDP limit, it becomes a roadblock to economic development. Using quarterly data from 1991 to 2013. Lee and Ng [15] conducted another analysis to investigate the effect of Malaysia's state debt on economic growth. The study utilized public debt, the budget deficit, and government consumption as independent factors, while GDP was employed as the dependent variable. The study's findings demonstrated a tension between governmental expansion and economic growth. Furthermore, it was shown that the impact of government consumption, the budget deficit, and foreign debt servicing was diminishing. Research has been done on a single nation to examine how government debt affects economic growth in industrialized, emerging, and developing countries.
Eberhardt and Presbitero [16] investigated the relationship between public debt and economic growth by analyzing the debt-growth nexus across 118 developing, emerging, and advanced countries from 1960 to 2012. They did this by using a common correlated effects (CCE) estimator. The investigation found a connection between public debt and long-term economic progress across countries. Still, there was insufficient information to make inferences about individual countries' debt levels. There have also been country-by-country studies on the effects of public debt on economic growth in developed, emerging, and developing countries. Hussain et al. [17] examined the relationship between public debt and economic progress for 48 Sub-Saharan African countries using the dynamic Arellano-Bond panel data estimate from 1995 to 2012. The study indicates that there is a poor correlation between government debt and economic growth. In 2014, Antonakakis [18] examined the 1970–2013 period in 12 euro-denominated countries regarding public debt and economic growth. The study included both dynamic and static panel data analysis. The empirical results show that although non-sustainable debt-to-GDP ratios above and below the 60% level hurt economic growth in the short term, sustainable debt-to-GDP ratios below 90% have a positive effect.
Furthermore, Baum et al. [19] employed the panel approach to study the relationship between public debt and economic growth to look at the non-linear impact of public debt on economic development. They focus on 12 countries from the Eurozone between 1990 and 2010. The results show that debt has a short-term, positive, and statistically significant effect on GDP. Still, this effect eventually declines to zero and loses significance when public debt-to-GDP ratios reach around 67%. The empirical findings of a robust dynamic and non-dynamic threshold model show that more debt hurts economic activity at high debt-to-GDP ratios exceeding 95%. Additionally, we can show that there is increased pressure on the long-term interest rate when the public debt-to-GDP ratio approaches 70%, which usually supports the findings.
This section reviews studies on the symmetric effects of government debt on economic growth. Several empirical studies consider the relationship between government or public debt on GDP growth. These studies use different methodologies and time period. Most of the empirical studies have utilized the Auto-Regression Distributed Lag (ARDL) method and panel tests methods to analysis whether there are association correlation variables and to research the direction of the linkages between government debt and economic growth. These studies have been done in many countries including developing and developed countries and the results are negative and positive. Besides, studies that used ordinary least square (OLS) approach are not able to provide the ways relationships. It just tells the one-way relationship between the variables. Many studies have utilized the VAR and common correlated effects (CCE) estimator. Since there is lack of such studies in Somalia, this study utilized the normal econometric technique in the literature to explore the connection among variables whether are strong or weak. The following chapter discusses the methodology.
3.1 Empirical model
This research used an empirical model by Amwaama [8]. The practical model has the following equation.
$G D P \mathrm{t}=f(D B T \mathrm{t}, L A R G \mathrm{t})$ (1)
where, GDPt, EBTt, and LARGt, are GDP, External government debt, and share of agriculture in the economy. Eq. (1) is transformed into natural logarithms as follows:
$L G D P \mathrm{t}=a 1+\beta 1 D B T \mathrm{t}+\beta 2 L A R G \mathrm{t}+\pi \mathrm{t}$ (2)
In the model, t is residuals, and the remaining variables are specified. According to economic theory, increasing government debts leads to an increase in paying national debts. The given fiscal resources may decrease long-term, damaging GDP growth. Then, we predicted that the government debt would hurt GDP growth.
The proportion of agriculture in the economy and economic growth should be positively correlated. The study anticipated that when the agricultural share rises (particularly for nations that import food, like Somalia), the domestic food supply would be strengthened, eventually raising revenue via increased consumption.
3.2 Data
The analysis includes the years 1980 to 2020 and uses yearly data. Data from a wide range of sources were obtained (2). Based on the available information, we choose an estimated timeframe. GDP growth (a percentage change at constant prices) is a proxy for economic growth. World Development Indicators of the World Bank are used to collect data for this variable, which assesses the contribution of agriculture, fishery, and forestry to GDP (WDI).
3.3 Estimation technique
The study employed NARDL. The results of the NARDL model are as follows:
In Eq. (3), the study computed the lag orders of q and p and the long-run coefficients. Additionally, it observed the short-term effects of government debt reduction on GDP growth and the short-term effects of government debt rise.
The non-linear ARDL method is used in this study to estimate Eq. (3), which uses an organizational policy to determine the long-run co-integration between government debt and GDP growth. Before evaluating the model using NARDL, the study tests for long-run co-integration using the limits testing approach [20].
$\begin{gathered}\triangle L G D P=\alpha 0+\beta 1 L G D P+\gamma_1^{-} L D B T^{-} \mathrm{t}-1+\gamma_2 L D B T^{-}\mathrm{t}- 1+\gamma_3 L A R G \mathrm{t}- \\ \left.\left.1+\beta 1 L G D P 3 F_{-}\right)+\triangle L G D P \mathrm{t}_{-} ;+3>P_{-}\right)+\triangle L D B T \mathrm{t}+ \triangle L D B T \mathrm{t}-1+\triangle L A R G \mathrm{t}-1+\mathrm{u}\end{gathered}$ (3)
where, q and p are lag orders in Eq. (3) and long-run coefficients are computed as $\beta_2=\gamma^{-} / \beta_1$and $\beta_3 / \gamma^{+}$. In addition, $\sum_{i=0}^q \pi^{+}$ captures the short-run impact of government debt increase on GDP growth while $\sum_{i=0}^q \pi^{-}$ Captures the short-run impact of government debt reduction on GDP growth. This work uses the stepwise OLS procedure to estimate Eq. (3), a general-to-specific method, to determine whether government debt and GDP growth are linked in the long run. The work uses the bounds testing method to check for long-term cointegration. We done this to predict the model [20].
If γ1=γ2=γ3=0, the effect is said to be symmetrical according to the null hypothesis. According to the alternate theory, if γ≠γ2≠γ3≠0, the impact is asymmetrical. The existence of asymmetrical is a clear indication of this. The research then uses data from the Wald F-test to check for asymmetric cointegration between Somalian's public debt and GDP growth. Before deciding if there is a long-term link between the variables, the research must determine whether the study's variables are appropriate for non-linear modeling. The research used the BDS test. The test aims to establish the model's null hypothesis of linearity. The research tests for the variables' non-linear unit root following the augment dick fuller test.
4.1 Descriptive statistics
The first level of empirical analysis is descriptive statistics. The study analyzed the descriptive statistics o the variables in Table 1. The findings indicate that from 1980 and 2019, the GDP grew by an average of 1.64%. On the other hand, government debt and the proportion of agriculture have mean values of 21.58% and 12.63%, respectively.
Table 1. Descriptive statistics
|
Mean |
1.643 |
21.584700 |
12.631499 |
|
Maximum |
22.664161 |
22.449844 |
13.390500 |
|
Minimum |
20.577701 |
20.103011 |
11.685811 |
|
Standard Deviation |
0.5309811 |
0.4218444 |
0.4300433 |
|
Jarque-Bera |
70.282791 |
23.745377 |
1.2987899 |
|
Probability |
0.0000000 |
0.000007 |
0.5223622 |
This research additionally calculated the Spearman pairwise correlations to build on the first findings. Table 2 displays the results and includes the coefficients and p-values for each pairwise variable. A value of 0.72 shows a positive pairwise association between GDP growth and the percentage of foreign debt. Agriculture and GDP growth do, however, have an unimportant negative pairwise association with a coefficient of 0.38.
Table 2. Pair's correlation matrix
|
Correlation (Probability) |
GDP |
EDBT |
LAGRA |
|
GDP |
1.000 |
0.7289200 |
-0.3803400 |
|
EDBT |
0.7289200 |
1.000 |
-0.5678144 |
|
LAGRA |
-0.3803400 |
-0.5678144 |
1.000 |
4.2 Nonlinearity test
It is crucial to look at the nonlinearity among the variables since this research aims to establish the asymmetric link between government debt and economic development in Somalia. The study looked at the variables' nonlinearity using the well-known BDS test. Table 3 presents the findings. The findings suggest that the variables have a non-normal distribution, which provides some indication of nonlinearity. The study disproved the linearity null hypothesis, as seen in Table 3. It disregarded in favor of nonlinearity.
The research employs an unconventional unit root test that is particularly appropriate if the data shows the non-normality developing over time. The non-linear unit root test uses the Argument Dickey more comprehensive unit root test. The next step is to look for unit roots in the study-checked variables. See Table 4.
The results from the ADF test indicate that LAGR is stationary at levels, but the stories in LGDP and EDBT are nonstationary. It means that we integrate the LGDP and LARG of order one. The ADF unit root test results confirm that all variables are nonstationary in levels except LAGR, meaning they have a unit root. Since nonlinearity is present, the results of the ADF test prove that all variables are integrated of order one (1). The next step is to figure out the ARDL cointegration between the factors that are not linear.
Table 3. Nonlinearity test
|
BDS Test for Nonlinearity |
||
|
Variable |
Dimension |
BDS Statistics |
|
2 |
0.132643 |
|
|
3 |
0.185236 |
|
|
LGDP |
4 |
0.182808 |
|
5 |
0.130834 |
|
|
6 |
0.119188 |
|
|
2 |
0.163866 |
|
|
3 |
0.243288 |
|
|
EDBT |
4 |
0.267357 |
|
5 |
0.348860 |
|
|
6 |
0.415512 |
|
|
2 |
0.084635 |
|
|
3 |
0.076981 |
|
|
LARG |
4 |
0.132389 |
|
5 |
0.225349 |
|
|
6 |
0.111365 |
|
Table 4. Unit root test
|
Variables |
Level |
First Difference |
||
|
Intercept |
Trend & Intercept |
Intercept |
Trend & Intercept |
|
|
LGDP |
0.7970 |
-0.2399 |
-5.8971** |
-6.5027*** |
|
LAGR |
-3.0300** |
-4.3980** |
-8.9631** |
-8.8559** |
|
EDBT |
-1.5058 |
-2.4395 |
-2.94114** |
-5.8345** |
The study employed the NARDL cointegration test to analyze an unconstrained model. It applies the F-test to the joint hypothesis that the lagged long-run parameters all equal zero. The results are shown in Table 5 below. The results support the statistical evidence for the long-term cointegration of the variables. The findings show that the calculated F-statistics of 13.78050 is higher than the upper limit 3.2's crucial value at the 1% significance level. The results imply that government debt and Somalia's economic growth have a long-term relationship.
Table 5. NARDL bounds cointegration results
|
Critical Value (%) |
Lower Bound I (0) |
Upper Bound I (1) |
|
1 |
2.37 |
3.2 |
|
5 |
2.79 |
3.67 |
|
10 |
3.65 |
4.66 |
|
NARDL F-statistics |
Wald F-stat 13.78050*** |
|
Rejection rule: reject the null hypothesis if F-statistics exceeds the upper limit. The non-linear ARDL specification with 2, 4, 4, and 0 is chosen based on empirical study. Since there is proof of non-linear cointegration, we presented the extended run parameters of NARDL regression Table 6 presents the findings. Table 6 shows the results. It demonstrates that although decomposed government debt's negative consequences (DBT NEG) are significant, its positive ones (DBT POS) are negligible. The anticipated long-run parameters for positive and negative government debt shocks are, respectively, -0.711060 and -2.880952. Therefore, it is evident from the findings that GDP growth is more sensitive to negative than positive debt levels. The findings indicate that a 1% rise in public debt would result in a 0.71% decline in GDP growth; however, this coefficient is statistically insignificant. The growth of GDP goes up by 0.288% when debt goes down. The findings also demonstrate that the impact of agriculture's contribution to GDP growth is negative and significant. According to the results, a 1% rise in agricultural share would lead to a 0.69 percent boost in GDP growth. The calculated model's modified R-squared value is satisfactory. After figuring out the NARDL long-run parameters, the study estimates a short-run model, and to see how well the model works, we implemented diagnostic tests. Table 6 shows the results in the short run.
The short run and residual diagnostic findings are shown in Table 6. The Ect (-1) term, often known as the error correction term, controls how quickly an equilibrium is reached. Table 6 demonstrates that the mistake corrects term's coefficient is statistically significant and negative. Given that it is more than 1, there has been an excessive adjustment to equilibrium. Additionally, Table 6 shows that the findings met diagnostic statistics. The diagnosis test results show there was no serial correlation, heteroskedasticity and normality.
Table 6. NARDL short-run parameter estimation
|
Exogenous Variables |
Parameters |
P-Values |
|
DBT_POS |
--0.711060 |
0.0729 |
|
DBT_NEG |
-2.880952 |
0.036*** |
|
LARG |
0.69282 |
0.000*** |
|
R-squared |
0.912976 |
|
|
Adjusted R-squared. |
0.882852 |
|
|
Selected model: |
ARDL (2, 0, 4, 0) |
|
Table 7. Long run NARDL estimation
|
Exogenous Variables |
Parameters |
P-Values |
|
C |
2.479711 |
0.000*** |
|
@TREND |
-0.950 |
0.000*** |
|
Δ (DBT_POS) |
-1.460921 |
0.2279 |
|
Δ (DBT_POS (-1) |
-1.224489 |
0.2900 |
|
Δ (DBT_POS (-2) |
12.23921 |
0.0002*** |
|
Δ (LARG) |
4.73E+08 |
0.000*** |
|
Δ (LARG (-1) |
1.44E+09 |
0.000** |
|
Ect (-1) |
-1.033 |
0.000*** |
|
R-squared |
0.860686 |
|
|
Adjusted R-squared |
0.713176 |
|
|
Heteroskedasticity Test: Breusch-Pagan-Godfrey |
0.787 (0.690) |
|
|
Jarque-Bera test |
538.2665 (0.000) |
|
|
Breusch-Godfrey Serial Correlation LM Test |
0.27392 (0.8924) |
|
Table 7 shows the results of the short-term and long-term diagnostic tests. The Ect (-1) term, the error correction term, affects how quickly an equilibrium is reached. Table 7 demonstrates that the mistake corrects the term's coefficient is statistically significant and negative. Given that it is more than 1, there has been an excessive adjustment to equilibrium. Additionally, Table 7 shows that the findings met diagnostic statistics.
The study investigated further whether the coefficients in the long run and short run are symmetrical or asymmetrical. The results for an asymmetrical test are presented in Table 8. It is evident from Table 8 that decomposed positive and negative effects of government debt on GDP growth are significant at 5%. This implies that the study rejects the null hypothesis of no asymmetry. This suggests that there is inequality, and that the coefficients are not the same.
Table 8. Long run and short run asymmetric test
|
Asymmetric Test |
F-Statistics |
P-Value |
|
Long run -Ỿ1- β1= Ỿ2+/β2 |
9.116090 |
0.0049*** |
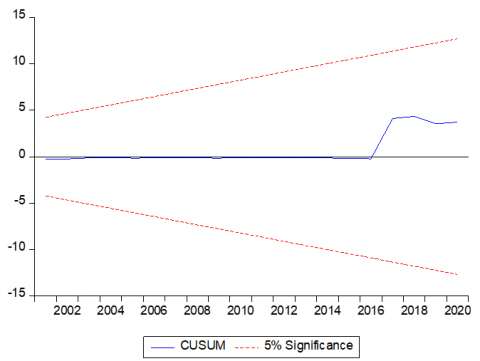
The research also evaluated the estimated model's stability. Figure 2 shows that both the CUSUM and the CUSUM of squares show that the model is stable.
Figure 2. Stability diagnosis
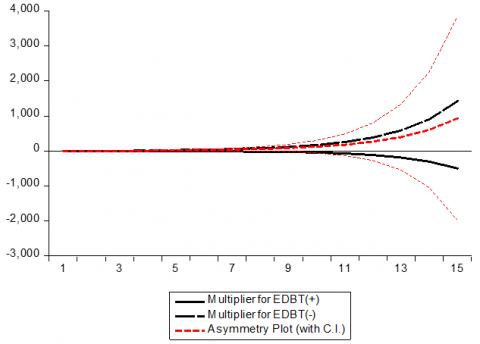
The impact of the dynamic multiplier of changes in government debt, both positive and negative, is seen in Figure 3. A given time horizon's information regarding the asymmetric adjustment of GDP growth to a positive government debt shock is provided by the solid black line since it catches positive developments. The dotted black line, which captures the negative changes, includes information on the asymmetries in how GDP growth responds to a negative shock from government debt over a certain period. The red dotted line shows the distinction between positive and negative shocks. Positive shocks are more unstable in the short term than adverse shocks, as seen in Figure 3. However, these shocks are brief, and they gradually stabilize throughout the term (in the long run). According to Figure 3, a decrease in public debt would seem to have a longer-term influence on GDP growth than a rise in public debt.
Figure 3. Stability diagnosis
With the recent worldwide financial crisis, one of the primary economic issues of attention over the last three decades has been government debt, a basic economic notion. It shows the amount a nation pays to loans worldwide. The objective of this research is to investigate if there is unequal relationship between the Somalia’s Government debts and GDP growth. Moreover, annual time series data was obtained for the research from World Bank and the statistical, Economic and Social Research for Islamic countries (SESRIC), covering period 1980 to 2020. The study employed Non-linear Auto-Regression Distributed Lag (NARDL) methods. The findings indicated that a 1% increase in public debt would result in a 0.71% decline in GDP growth, however this coefficient is statistically insignificant. Debt reduction is correlated with a 0.288% increase in GDP growth. The findings also demonstrate that the impact of agriculture's contribution on GDP growth is positive and large. According to the findings, a 1% rise in agricultural share would lead to a 0.69 percent increase in GDP growth. The calculated model's modified R-squared value is satisfactory, Somalia needs to keep continued its debts at rational level and achieve the fiscal sustainability.
The asymmetric effects results demonstrated that decomposed positive and negative effects of government debt on GDP growth are significant at 5%. This implies that the study rejects the null hypothesis of no asymmetry. This suggests that there is inequality, and that the coefficients are not the same. The experiential research indicates that there is inverse causality between the two variables. The results of this study will shed light on how government debt impacts the Somali economy in different economic conditions and provide valuable insights into the effects of government debt on GDP growth in Somalia. This information can inform policy decisions aimed at supporting sustainable economic growth and development in the country. Furthermore, many researchers revealed their findings related the association between government debt and economic growth, but there is no research of Somalia, this study utilized the most advanced econometric technique, which is nonlinear Auto- regression distributed lags model (NARDL) in the literature to study the relationship among variables. Limitations of the research: Although Somali faced a lot of challenges including civil war, pirates, terrorists, macroeconomics instability, lack of human capital, poor infrastructure, and corruptions are not considered owing to data availability.
Policy recommendations firstly, Fiscals manage debt: Governments should aim to keep their debt levels sustainable, by balancing borrowing and repayment, and ensuring that debt service costs are manageable in the long run. Secondly, prioritize public investments: Investment in infrastructure, education, health, and other areas that enhance productivity and economic growth should be prioritized over consumption spending. Thirdly, increase revenue: Governments can increase revenue through tax reforms, anti-corruption measures, and other initiatives to help finance public investments and reduce debt. Fourthly, maintain macroeconomic stability: Stable inflation, exchange rates, and interest rates can help reduce the negative impact of debt on economic growth. Fifthly, avoid excessive borrowing: Governments should avoid excessive borrowing, which can lead to a build-up of debt and increase the risk of a debt crisis and finally Use debt for development: Borrowing can be used to finance productive investments that support long-term economic growth.
[1] Mosikari, T.J., Eita, J.H. (2021). Asymmetric effect of government debt on GDP growth: Evidence from Namibia. Public Sector Economics, 45(4): 543-558. https://doi.org/10.3326/pse.45.4.7
[2] Kur, K.K., Abugwu, C.O.B., Abbah, C.S., Anyanwu, O. (2021). Public debt and economic growth: What we know today about the Nigerian economy tomorrow. African Social Science and Humanities Journal, 2(4): 192-206. https://doi.org/10.57040/asshj.v2i4.75
[3] Yusuf, A., Mohd, S. (2021). The impact of government debt on economic growth in Nigeria. Cogent Economics & Finance, 9(1): 1946249. https://doi.org/10.1080/23322039.2021.1946249
[4] Asteriou, D., Pilbeam, K., Pratiwi, C.E. (2021). Public debt and economic growth: Panel data evidence for Asian countries. Journal of Economics and Finance, 45: 270-287. https://doi.org/10.1007/s12197-020-09515-7
[5] Salmon, J. (2021). The impact of public debt on economic growth. Cato Journal, 41(3): 487. https://doi.org/10.36009/CJ.41.3.2
[6] Ghourchian, S., Yilmazkuday, H. (2020). Government consumption, government debt and economic growth. Review of Development Economics, 24(2): 589-605. https://doi.org/10.1111/rode.12661
[7] Lim, J.J. (2019). Growth in the shadow of debt. Journal of Banking & Finance, 103: 98-112. https://doi.org/10.1016/j.jbankfin.2019.04.002
[8] Amwaama, N. (2018). An assessment of the relationship between budget deficit and economic growth in Namibia. Doctoral dissertation, University of Namibia.
[9] Sharaf, M.F. (2022). The asymmetric and threshold impact of external debt on economic growth: New evidence from Egypt. Journal of Business and Socio-Economic Development, 2(1): 1-18. https://doi.org/10.1108/JBSED-06-2021-0084
[10] Didia, D., Ayokunle, P. (2020). External debt, domestic debt and economic growth: The case of Nigeria. Advances in Economics and Business, 8(2): 85-94. https://doi.org/10.13189/aeb.2020.080202
[11] Elom-Obed, F.O., Odo, S.I., Elom-Obed, O., Anoke, C.I. (2017). Public debt and economic growth in Nigeria. Asian Research Journal of Arts & Social Sciences, 4(3): 1-16. https://doi.org/10.9734/arjass/2017/36095
[12] Makhoba, B.P., Kaseeram, I., Greyling, L. (2022). Asymmetric effects of public debt on economic growth: Evidence from emerging and frontier SADC economies. Cogent Economics & Finance, 10(1): 2046323. https://doi.org/10.1080/23322039.2022.2046323
[13] Shoewu, O. (2016). Analysis of the co-dispersion structure of health-related indicators in the center of the subjective sense of health. CEUR Workshop Proceedings, 13(1): 315-322.
[14] Olamide, E.G., Maredza, A. (2021). Pre-COVID-19 evaluation of external debt, corruption and economic growth in South Africa. Review of Economics and Political Science, 8(1): 19-36. https://doi.org/10.1108/REPS-03-2021-0019
[15] Lee, S.P., Ng, Y.L. (2015). Public debt and economic growth in Malaysia. Asian Economic and Financial Review, 5(1): 119-126. https://doi.org/10.18488/journal.aefr/2015.5.1/102.1.119.126
[16] Eberhardt, M., Presbitero, A.F. (2015). Public debt and growth: Heterogeneity and non-linearity. Journal of international Economics, 97(1): 45-58. https://doi.org/10.1016/j.jinteco.2015.04.005
[17] Hussain, M.E., Haque, M., Igwike, R.S. (2015). Relationship between economic growth and debt: An empirical analysis for Sub-Saharan Africa. Journal of Economics and Political Economy, 2(2): 262-275. http://dx.doi.org/10.1453/jepe.v2i2.222
[18] Antonakakis, N. (2014). Sovereign debt and economic growth revisited: The role of (non-) sustainable debt thresholds. WU Vienna University of Economics and Business. Department of Economics Working Paper Series No. 187.
[19] Baum, A., Checherita-Westphal, C., Rother, P. (2013). Debt and growth: New evidence for the Euro area. Journal of International Money and Finance, 32: 809-821. https://doi.org/10.1016/j.jimonfin.2012.07.004
[20] Pesaran, M.H., Shin, Y., Smith, R.J. (2001). Bounds testing approaches to the analysis of level relationships. Journal of Applied Econometrics, 16(3): 289-326. https://doi.org/10.1002/jae.616