Zena Ayad Jaber Jedi*![]() | Sara Mahmood Al-Jawari
| Sara Mahmood Al-Jawari![]()
© 2023 IIETA. This article is published by IIETA and is licensed under the CC BY 4.0 license (http://creativecommons.org/licenses/by/4.0/).
OPEN ACCESS
The research utilizes data produced by the Local Urban Management Directorate in Najaf and the imagery data from the Landsat 9 satellite, after being processed by the GIS tool. The research follows a descriptive and analytical approach; we integrated the Markov chain analysis and the cellular automation approach to predict transformations in city structure as a result of changes in land utilization. The research also aims to identify approaches to detect post-classification transformations in order to determine changes in land utilization. To predict the future land utilization in the city of Kufa, and to evaluate data accuracy, we used the Kappa Indicator to determine the potential applicability of the probability matrix that resulted from the city's previous formal transformations. This was concluded after comparing the expected results with the data from the actual image. This study demonstrates the usefulness of cellular modelling and Markov's model in determining formal transformations in city structure. This paper contributes to identifying transformations and changes in urban structures because of the importance of this topic in the predictions of the future of cities to control and contain the negative trends of these transformations. The paper simulates spatial and temporal shifts by building a model that integrates mathematical and statistical analysis, and given the results of the Kappa index, the model's simulation capacity was excellent.
cellular automates, city structure, formal transformations, Kufa city, Markov model, prediction
For many reasons, including urban growth, there are formal transformations in the structures of cities, and this paper predicts them for many next years, using techniques that integrate mathematical and statistical analyses through the IDRISI programme, and predicting the future of Kufa city structure as a model for formal transformations.
Urban growth, which is a dynamic and demographic phenomenon, refers to an increase in the spatial value of urban land, due to social and economic forces. At present, the pace of land transformation is increasing rapidly, such as agricultural land, open areas, water and others. Urban sprawl simulation and prediction are therefore essential to protecting the ecosystem and the sustainable environment. So, the complex structure of urban structure must be understood as mimicking urban dynamics correctly, and in simulating urban growth, important chronology and historical information to accurately identify spatial and temporal relationships must be considered.
In this research, simulation techniques are used to facilitate understanding of spatial and temporal changes, based on the GIS environment, which in recent years have proven to be effective tools to help planners and decision makers formulate sustainable policies, and that these modern technologies have many advantages because they are considered low-cost tools and provide effective visual interpretation. Therefore, urban and environmental planners have relied heavily on these technologies to model urban growth patterns and future formal transformations in cities facing environmental change and urban sprawl. Spatial modelling is used to simulate land-use patterns in general, and planners and policymakers are looking at methods based on available information on cities, data integration, and qualitative standards, so the flexible and intuitive automata and Markov (CA) model has provided the ability to integrate spatial and extra-dimensional dimensions.
This prediction is based on the assumption that past urban growth affects future patterns through local and regional interactions between different types of land use and can easily integrate the information available to the reality of any city and thus anticipate its future, Because CA has high spatial accuracy and computational efficiency, it can be used to analyze and summarize transformations in urban and non-urban areas, and then evaluate the performance of the CA-Markov model.
Here, transformations in urban land use from 2002 to 2012 were calculated using the CA-Markov model for calibration and optimal CA transmission rules, to predict and match urban growth in 2022, and then applied to calculate transformations from 2012 to 2022 to predict the future, specifically 2032. The CA-Markov model was used to simulate land-use change in the city of Kufa. The results confirm that agricultural areas will be affected by urban uses in the next decade. This increase in urban use is attributable to the impact of the steady increase in economic and demographic development. The findings also suggest that new policies need to be put in place in the city to protect its sustainability.
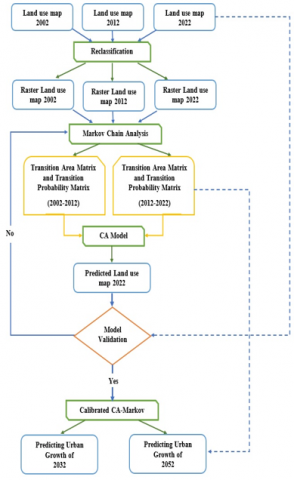
Finally, a framework can be set for drawing the path of this paper, which strat by drawing cities for a chosen series of years, and here this paper drawn city of Kufa for years (2002, 2012, 2022), by reality of the city through satellite images. And then the first two years are analyzed through IDRISI program, to create a matrix of the transformations that happen during this period. Then we predict 2022 structure, And the program compares the predicted image with the actual one that was drawn, From the result of the Kappa coefficient extracted through the same program, the extent to which the prediction result is accepted or not If they are within acceptable limits of > 0.80%, then future years such as 2032 and 2052 can be predicted, and if they are not acceptable, the process will be restored with new inputs (See flow chart).
Macro transformations result from the constant change in land use in city structure Thompson in 1961 interpreted the form and analyzed it by adopting mathematical foundations to demonstrate how it grew and transformed, He presented the phenomenon of persistence and change, and considered the origin of the species to be constant and common, But it changes in appearance through added and incomplete alterations, and asserts that the system of formal transformations is inherently dynamic, two types of formal transformations have also been found to further amplify or decrease. These two types of transformations in city structure are systemic and irregular transformations [1].
Formal transformations occur as a result of changes in urban functions, that lead to changes in urban systems' behavior, as a result of internal factors and the influence of external forces that generate some kind of observable spatial changes at the urban level, and that spatial changes vary from area to another and it isn’t similar, this is due to the different characteristics and of these cities [2]. All these spatial changes lead to formal transformations, that Antoniades defined it as: the process of changing the shape, to reach to the final stage by responding to a variety of external and internal dynamics. So, the formal transformations are the process of addressing without reverting to functional requirements [3]. Formal transformations occur in cities and are reflected in the continuity of cities with growth, by adding parts to the whole, which causes an imbalance in urban structures and causes a change in parts' growth characteristics to reach equilibrium [4]. It should be noted that urban cells continue to grow until they reach another change, which reach to the highest possible urban level to meet urban need, and may reach to a critical limit if growth continues at the same pace, thus being unable to regulate the urban structure according to the continuous growth [5]. One of the most important reasons of transformations, is the presence of new influences, that make previous master plan lose the ability to meet current requirements, so the sources of structures are derived from mental diagrams, which arise and gradually transformed [6].
The United Nations reports unequivocally show that the current urbanization model is in many ways unsustainable. It conveys a clear message that the pattern of urbanization needs to change in order to better respond to the challenges of our time, to address issues such as inequality, climate change, instability, insecurity and unsustainable forms of urbanization. and that unsustainable urban structure must be controlled [7].
Spatial simulation is an analytical process carried out in conjunction with GIS to describe the processes and characteristics of a range of spatial features, with the aim of simulating spatial phenomena to facilitate problem resolution and planning such as projected urban growth trends, and that the CA-Markov model has recently been used to predict dynamic spatial issues Such as future urban growth and land use change [8].
Cellular Automata (CA) is a spatial modeling technique that is widely used in simulating urban systems, and CA's popularity comes from its ability to model it is considered a method that reflects spatial elements and the dynamics of transformations in land uses. The CA assumes that the region has a significant tendency to change to a particular category of uses if adjacent areas belong to that category, the basic principle of CA is that the previous urban development pattern affects future development through local interactions that collectively form patterns of urban growth [9].
As for the Markov model (MC), it is a random process that describes a series of events where the future event is based only on current and previous events without having to consider the entire history of the event. and that the ability to express time changes from time to time makes MC an appropriate tool for modeling transformations in uses, thus forming a basis for predicting future transformations. The MC model describes the potential shift between different land uses across the portability matrix. Each category entered in the matrix represents the possibility of changing the state of one pixel from one land use to another. And here we need at least two different maps of the same region for two different time stamps to see the probability of moving between these two time periods. In this study, maps of the ancient city of Kufa were used for 2002, 2012 and 2022 [10].
The CA and Markov series models are very suitable for spatial modeling of urban growth trends by taking advantage of the advantages of the Markov chain in predicting urban quantitative change, and the dynamic spatial simulation power of the CA model [11], these techniques are combined This model is integrated with the IDRISI Selva software. And the ArcGIS can make the most of addressing several problems, including with regard to urban land transformations, measurement and prediction, to monitor accelerated future transformation [12]. This model has been used in this paper for being easy and uncomplicated and there is potential for its development as research and reports indicate.
4.1 Field of study
Kufa is an Iraqi city on the Euphrates River, the second city built in Islam in 638 AD [13], and its astronomical position is in the north of the equator and east of the Greenwich Line, between two latitudes 32 00 - 32 5 north and two lines 44 21 - 44 26 east [14] (see Figure 1).
Figure 1. Study area
Source: Researcher based on ArcMap software
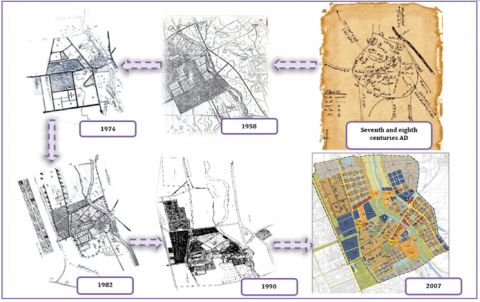
This event was a turning point in its history [15], and it underwent a number of changes in its structure gradually throughout its history, the beginning of which could be determined in the mid-nineteenth century. Later, in 1958, residential neighborhoods emerged due to rising rates of migration from the countryside to the city as a result of improved living conditions and the provision of services, and the adoption of land distribution policies by the state. despite all the organizational master plan of the State at the time, However, the overtaking process continued until the production of the first city master plan [16]. The plan attempted to meet the needs of the inhabitants in the southern and southeastern areas of housing, and the roads were designed to connect to their neighborhoods. The master plan has kept the orchards unchanged. Table 1 shows the areas of the city’s base plans throughout its history:
Table 1. Area of the base plan for the city of Kufa during its stages
|
2007 |
1990 |
1982 |
1974 |
Year of preparation of the outline |
|
4911.02 |
2346 |
1533 |
999.2 |
Area/km2 |
The city's formal transformations can also be reviewed through Figure 2 until the adoption of the baseline in 2007.
Figure 2. Illustrates the formal transformations of the city of Kufa through its historical stages
Source: The researcher based on [17-19]
4.2 Data collection and processing
Through the above illustration of historical formal transformations, the city of Kufa, like other cities, will continue this transformation of its formal structure, and if all that matters here is the change or the random transformation, it weakens this structure and exhausts it until it consumes it completely in its advanced stages. And it's important to know that we can predict where transformations can arrive after a period of time based on the cellular automation model and the Markov chains model benefiting from the formal transformations the city has undergone, and here we need to provide:
(1) Providing Landsat TM satellite images for the 2002-2012-2022 years of Kufa with high resolution.
(2) Providing basic design data for the city of Kufa (2007-2030) from site, area and boundary, the last updated design of the city, with an area of about 49,111 km2.
4.3 Modus operandi and methods
This study used an integral analysis of the Markov chain and an approach to predict future changes in land uses, and the IDRISI software package and ArcMap were used to perform this task as in the streamlined diagram (flow chart, Figure 11). Simulating and monitoring future land-use trends is one of the main challenges for researchers, decision makers and local authorities in terms of data, methods and models that should be used to create a realistic and sustainable land-use planning process. This study aims to use spatial data and temporal models to generate realistic simulation and assessment of future land-use trends in the city of Kufa, Iraq. For this purpose, three land-use maps for the years 2002, 2012 and 222 were used to predict the future of the city of Kufa. The following modus operandi was followed:
(1) Manual drawing of the land use layer for 2002-2012-2022 years based on space imagery, thus adopting the uses that can be deduced through the space image (transport, green zones, open spaces, built-up spaces (constructs), including commercial, industrial and some other unnoticeable uses from the space image, municipal sectors, agricultural lands and bodies of water).
(2) We convert these drawn layers into images using ArcMap software, noting the standardization of cell size in all maps of research years (Figure 3).
(3) These resulting images from the previous move are turned into text files, to be read through the program IDRISI Selva.
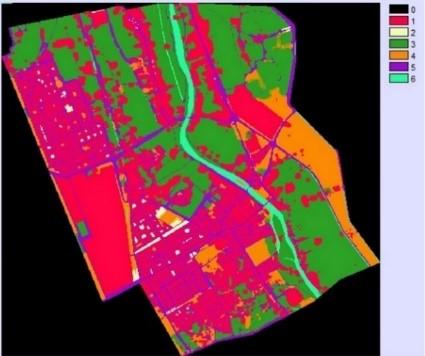
(4) Through the program we do a reclassification of each layer of use and for each year of research, noting that the reclassification starts from the number 1 of the first class to any number of unused uses (0) because in the program it represents the back layer which is devoid of any use (Figure 4).
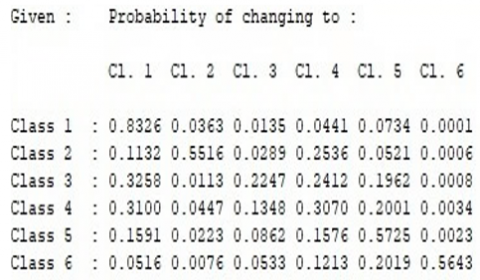
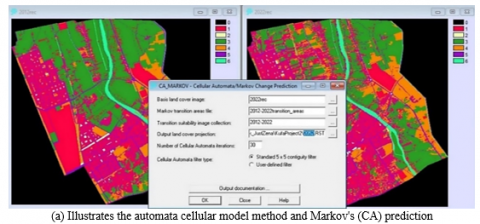
(5) The simulation process is then done using the Markov model to create the transition probability matrix and conditional probability images, by taking considerations from the 2002 city form to its 2012 format to determine the probability of transition between user classes, indicators and laws until they are adopted in subsequent forecasting phases after assessing their accuracy: The transition probability matrix، the conditional probability images (Figures 5 and 6).
Figure 3. Images of layers of uses during research years
Source: The researcher based on ArcMap software
Figure 4. Images of the reclassification of layers of uses into 6 categories during research years
Source: The researcher based on IDRISI Selva
Figure 5. Images of land-use transformation simulations
Source: The researcher based on IDRISI Selva
Figure 6. Illustrates the transition probability matrix
Source: The researcher based on IDRISI Selva
Figure 7. Illustrates the projected land use map for 2022
Source: The researcher based on IDRISI Selva
(6) Using the built-in cellular and Markov automation model to predict Earth's uses for 2022, in which we have a realistic map image of Earth's uses, to be compared (Figure 7).
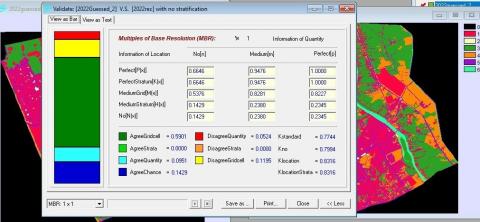
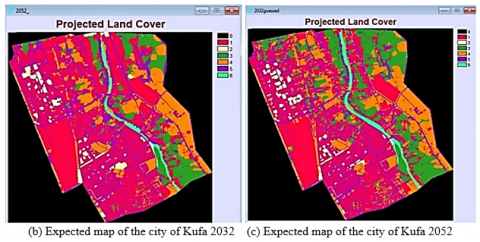
(7) Here the accuracy of the work is evaluated by comparing the real map of 2022 (Figure 8a) with the expected map produced through the program and Markov's spatial simulation model to predict the transformation of the Earth's uses for the year 2022 (Figure 8b), and to determine the accuracy of this simulation for predictability of the future and for the years 2032 and 2052 m. If the accuracy assessment shows acceptable Kappa values, this suggests that the image classification is acceptable, based on Anderson's diagram, and that prediction is acceptable and effective (Figure 8c). To calculate Kappa's indicators, the model determines the extent of agreement and disagreement between simulated maps and maps. The location difference occurs when the cell position of the predicted map category differs from the same category in the real map, which is a reference and is called the reference map, the method of intersection and comparison with the real map is used to calculate the Kappa coefficient and the value of the Kappa index must be acceptable and accurate within limits 0.85 [20], here the overall accuracy of land use maps is 83%, so predicting the future of transformation in the city of Kufa is within acceptable limits (Figure 9).
(8) And here in this step and after making sure that the Kappa index is accepted in the previous forecast accuracy assessment for the future of the city of Kufa to see where and how it grows, to try to reduce the negative impacts of this growth by planning it in advance based on the predicted formal transformations of the city in the target year. and forecast for 2032 and 2052, i.e., 10 years, and 30 years to come (Figure 10). To follow the steps in detail (Figure 11).
Figure 8. Predictation of the future and for the years 2032 and 2052 m
Source: The researcher based on IDRISI Selva
Figure 9. The table of indicators of accuracy of the expected maps based on the reality of the city of Kufa
Source: The researcher based on IDRISI Selva
Figure 10. Future outlook for use in the city of Kufa
Source: The researcher based on IDRISI Selva
Figure 11. Flowchart of the research methodology
Source: The researcher
4.4 Results and discussion
Prediction of formal transformations in the city of Kufa structure by the cellular automation model and Markov chains, acording to the above work steps, we can summarize the following results:
By reviewing of the Land Use Map 2022 in ArcMap program, the areas were as shown in Table 2, which represents the areas according to the reality of the city to be later compared with the predicted areas as illustrated in the introduction:
As predicted the city is undergoing continuous formal transformations as a result of the transformation of its uses, to be 10 years later, as shown in Table 3.
Transformations continue in the future because, after the next 30 years, uses are transformed as a result of urban growth and its causes. This calls for the intervention of planning to control the city's growth and its formal transformations in order to maintain the sustainability of the city's structure, and reaches what can be read in Table 4.
Result of the verified CA-MC map shows that the Kappa stander was 77.44% and is an acceptable result of a simulation model, when the Kappa no was 79.94%, and the Kappa location was 83.16% on the other hand, rates within acceptable limits.
Table 2. Area of use in the city of Kufa for the year 2022
|
Area 2022 |
Usage items |
|
17972400 |
1 Constructors |
|
475500 |
2 Green |
|
16843800 |
3 Agricultural |
|
4476100 |
4 Open spaces |
|
7838200 |
5 Transfer |
|
1505800 |
6 Water bodies |
|
49111800 |
Total |
Source: The researcher based on ArcMap software
Table 3. Transformation of usage area in the city of Kufa between 2022 and 2032
|
Transformation result/m2 |
Area 2032/m2 |
Area 2022/m2 |
Usage items |
|
607300 |
18579700 |
17972400 |
1 Constructors |
|
812200 |
1287700 |
475500 |
2 Green |
|
-7945600 |
8898200 |
16843800 |
3 Agricultural |
|
4989000 |
9465100 |
4476100 |
4 Open spaces |
|
2032000 |
9870200 |
7838200 |
5 Transfer |
|
-495000 |
1010800 |
1505800 |
6 Water bodies |
|
|
49111700 |
49111800 |
Total |
Source: The researcher based on ArcMap and IDRISI Selva
Table 4. Transformation of usage area in Kufa between 2022 and 2052
|
Transformation result/m2 |
Area 2052/m2 |
Area 2022/m2 |
Usage items |
|
4809400 |
22781800 |
17972400 |
1 Constructors |
|
1122500 |
1598000 |
475500 |
2 Green |
|
-11619700 |
5224100 |
16843800 |
3 Agricultural |
|
3669300 |
8145400 |
4476100 |
4 Open spaces |
|
2718900 |
10557100 |
7838200 |
5 Transfer |
|
-698500 |
807300 |
1505800 |
6 Water bodies |
|
|
22781800 |
49111800 |
Total |
Source: The researcher based on ArcMap and IDRISI Selva
(1) Formal transformations occur in cities as a function of the time, and occurred in the city of Kufa as a result of the inability of the city's basic master plan (from 1958 to the last modern foundation master plan in 2007) to keep pace with the city's rapid urban growth.
(2) The total areas of land use for each year should be equal to the area of the city master plan, and her the total areas should be equal to the 2007 master plan area, which is approximately 49111800 m2.
(3) In Kufa city, the area of almost land uses, is constantly increasing, except agricultural use, which decreasing, and that is against the principles of sustainability, for the reason of consumes and damages the structure of the city. 1161 hectares of transformation was accrued in Kufa city, and it's worth noting that water bodies in the city are decreasing in size due to droughts, Because the software measures this difference in the probability matrix and the images of the police probability, this is shown in the results clearly and according to the analysis of Markov's chain.
(4) These formal transformations that the city is pass, by are the result of the dynamism of its structure, that most of these transformations have been unplanned, that they have not been controlled, that modern technologies and mathematical models are methods by which to see where things can reach in a city? to plan and control them, and try to reinforce positive aspects and reduce negative one.
(5) The paper contributes to predicting the future of transformations in cities, and it Proving that through, the urban growth resulting from the increase in population, the built-up area of the city of Kufa is increasing considerably, reaching 1797 hectares for the time being. And the increase will continue to reach 1857 hectares over the next 10 years and could reach 2278 hectares over the next 30 years.
The research recommends the following:
(1) Complementing the topic by trying to put an end to the formal transformations in city structure, and trying to control them by shaping a future structure in more sustainable and sophisticated ways.
(2) Trying to absorb population increases because they are the basis for changing the structure of cities by activating the role of planning by providing uses such as housing and services within the basic scheme, in order to prevent the depletion of the structure of cities by changing their uses in indiscriminate ways.
This research was assisted by a MSC student from the University of Kufa, who calculated transformations area during time using Spatial analysis tools of ArcMap software, and this research it is not financially supported by anyone.
|
CA |
Cellular automates, |
|
MC |
Markov Chain |
[1] Sideeq, S.J., Fathy, I.A., Ali, A.F. (2019). The impact of formal transformations in the structure of architectural identity Duhok city case study. Sulaimania Journal for Engineering Sciences, 6(1): 28-44. https://www.iasj.net/iasj/article/166030
[2] Albasri, N.A., Mustafa, M.H., Aliasghar, M.S. (2023). The impact of regional level land use on the urban functional changes. International Journal of Sustainable Development and Planning, 18(2): 475-482. http://dx.doi.org/10.18280/ijsdp.180216
[3] Abbas, S.S., Tariq, A. (2005). Transformations in Urban Design. The Iraqi Journal of Architecture and Planning, 5(8): 44-62. https://www.iasj.net/iasj/article/11509.
[4] Al-Hankawi, W.S., Al-Muhammadi, M.H. (2009). Formal transformations in the urban context. Iraqi Journal of Architecture and Planning, 8(16-18): 60-82. https://www.iasj.net/iasj/article/11516.
[5] Abbas, S.S., Sattar, K.A.A. (2012) The dynamics of urban growth in the cities of Iraq. Journal of Planning and Development, 17(2): 239-257. https://www.iasj.net/iasj/article/74560.
[6] Al-Hankawi, W.S., Suleiman, V. (2008). The transformation within the urban structure. Iraqi Journal of Architecture and Planning, 7(14-15): 141-171. https://www.iasj.net/iasj/article/11507.
[7] Habitat. (2016). Urbanization and development emerging futures. https://unhabitat.org/world-cities-report-2016.
[8] Aburas, M., Ho, Y., Ramli, M., Ashaari, Z.H. (2017). Improving the capability of an integrated CA-Markov model to simulate spatio-temporal urban growth trends using an Analytical Hierarchy Process and Frequency Ratio. International Journal of Applied Earth Observation and Geoinformation, 59: 65-78. https://doi.org/10.1016/j.jag.2017.03.006
[9] Aburas, M.M., Ho, Y.M., Pradhan, B., Salleh, A.H., Alazaiza, M.Y. (2021). Spatio-temporal simulation of future urban growth trends using an integrated CA-Markov model. Arabian Journal of Geosciences, 14: 1-12. https://doi.org/10.1007/s12517-021-06487-8
[10] Gharaibeh, A., Shaamala, A., Obeidat, R., Al-Kofahi, S. (2020). Improving land-use change modeling by integrating ANN with Cellular Automata-Markov Chain model. Heliyon, 6(9): e05092. https://doi.org/10.1016/j.heliyon.2020.e05092
[11] Aburas, M.M., Ho, Y.M., Ramli, M.F., Ash’aari, Z.H. (2016). The simulation and prediction of spatio-temporal urban growth trends using cellular automata models: A review. International Journal of Applied Earth Observation and Geoinformation, 52: 380-389. https://doi.org/10.1016/j.jag.2016.07.007
[12] Aburas, M., Abdullah, S., Ramli, M., Ash'aari, Z. (2015). Evaluating urban growth phenomena in seremban, malaysia, using land-use change-detection technique. Advances in Environmental Biology, 9(27): 317-325.
[13] Issa, S.H. (2008). The map of the Arab Islamic city (Najaf and Kufa as a model). Published Research, Journal of Kufa Literature, 1(5). https://doi.org/10.36322/jksc.v1i5.4676
[14] Khalif, S.N. (2017). The subject of the largest Arab site in the world. https://mawdoo3.com.
[15] Jaber, Z.A. (2015). Study of change in land uses, the city of Kufa using GIS. Urban and Regional Planning Centre/University of Baghdad. https://2u.pw/63LJVU.
[16] Urban Planning Directorate. (2014). (Historical phase charts) Locally adopted standards tables. Najaf al-Ashraf: Directorate of Urban Planning in Najaf.
[17] Urban Planning Directorate. (2014). (Historical phase charts) Locally adapted standards tables. Najaf al-Ashraf: Directorate of Urban Planning in Najaf.
[18] Najaf Municipality District. (2014). Data from the Ministry of Reconstruction and Municipalities. masjed-alkufa.
[19] Secretariat of the Kufa Mosque and the shrines attached to it. (2016). http://masjed-alkufa.com/index.php/permalink/3195.html.
[20] Anderson, J.R. (1976). A land use and land cover classification system for use with remote. US Government Printing Office, 28. https://doi.org/10.3133/pp964