Mohammad Tariq Al Fozaie*![]()
© 2023 IIETA. This article is published by IIETA and is licensed under the CC BY 4.0 license (http://creativecommons.org/licenses/by/4.0/).
OPEN ACCESS
There are various hypotheses as to why some nations are more developed than others, including political instability, corruption, and exclusive institutions. However, one hypothesis that has not been extensively studied is the impact of ‘bad behavior’ on development. To test the validity of such hypothesis, a composite index must be developed to quantify such behavior, and facilitate for the study of its impact on development. This study aims to lay the foundation for the development of such index by conducting a bibliometric analysis of Scopus and Web of Science databases to determine if a quantitative measure of this concept already exists. This study employs a bibliometric and content analysis of these databases using Excel, VOSviewer, and R software. The results of such analysis indicate the absence of such a composite measure, thereby providing sufficient evidence that the construction of a ‘Bad Behavior Index’ is justified. Regarding the research contribution, the study offers an improved methodology for conducting bibliometric analysis by integrating and analyzing two journal databases instead of one, and using three different mediums and methods to identify the absence of knowledge, and provide a justification for the creation of such knowledge.
bad behavior, bibliometric analysis, composite index, development, keyword analysis
The question why some countries are more developed than others has been occupying the minds of academics and politicians alike for decades. Various hypotheses have been raised and studied on this subject. Gezer [1] contends that economics freedoms are pivotal for short and long-run development. Priambodo [2] blames unemployment and poverty for the poor development of nations. Mo [3] finds that corruption is detrimental to growth. Whilst Alesina et al. [4] find that political instability negatively impacts growth. Rehman and Askari [5] blames government and their respective policies for the poor development of Middle east countries. Robinson and Acemoglu [6] emphasize the importance of institutions on development, particularly the presence of inclusive institutions, i.e., institutions which facilitate for equal opportunities, and the absence of extractive institutions, i.e., institutions which are exclusive in nature and are controlled by the few. The forestated are but a few of the many explanations as to why some nations are less developed than others. These determinants of development can be categorized into internal and external factors – i.e., the causes for the poor development are coming from within the country, overpopulation for example, or due to external factors such as economic sanctions. Once such hypothesis that is not well established is that some nations are underdeveloped due to internal forces such as the bad behavior of individuals and institutions. Al Attas [7] brushed upon this hypothesis when he discussed how individual culpability is to blame for the collapse of Muslim civilizations of the past, stating that “it is important to stress the individual in seeking a just solution to our problem rather than the society and the state”.
Despite the critical role bad behavior can play in determining a nations level of development, i.e., corruption [8], restricting economics freedoms [9], poor knowledge creation [10] etc., few studies attempt to examine the impact of individual and institutional behavior on development. This research gap can be attributed to a lack of interest on the subject, or it could be attributed to the endogeneity problem, or due to a lack of a framework that properly defines what constitutes bad behavior, and how and whether it can be quantified. This in turn can lead to a gap in our understanding of how behavior can impact development.
To address this gap, this researcher seeks to further explore the relationship between behavior and development by developing a quantitative measure of the development hindering behavior of individuals and institutions, i.e., the ‘Bad Behavior Index’ (BBI), to facilitate for a better understanding of how behavior impacts development. To achieve this objective, a precursor step must be completed, which is to analyze academic literature for the presence of such a measure using a statistical method known as bibliometric analysis.
Bibliometric analysis is one of three major data review methods used by researchers, the others being Systematic Literature Review and Meta-Analysis [11]. Systematic literature review is primarily used to summarize and integrate the findings of existing literature for a particular field or topic. It involves the qualitative analysis of a small dataset with a specific scope. On the other hand, meta-analyses are utilized to summarize evidence of the existence of a relationship between variables, whilst highlighting the existence of a relationship between variables which are yet to be studied. It involves the quantitative analysis of both large and small datasets, and it can have both broad and specific scope of work. Lastly, bibliometric analysis is a rigorous statistical method which facilitates for the analysis of a large volume of literature.
Bibliometric analysis is utilized over other review methods due to its ability at handling large volumes of data, its ability at producing high research impact, its ability at summarizing current and emerging trends of a particular research topic or field, its ability at identifying gaps in literature, and its ability to facilitate for both quantitative and qualitative analysis [11].
For the purpose of this study, bibliometric analysis is the most appropriate review method since it can be used to identify knowledge gaps regarding particular keywords or concepts such as “behavior index”. To elaborate, if there is a lack of publications or citations on "behavior index", it may indicate that there is limited knowledge on the topic, and one can use this information to conclude that there is no existing composite measure relative to this term. However, it is important to note that bibliometric analysis should be used in conjunction with other methods, such as a comprehensive literature review to provide a more comprehensive understanding of the topic [12]. Although bibliometric analysis is primarily used to study existing knowledge through trend analysis, co-occurrence networks and others, it can also be used to study the presence or absence of keywords to identify research gaps [13, 14].
It must be noted that most bibliometric studies conduct their analysis of one journal database, and that is because collecting data from more than one database is unpractical due to “the difficulty of transposing data from multiple databases into a single format” [15]. Regarding the limitation of using one database for bibliometric analysis, the authors address this limitation by stating that it is generally acceptable as the subset of the published articles provide a general idea of the larger scientific community. With that said, Echchakoui [16] and Caputo and Kargina [17] are some of the few scholars who have attempted to combine databases, particularly Scopus and Web of Science (WOS), with the former positing that individually analyzing the databases “cannot give a broader view of knowledge and tendencies in a field”, and that despite the high correlation between the two databases, according to Gavel and Iselid [18], it is necessary to combine the two databases due to the many disparities between the two databases.
Regarding the paper selection process, there are several contingencies researchers must take into consideration [15]. To elaborate, the papers must be peer-reviewed, include at least one of the keywords or concepts of the research, a publication year range must be fixed, the papers must be indexed under the selected database with a particular journal classification code, and the paper must be referenced for a particular number of times – in this regard, the authors chose the number ten, stating that it might be an arbitrary figure, but due to a lack of a benchmark from literature, the choice is rational [15]. The most important factor in selecting the papers, as long as they include one of the keywords of the research, is the frequency of citations, as this is the best measure of the quality and influence of the papers [19, 20].
According to Zupic and Čater [21] the workflow for science mapping has five stages: 1) Study Design; 2) Data Collection; 3) Data Analysis; 4) Data Visualization; and 5) Interpretation. The study design involves selecting the most appropriate method, such as co-citation analysis, keyword analysis, or co-occurrence analysis etc., to address the research question. For this study for example, this involves identifying the most appropriate method for answering the question whether any current composite measures exist that quantify the development hindering behavior of individuals and institutions. Regarding the data collection process, it involves selecting the appropriate database(s) to compile the bibliometric data, and refining the data to only include the most relevant literature. A post-procedure of the data collection process is data aggregation, which involves summarizing and combining the raw data from Scopus and WOS databases into a more meaningful and manageable format. Data analysis follows, and it involves selecting the appropriate software, further cleaning of the data, and the identification of groups, networks, and clusters if it is of relevance to the research. The next step is data visualization, which involves selecting the appropriate visualization method and software to provide a visual summary of the bibliometric data. Lastly, data interpretation involves a discussion and interpretation of the findings of the science mapping process.
To achieve the objective of this study, the methodology recommended by Zupic and Čater [21] is adopted. The first step of this methodology is to establish a research design that focuses on keyword analysis, similar to the approach used by Dash and Kalamdhad [14]. This involves initiating a bibliometric search using Boolean operators to search for relevant literature using keywords relevant to the BBI, such as behavior and development, while setting specific criteria and objectives to filter out irrelevant articles.
The second step of the science mapping workflow is the data collection and aggregation. This research follows in the steps of Echchakoui [16] and Caputo and Kargina [17] and conducts a bibliometric analysis of merged results of both Scopus and WOS databases (Method 1) to address the gaps for unaccounted articles when simply analyzing a single database.
With that said, and in accordance with the methodology of most bibliometric studies, a bibliometric analysis is also conducted for a single database (Method 2). The database of choice in this instance is Scopus since it covers 84% of the journals in WOS [18]. The purpose of analyzing a single database is to address the limitations of combining databases, as well as the limitations of the software’s utilized for the bibliometric analysis, i.e., VOSviewer [22] and R package ‘bibliometrix’ [23]. Another reason for utilizing a single database is to facilitate for a comparison of the combined results and the individual database results.
Lastly, a bibliometric analysis of the ‘unrefined’ Scopus results will be conducted (Method 3). This method ensures that by refining or cleaning up the data, no relevant articles are being excluded simply because they pertain to fields which are not within the scope as the phenomenon being studied. This method has a very limited scope since it solely focuses on any articles which include the keyword ‘Behavior Index’.
Regarding the keywords utilized for the data analysis, i.e., step 3 of the science mapping workflow, they are as follows:
• Bad Behavior OR Behaviour.
• Unethical Behavior OR Behaviour.
• Ethical Behavior OR Behaviour.
• Mafsada OR Mafsadah.
• Index.
• Development.
• Socio-economic.
The reason for including different spellings for the words ‘behavior’ and ‘mafsada’, i.e., harm according to the concept of ‘Maqasid Al Shariah’ which serve as influence for the selection of the proxies of the index being developed, is to accommodate for any alternative spellings by the authors of the selected articles. It must be noted that unlike Phillips and Ozogul [15], this paper adopts a contingency that two of the chosen keywords must be present for the sake of reducing noise. Moreover, the keywords included in the database search criteria for WOS focused on a search by ‘topic’, with a further search criterion based on paper title, abstract, author keywords, and ‘Keywords Plus’. Regarding Scopus database, the search was based on ‘Keywords’. The reason for the discrepancy in the search criterion is due to differences in the build of the search engines for the selected databases.
Regarding the publication year range, given that composite indices were born from the OECD [24] framework for developing composite indices, the year range begins with 2008 and ends with the present. Regarding the publication type, and to ensure that results are highly inclusive, all publication types, i.e., journal articles, conference papers etc., are included. Furthermore, peer review status is not specified to achieve the objective of high inclusivity.
The software’s utilized to aggregate and analyze the data are Excel, R (bibliometrix package), and VOSviewer. Whereas excel allows one to identify and remove any duplicate data between the two database results, the bibliometrix package in R allows one to combine, analyze and map the results [25]. On the other hand, VOSviewer facilitates for the data visualization process by presenting the data in the form of co-occurrence analysis and density visualization maps etc.
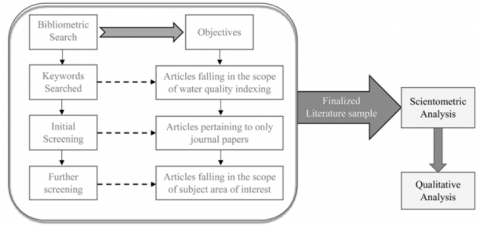
The final step of the methodology before results are ready for analysis and interpretation is to further refine the results by excluding any papers which pertain to a different field, subject, or phenomenon the researcher is attempting to study. For example, and in the case of the BBI, papers pertaining to fields such as Economics; Social Sciences Interdisciplinary; and Behavioral Sciences are to be included, whilst papers related to Computer Science; Engineering; and Medicine, for example, are to be excluded. This process of cleaning the data is imperative for the integrity of the results, as the bibliometric analysis might include papers which might include the keywords the researcher is seeking, but the papers will be quite distinct from the phenomenon they are attempting to study – i.e., false association. In closing, the study’s bibliometric methodology is influenced by the methodology of Dash and Kalamdhad [14], and can be summarized as follows (Figure 1):
Figure 1. The study's bibliometric methodology
Note: Figure 1 is borrowed from Dash and Kalamdhad [14]
For the combined databases, two queries were conducted. The first query does not specify the field to be analyzed, as the focus is to identify the presence of the keywords in all the fields included in Scopus and WOS databases. The second query facilitates for more specific results, by only including results which are specific to the fields of Economics, Social Sciences Interdisciplinary, Behavioral Sciences (WOS); and Economics, Econometrics and Finance, Social Sciences (Scopus). The results of these queries are presented in Table 1.
Since the results of the bibliometric analysis presented in Table 1 are quite exhaustive, the next step is to limit the analysis to the specific results, i.e., Query 2 or Columns 4 and 5 in Table 1, and particularly the keywords ‘behavior’ and index’, and to only include results for journal articles. The results of this analysis are presented in Table 2.
Table 1. Scopus and WOS keyword search results
|
All Fields |
Specific Fields |
|||
|
Keywords |
S |
W |
S |
W |
|
“Bad Behavior Index” |
- |
- |
- |
- |
|
“Unethical Behavior Index” |
- |
- |
- |
- |
|
“Behavior Index” |
425 |
1,020 |
10 |
22 |
|
“Behavior” AND “Index” |
40,161 |
72,570 |
1,878 |
4,441 |
|
“Behavior” AND “Index” AND “Development” |
1,579 |
7,060 |
138 |
820 |
|
“Bad Behavior” |
12 |
382 |
3 |
29 |
|
“Behavior Index” AND “Development” |
6 |
78 |
- |
6 |
|
“Behavior Index” AND “Socioeconomic” |
4 |
7 |
1 |
2 |
|
“Unethical Behavior” |
399 |
1,541 |
193 |
165 |
|
“Unethical Behavior” AND “Development” |
6 |
146 |
5 |
25 |
|
“Ethical Behavior” AND “Development” |
32 |
324 |
15 |
55 |
|
“Unethical Behavior” AND “Index” |
2 |
26 |
1 |
7 |
|
“Unethical Behavior” AND “Socioeconomic” |
1 |
10 |
- |
2 |
|
“Mafsada” AND “Index” |
- |
- |
- |
- |
|
“Mafsadah” AND “Index” |
- |
- |
- |
- |
|
“Development Index” |
2,479 |
4,238 |
1,182 |
775 |
|
“Socioeconomic Index” |
67 |
244 |
16 |
13 |
|
“Development” AND “Index” |
26,200 |
116,317 |
3,790 |
7,316 |
|
“Socioeconomic” AND “Index” |
11,546 |
17,751 |
1,437 |
731 |
Notes: 1. “S” and “W” refer to Scopus and WOS databases respectively. 2. Since two databases are utilized and data is yet to be refined, results are not unique, and duplicates exist. 3. WOS search results include the combined outcomes for the keyword ‘behavior’ and its spelling variant ‘behaviour’.
Table 2. Scopus and WOS refined results
|
Keywords |
Specified Fields |
|
|
Scopus Results |
WOS Results |
|
|
“Behavior Index” |
10 |
17 |
|
“Behaviour Index” |
10 |
5 |
|
“Behavior” AND “Index” |
1,878 |
3,611 |
|
“Behaviour” AND “Index” |
1,878 |
830 |
|
“Behavior” AND “Index” AND “Development” |
138 |
665 |
|
“Behaviour” AND “Index” AND “Development” |
138 |
155 |
|
“Unethical Behavior” AND “Index” |
1 |
2 |
|
“Unethical Behaviour” AND “Index” |
1 |
- |
Despite only considering Query 2 results, the bibliometric data included articles pertaining to fields that are irrelevant to the phenomenon being measured. As such, further data cleanup is required. Beginning with Scopus database, 2,027 articles (Table 2) were further refined to exclude irrelevant fields. The result of this cleanup is presented in Table 3:
Table 3. Scopus search results excluding irrelevant fields.
|
Keywords |
Results |
|
“Behavior Index” |
3 |
|
“Behavior” AND “Index” |
144 |
|
“Behavior” AND “Index” AND “Development” |
3 |
|
“Unethical Behavior” AND “Index” |
1 |
Notes: Each row represents a query, and the results were achieved by running queries to only include articles under the fields of 1) Mathematics or Social Sciences or Economics, Econometrics and Finance or Psychology; 2) Psychology or Mathematics or Decision Sciences or Business, Management, and Accounting; 3) Psychology or Decision Sciences or Business, Management, and Accounting; 4) Not refined.
Regarding the WOS search results, 5,285 articles (Table 2) were further refined to exclude irrelevant fields. The refined WOS search results are presented in Table 4 as follows:
Table 4. WOS search results excluding irrelevant fields
|
Keywords |
WOS Results |
|
“Behavior Index” |
3 |
|
“Behaviour Index” |
1 |
|
“Behavior” AND “Index” |
124 |
|
“Behaviour” AND “Index” |
100 |
|
“Behavior” AND “Index” AND “Development” |
27 |
|
“Behaviour” AND “Index” AND “Development” |
22 |
|
“Unethical Behavior” AND “Index” |
7 |
|
“Unethical Behaviour” AND “Index” |
- |
Notes: Each row represents a query, and the results were achieved by running queries to only include articles under the fields of 1) Mathematics Interdisciplinary Applications or Social Sciences Mathematical Methods or Business or Statistics Probability; 2) Business Finance or Mathematics Interdisciplinary Applications or Social Sciences Mathematical Methods; 3) Only include articles under the field of: Social Sciences Mathematical Methods or Development Studies or Psychology Multidisciplinary or Social Sciences Interdisciplinary; 4) Social Issues or Religion or Multidisciplinary Sciences or Sociology or Business or Mathematics Interdisciplinary Applications or Management or Social Sciences Mathematical Methods or Business Finance; 5) Development Studies or Business or Management or Social Sciences Interdisciplinary or Psychology Multidisciplinary or Mathematics Interdisciplinary Applications; Sociology or Business or Management or Statistics Probability or Social Sciences Mathematical Methods or Social Issues or Operations Research Management Science; Economics AND Ethics AND Business.
The final step of the data cleanup process is to ensure that duplicates do not exist, to only include publications in their final stage, and to only include publications in English, an optional step this research has decided to adopt since some content can be mistranslated and misinterpreted. The final cleanup process reveals that a total of 385 journal articles are to be included in the bibliometric analysis – 242 articles pertaining to WOS, and 143 articles pertaining to Scopus.
3.1 Method 1: WOS and scopus results in VOSviewer and bibliometrix package
Once the data is collected and refined, the next step is to visualize and interpret the data. Several science mapping techniques exist for visualizing bibliometric data [11]. Such techniques include citation analysis which facilitate for identifying the relationship between publishers, as well as reveal the most influential publications among the data being studied. A similar technique is the co-citation analysis, which exhibit the relationship among cited publications as well as exhibit foundational themes. Another technique is bibliographic coupling which exhibit the relationship among citing publications as well as periodical or current themes. A fourth technique is the co-authorship analysis which identifies possible relationships between the authors, as well as identify the authors affiliation by country and institution. A fifth technique is the co-word or co-occurrence analysis, which serves the purpose of revealing any current or future relationships among the topics, fields, content, keywords etc. In addition to keyword analysis, co-word or co-occurrence analysis is the science mapping technique most fitting for the purpose of this research, since allows to identify the presence or absence of any content the researcher is seeking to find – i.e., does the BBI exist? In short, keyword and co-occurrence analysis can complement each other by providing different types of insights into the underlying structure of a research field. To elaborate, whereas keyword analysis can be utilized to identify the presence or absence of keywords and concepts, co-occurrence analysis can be utilized to identify relationships between these keywords and concepts – if such keywords and concepts exist.
The forestated science mapping techniques can be performed via VOSviewer. VOSviewer is a software which facilitates for the visualization and analysis of bibliometric data. The software provides researchers with many features to assist them in their bibliometric analysis. Some of these features include but are not limited to citation analysis, bibliographic coupling, co-authorship analysis, co-occurrence analysis, and many others. The core competency of VOSviewer is its ease of use, its ability to process large data, and its excellent bibliometric data visualization relative to software such as SPSS and Pajek which have been traditionally used for bibliometric analysis [22].
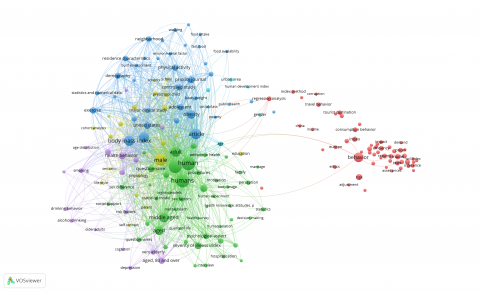
The keyword and co-occurrence analysis were conducted via VOSviewer for the combined Scopus and WOS databases. For the 385 articles included in the analysis, a threshold value of 5 was set for the co-occurrence analysis, whereas no threshold was set for the keyword analysis. Of the 3,018 keywords in the bibliometric data, 183 keywords met this threshold. Moreover, for each of the 183 keywords selected, the total strength of the co-occurrence link will be calculated and the words with the greatest strengths will be shown in the co-occurrence map. The co-occurrence map of the 183 keywords is presented in Figure 2.
Figure 2. VOSviewer co-occurrence analysis map
Further analysis of the co-occurrence map shows the presence of 6 clusters. Clustering is a technique which groups the journals into related fields. The clustering technique utilized is a modularity-based clustering method based on Clauset et al. [26]. According to the 183 items included in the clusters, only 11 items pertain to the term ‘Behavior’ or ‘Behaviour’, whilst the keyword ‘Behavior/Behaviour Index’ is missing. The keywords present in these clusters are as follows: ‘adaptive behavior’; ‘behavior’; ‘child behavior’; ‘consumption behavior’; ‘coping behavior’; ‘drinking behavior’; ‘feeding behavior’; ‘health behavior’; ‘social behavior’; ‘tourist behavior’; ‘travel behavior’.
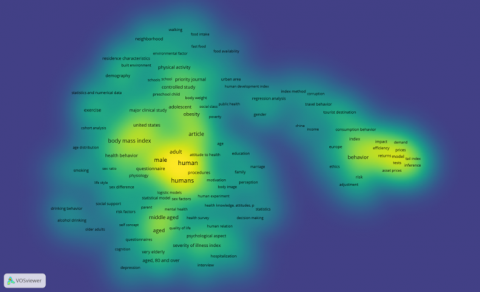
An alternative view that can be applied to the co-occurrence analysis is the density visualization view. The benefit of this method is that it highlights the most prominent keywords in the bibliometric data being analyzed, with lesser visual emphasis on the linkage between them. Figure 3 exhibits the density visualization of the co-occurrence analysis of the 385 documents retrieved from Scopus and WOS databases.
Figure 3. Density visualization map
Elaborating upon the density visualization map, one of the primary keywords being investigated is ‘Behavior Index’ or ‘Behaviour Index’. According to the density visualization, the keyword ‘Behavior’ is present, centered on the right side of Figure 3, but confirming the results of the cluster analysis, the keywords are missing from the articles being analyzed.
3.1.1 Content analysis
The fifth step of the scientific mapping workflow is data interpretation. Whilst interpreting the visualized data in VOSviewer, it becomes clear that co-occurrence analysis alone is insufficient to identify the presence or absence of the measure this research seeks to develop. To elaborate, one of the limitations of co-occurrence analysis in VOSviewer is that it focuses on the linkage between keywords and articles and excludes any articles that might contain the keywords but the minimum threshold level is not met. To elaborate, the keywords threshold used for the co-occurrence analysis in this research is the default setting of the VOSviewer software, and that is a threshold value of 5. Even though this facilitates for the study of the relationship between the various articles included in the bibliometric data, it does not fully serve the purpose of this paper which is to identify the presence of any quantitative measures of the development hindering behavior of individuals and institutions. As such, if the co-occurrence analysis reveals that the keywords are missing from the bibliometric data, the analysis must be supplemented with a content analysis which focuses on the presence of the keywords rather on the relationship or links between them.
Further analysis can be performed by individually reviewing the 385 journal articles included in the bibliometric analysis, or by utilizing statistical software such as R, and in particular, the package biblometrix. This package “provides a set of tools for quantitative research in bibliometrics” [23], with the purpose of facilitating for data collection, data analysis, and data visualization. Besides facilitating for the integration of Scopus and WOS bibliometric data, the bibliometrix package in R allows the researcher to consolidate their findings in VOSviewer by identifying the presence of the keywords they are investigating.
3.1.2 Content and keyword analysis in R
This section elaborates on how to conduct a content and keyword analysis using the bibliometrix package in R, as well as presenting the results of this analysis.
The first step on how to utilize the bibliometrix package in R is to Open R and load the package bibliometrix: library(bibliometrix). The second step is to run the code for the biblioshiny app, which provides a user-friendly web interface for bibliometric analysis: biblioshiny(). Once the web interface is loaded, the third step is to click on ‘Data’, in the top navigation bar, and select ‘Import or Load Files’. A precursor step to uploading the data file is the data aggregation process, which involves manually merging the bibliometric data from Scopus and WOS databases and transforming them into a single format either by following the steps highlighted by Echchakoui [16], or to simply reformat the data of one database so that it is in line with the formatting of the other database. In the case of this research, the WOS bibliometric data was reformatted to fit the style of the Scopus data. The fourth step is to select ‘Import raw file(s)’, database of choice, and upload the file by clicking ‘Browse’ and selecting the appropriate file from the directory of choice. Once the dataset is imported, the fifth step is to click on ‘Documents’ in the top navigation bar and select ‘Most Frequent Words’. The sixth step is to select ‘Keywords Plus’ followed by ‘Authors Keywords’ and click ‘Apply’ – these options are available on the left-hand navigation pane. The seventh and final step is to select the ‘Table’ option, on the right-hand pane, and enter the keywords central to the study’s bibliometric analysis in the search bar on the right. The results, if any, will appear directly below the search bar.
The content analysis for the keywords ‘Behavior Index’ and ‘Behaviour Index’ in R return three results for each of the respective keywords and they are as follows: ‘behavior problem index (bpi)’; ‘herd behavior index’; ‘risk-taking behavior index’; ‘consumer behaviour change index’; ‘index of responsible corporate behaviour towards consumers (i-rcbc)’; ‘nexus eco-purchasing behaviour index’. The results of the content and keyword analysis in R confirm the results of the co-occurrence analysis, which is there are no studies in the selected bibliometric data that attempt to quantify the development hindering behavior of individuals and institutions, particularly given the keywords ‘Behavior or Behaviour’ and ‘Index’ in mind.
3.2 Method 2: Single database ‘Refined’ results
To consolidate the results of the merged Scopus and WOS databases, a bibliometric analysis of a single database (Scopus) is conducted. The keywords were limited to: “Behavior” AND “Index”; “Unethical Behavior” AND “Index”; and “Behavior” AND “Index” AND “Development”. Moreover, literature was limited to the fields of “Social Sciences” and “Economics, Econometrics, and Finance”. The initial search results returned 1,741 documents and their breakdown by field is as follows: Social Sciences (48% of documents); Economics, Econometrics etc. (39% of documents); Business, Management etc. (13% of documents).
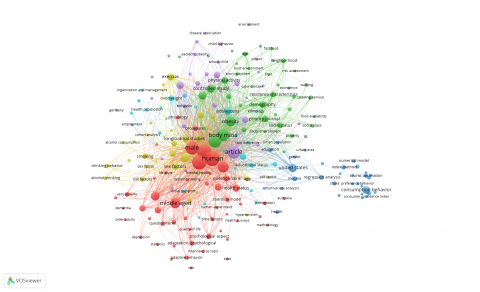
The results were further refined and a final document count of 259 was achieved. The bibliometric data was analyzed in VOSviewer similar to the data of the merged databases. Of the 2,161 keywords which meet the threshold value of 5, 206 were included in the analysis. The results of the co-occurrence analysis VOSviewer are presented in Figure 4, whereas the results of the keyword analysis are as follows: ‘adaptive behavior’; ‘adolescent behavior’; ‘behavior’; ‘child behavior’; ‘choice behavior’; ‘consumption behavior’; ‘coping behavior’; ‘drinking behavior’; ‘feeding behavior’; ‘health behavior’; ‘high risk behavior’; ‘preference behavior’; ‘sedentary behavior’; ‘sexual behavior’; ‘social behavior’; ‘tourist behavior’; ‘travel behavior’.
Figure 4. Co-occurrence analysis map (Scopus)
Further analysis in R bibliometrix package was performed on the single database, and the results are also in line with the findings of VOSviewer analysis, and that is, like the merged databases, the BBI does not exist, i.e., the content analysis for the keywords ‘Behavior Index’ and ‘Behaviour Index’ in R for a single database return a total of five results for the respective keywords, none of which are relevant to the phenomenon being measured: ‘behavior problem index (bpi)’; ‘behavior problems index (bpi)’; ‘risk-taking behavior index’; ‘consumer behaviour change index’; ‘index of responsible corporate behaviour towards consumers (i-rcbc)’. In summary, the results of the co-occurrence and keyword analysis for the combined (Method 1) and single (Method 2) databases are in line, which indicates that the results are valid and consolidated.
3.3 Method 3: Single database ‘Unrefined’ results
To ensure that no articles were excluded from the literature in the cleanup process in Method 1 and 2 presented earlier, the results of a single database (Scopus) will be analyzed where no articles are excluded because they pertain to a different field to the phenomenon being studied by the researcher. The scope of this method is very specific, with only publications which include the keyword ‘Behavior Index’ are included in the bibliometric analysis. The Scopus search query returns the result of 425 documents, of which none have been subjected to further cleanup either by field, publication type, or otherwise.
Analyzing the bibliometric data in VOSviewers, and forgoing the option to apply a threshold level to the data, returns a result of 4,734 keywords. Of these 4,734 keywords, 32 pertain to ‘behavior index’ and 8 pertain to ‘behaviour index’. The results of the keyword analysis are as follows: ‘aberrant drug behavior index’; ‘activity sleep behaviour index’; ‘animal behavior index’; ‘behaviour index’; ‘antisocial behavior index’; ‘behaviour index (k)’; ‘behavior index’; ‘flow behaviour index’; ‘behavior indexes’; ‘health-promoting behaviour index’; ‘bicyclist behavior index naturalistic riding’; ‘maternal health seeking behaviour index’; ‘child behavior index’; ‘multiproblem behaviour index’; ‘child distress behavior index’; ‘nexus eco-purchasing behaviour index’; ‘conservation behavior index’; ‘driving behavior index’; ‘environmentally responsible behavior index (irbi)’; ‘flow behavior index’; ‘flow behavior index (dimensionless)’; ‘fluid behavior index’; ‘garos sexual behavior index’; ‘generalized flow behavior index’; ‘health and behavior index’; ‘healthy behavior index’; ‘herd behavior index’; ‘knowledge-creating behavior index’; ‘motor behavior index’; ‘multiple problem behavior index’; ‘n (flow behavior index)’; ‘risk-taking behavior index’; ‘rock behavior index (rbi)’; ‘seismic behavior index’; ‘smoking behavior index’; ‘soil behavior index’; ‘soil behavior index (ic)’; ‘the criminal behavior index’; ‘unhealthy behavior index’; ‘unhealthy weight control behavior index’.
Further analysis of these keywords and the publications they relate to, confirms the results of the previous methods, i.e., Methods 1 and 2, and that is no existing measure of development hindering behavior exists among the literature reviewed.
This study raises the question of whether any composite measures exist within academic literature to quantify the bad behavior of individuals and institutions to better understand the relationship between, and the impact of behavior and development. To answer this question, a bibliometric and content analysis of Scopus and WOS databases were conducted. The results of such analysis confirm the absence of such measure. It must be noted that three methods were conducted to ensure sufficient due diligence was taken, and all three methods confirm the absence of a ‘Bad Behavior Index’. The findings of this study emphasize the importance of further research in this area and justifies the creation of the BBI.
Despite the high level of due diligence applied by the researcher, the study is not without its limitations. To elaborate, the study does not include all research databases which is a significant limitation since the measure this paper is attempting to identify its presence or absence could be included in an article published in one of the databases not included in this paper. Furthermore, journals published in a foreign language, have a lower impact factor, or are not indexed by Scopus and WOS, i.e., the databases selected for the bibliometric analysis in this study, are not included in the analysis. Thus, many publications have not been included in the bibliometric analysis. Another limitation of this study pertains to how some authors might fail to list key terms in their title, abstract, or keywords, or might simply use similar but not identical words, i.e., synonyms, which could lead to the exclusion of various publications. Another limitation of this study is how qualitative interpretations of the bibliometric data can be subjective. Another limitation which is a result of subjectivity is setting a certain threshold level for the occurrence of keywords in VOSviewer, as it leads to the exclusion of many publications. It must be reiterated that the threshold levels are a default setting of the VOSviewer software, and it is up to the researchers to adjust this level as they see fit. Lastly, a significant limitation of bibliometric analysis is how it is subject to time sensitivity – i.e., by the time this research is published, the number of papers which include the key terms will change.
Despite the limitations of this study, significant due diligence has been performed to ensure that the quantitative measure the researcher seeks to introduce is yet to be developed. Moreover, despite the limitations of bibliometric analysis, it is a highly suitable method for achieving the research objectives due to its ability to tabulate and visualize the data which can provide great insight on the literature reviewed [27].
The purpose of this research is to conduct a bibliometric and content analysis of the presence of a quantitative measure of the development hindering behavior of individuals and institutions within the context of socio-economic development, i.e., the ‘Bad Behavior Index’. The study utilizes three methods for conducting this analysis which involves merging Scopus and WOS databases, the use of Scopus database alone with refined results, and the use of Scopus database without refining the results. The findings of this study confirm the absence of such quantitative measure, which gives the researcher the greenlight to proceed with the development of the BBI. This study makes two practical contributions. Firstly, it demonstrates how to perform high due diligence when conducting bibliometric and content analysis to identify the absence of knowledge, to facilitate the creation of new knowledge. Secondly, it highlights how to merge and utilize multiple databases when conducting bibliometric analysis, improving on the current practice of using a single database.
Regarding the study's academic contribution, it lies in providing a justification for the creation of a composite index that quantifies the bad behavior of individuals and institutions. This index can shed light on the relationship between behavior and development, elucidating why some nations are more developed than others. In sum, this study has practical implications for knowledge creation and bibliometric analysis, and facilitates for the development of future research that can have a significant contribution towards better understanding the relationship between behavior and development.
Regarding the study limitations, it must be noted that the methods utilized for the bibliometric analysis are not without their shortcomings, as such it is recommended to supplement these methods with further analysis where possible. This includes manually reviewing the bibliometric data, reducing the threshold levels, including non-peer reviewed publications, including other publication types such as conference papers, conducting the analysis for different databases, and any other method which could expand the search results. With that said, there is only so much the researcher can do when attempting to accomplish a task such as identifying gaps in literature such as the presence or absence of a quantitative measure similar to the BBI. As such, the most important facet of the researcher’s bibliometric efforts is due diligence, and that is to exhibit stringent effort when investigating the gaps in literature.
Future research can improve upon the bibliometric methodology of this study by addressing its limitations, enhancing its strengths, and by making value-adding additions. To elaborate, future research can address issues with the research methodology related to coverage and language bias, as well as addressing the issue of lack of contextual information which tends to plague scientometric studies. In addition, future research can extend the current methodology with the inclusion of altmetrics as a post-bibliometric process to compliment the citation-based metrics commonly used in bibliometrics, as well as provide an assessment of the broader impact of the study and its visibility.
The author would like to thank the editorial team and reviewers for their time in reading and reviewing the article.
[1] Gezer, M.A. (2020). The impact of economic freedom on human development in European transition economies. Economic Computation & Economic Cybernetics Studies & Research, 54(3): 161-178. https://doi.org/10.24818/18423264/54.3.20.10
[2] Priambodo, A. (2021). The impact of unemployment and poverty on economic growth and the human development index (HDI). Perwira International Journal of Economics & Business, 1(1): 29-36. https://doi.org/10.54199/pijeb.v1i1.43
[3] Mo, P.H. (2001). Corruption and economic growth. Journal of Comparative Economics, 29(1): 66-79. https://doi.org/10.1006/jcec.2000.1703
[4] Alesina, A., Özler, S., Roubini, N., Swagel, P. (1996). Political instability and economic growth. Journal of Economic Growth, 1(2): 189-211. https://doi.org/10.1007/BF00138862
[5] Rehman, S.S., Askari, H. (2010). How Islamic are Islamic countries? Global Economy Journal, 10(2): 1850198. https://doi.org/10.2202/1524-5861.1614
[6] Robinson, J.A., Acemoglu, D. (2012). Why nations fail: The origins of power, prosperity and poverty. New York: Crown Publishers.
[7] Al Attas. (1978). Islam and secularism. Muslim Youth Movement of Malaysia.
[8] Akçay, S. (2006). Corruption and human development. Cato Journal, 26(1): 29-48.
[9] Scully, G. (1992). Constitutional environments and economic growth. Princeton: Princeton University Press. https://doi.org/10.1515/9781400862832
[10] Pinto, T., Teixeira, A.A.C. (2020). The impact of research output on economic growth by fields of science: a dynamic panel data analysis 1980-2016. Scientometrics, 123(2): 945-978. https://doi.org/10.1007/s11192-020-03419-3
[11] Donthu, N., Kumar, S., Mukherjee, D., Pandey, N., Lim, W.M. (2021). How to conduct a bibliometric analysis: An overview and guidelines. Journal of Business Research, 133: 285-296. https://doi.org/10.1016/j.jbusres.2021.04.070
[12] Van Raan, A.F.J. (2005). Handbook of quantitative science and technology research: The use of publication and patent statistics in studies of S&T systems. Dordrecht: Springer.
[13] Pesta, B., Fuerst, J., Kirkegaard, E.O. (2018). Bibliometric keyword analysis across seventeen years (2000-2016) of intelligence articles. Journal of Intelligence, 6(4): 46. https://doi.org/10.3390/jintelligence6040046
[14] Dash, S., Kalamdhad, A.S. (2021). Science mapping approach to critical reviewing of published literature on water quality indexing. Ecological Indicators, 128: 107862. https://doi.org/10.1016/j.ecolind.2021.107862
[15] Phillips, T., Ozogul, G. (2020). Learning analytics research in relation to educational technology: Capturing learning analytics contributions with bibliometric analysis. TechTrends, 64(6): 878-886. https://doi.org/10.1007/s11528-020-00519-y
[16] Echchakoui, S. (2020). Why and how to merge Scopus and Web of Science during bibliometric analysis: The case of sales force literature from 1912 to 2019. Journal of Marketing Analytics, 8(3): 165-184. https://doi.org/10.1057/s41270-020-00081-9
[17] Caputo, A., Kargina, M. (2022). A user-friendly method to merge Scopus and Web of Science data during bibliometric analysis. Journal of Marketing Analytics, 10(1): 82-88. https://doi.org/10.1057/s41270-021-00142-7
[18] Gavel, Y., Iselid, L. (2008). Web of science and scopus: A journal title overlap study. Online Information Review, 32(1): 8-21. https://doi.org/10.1108/14684520810865958
[19] Shan, W., Wang, J. (2018). Mapping the landscape and evolutions of green supply chain management. Sustainability, 10(3): 597. https://doi.org/10.3390/su10030597
[20] Inamdar, Z., Raut, R., Narwane, V.S., Gardas, B., Narkhede, B., Sagnak, M. (2020). A systematic literature review with bibliometric analysis of big data analytics adoption from period 2014 to 2018. Journal of Enterprise Information Management, 34(1): 101-139. https://doi.org/10.1108/JEIM-09-2019-0267
[21] Zupic, I., Čater, T. (2015). Bibliometric methods in management and organization. Organizational Research Methods, 18(3): 429-472. https://doi.org/10.1177/1094428114562629
[22] Van Eck, N., Waltman, L. (2010). Software survey: VOSviewer, a computer program for bibliometric mapping. Scientometrics, 84(2): 523-538. https://doi.org/10.1007/s11192-009-0146-3
[23] Aria, M., Cuccurullo, C. (2017). Bibliometrix: An R-tool for comprehensive science mapping analysis. Journal of Informetrics, 11(4): 959-975. https://doi.org/10.1016/j.joi.2017.08.007
[24] Organisation for Economic Co-operation and Development (OECD). (2008). Handbook on constructing composite indicators: methodology and user guide. Paris: OECD Publications.
[25] Derviş, H. (2019). Bibliometric analysis using Bibliometrix, an R package. Journal of Scientometric Research, 8(3): 156-160. http://dx.doi.org/10.5530/jscires.8.3.32
[26] Clauset, A., Newman, M.E., Moore, C. (2004). Finding community structure in very large networks. Physical Review E, 70(6): 066111. https://doi.org/10.1103/PhysRevE.70.066111
[27] Basher, A., Jreisat, A., Kaur, J., Al-Mohamad, S., Rabbani, M.R. (2022). Looking into corporate boardrooms through the lens of gender diversity: A bibliometric review and META analysis. International Journal of Sustainable Development and Planning, 17(5): 1593-1603. https://doi.org/10.18280/ijsdp.170524