Yeli Sarvina*![]() | Tania June
| Tania June![]() | Surjono Hadi Sutjahjo
| Surjono Hadi Sutjahjo![]() | Rita Nurmalina
| Rita Nurmalina![]() | Elza Surmaini
| Elza Surmaini![]()
© 2023 IIETA. This article is published by IIETA and is licensed under the CC BY 4.0 license (http://creativecommons.org/licenses/by/4.0/).
OPEN ACCESS
This study aims to analyze the impact of climate change on the climate suitability of Robusta coffee in five main Indonesian coffee production centers namely Aceh, North Sumatera, South Sumatera, Bengkulu and Lampung using the Maxent approach. The study used climate data, and climate projections from Worldclim and coffee location data from maps of Indonesia's main agricultural commodities. The results showed that Maxent had good performance in modeling the climatic suitability of Robusta coffee at the provincial level, and the corresponding production areas shifted with different patterns between provinces. The areas with suitable and highly suitable climates for Robusta coffee were projected to decrease in all provinces except for Bengkulu. The findings suggest a future challenge for Robusta coffee sustainability in Indonesia. Aceh, North Sumatera, South Sumatera, and Lampung need to develop adaptation strategies to anticipate the increasingly unsuitable environment. On the other hand, Bengkulu can be considered a new area for coffee plantation. The projection of the suitability of the coffee climate is crucial in determining the future coffee development areas and for the rejuvenation of the existing coffee plantations, highlighting the significance of the study's findings for policymakers, farmers, and other stakeholders.
sustainability, coffee development, maximum entropy, adaptation, climatic suitability
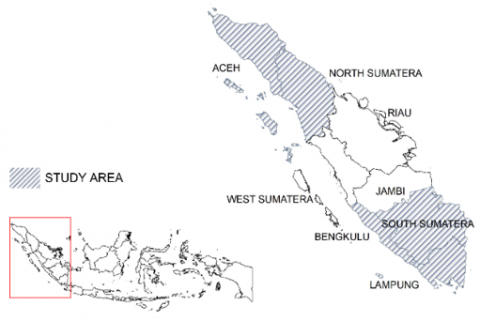
Coffee is an important crop in Indonesia, with the country being the world's fourth-largest exporter of coffee after Brazil, Vietnam, and Colombia. Coffee farming is the primary source of income for 1.7 million farmers in Indonesia, with most of them being Robusta coffee farmers (75%). Most of Indonesia's coffee plantations are located on the island of Sumatra, spread across five provinces, namely Aceh, North Sumatra, South Sumatra, Lampung, and Bengkulu. These provinces contribute around 70% of Indonesia's national coffee production [1].
However, climate change has been causing variations in air temperature and changes in rainfall patterns and intensity in Indonesia [2-5]. These changes have been associated with an increase in extreme climate events such as El-Niño and La-Niña [6, 7], which can disrupt coffee production, affecting the economic livelihoods of coffee farmers in Indonesia [8-10].
Coffee is a crop that is highly sensitive to climatic factors [11-14], and given that much of Indonesia's coffee is grown on marginal land, the impact of climate variability is becoming more noticeable in the country's coffee production [15]. Marginal land is known to be vulnerable to changes in abiotic environments such as climate [16].
The increase in air temperature, changes in rainfall patterns, and intensity cause variations in the climate suitability of crops, cropping areas, and cropping intensity [17]. This change causes a shift in areas suitable for coffee plantations. Coffee is a perennial plant with long life, so long-term planning is needed to sustain its production system. Therefore, the projection of the impact of climate change on the suitability of the coffee climate becomes crucial in the development of coffee in the future. Analysis of the suitability of climate and cropland is an essential key to the sustainability of agricultural production and development, and efficient management of agricultural land [18].
As such, it is crucial to project the impact of climate change on the suitability of the coffee climate in Indonesia, particularly considering the shifting areas suitable for coffee plantations. Several studies have been carried out on the climate suitability of coffee plants in other coffee-producing countries, including Nicaragua, Mexico, Ethiopia, Nepal and Global [19-25]. However, these studies have been more focused on Arabica coffee, with limited research on Robusta commodities [26], which account for almost 70% of coffee production in Indonesia [1].
To address this gap, this study aims to analyze the impact of climate change on the suitability of Robusta coffee in Indonesia using a species distribution model with the Maximum Entropy (MaxEnt) approach. This approach offers an alternative method of analyzing land and climatic suitability for agricultural commodities, which is less complicated and more accessible to regional agricultural offices with limited resources. Moreover, the MaxEnt approach has been widely used in species distribution modeling and is known to perform well even with limited data [27-29].
All prior MaxEnt-based species distribution modeling research utilized accurate species occurrence coordinates. In this study we try to use a new approach to get occurrence data from distribution map of the primary agricultural commodities produced from satellite image. Then we select the area base on land evaluation for agriculture commodities.
The results of this study are expected to provide valuable information for the planning and development of coffee centers in Indonesia in the face of climate change. By analyzing the projected impacts of climate change on the suitability of the coffee climate, this study could contribute to the sustainability of agricultural production and development, as well as the efficient management of agricultural land.
2.1 Location
The suitability of the coffee climate in this study was analyzed in five coffee center provinces, namely Aceh, North Sumatra, South Sumatra, Bengkulu, and Lampung (Figure 1). The data used in this study are coffee plantation location data (occurrence data) and environmental data (environmental modeling data), including climate data and land characteristics.
2.2 Data
The distribution map of coffee was obtained from the distribution map of the primary agricultural commodities produced by the study [30]. The climate data is bioclimatic data downloaded from worldclim version 2.1 with a resolution of 30 arc-seconds (1 km2) [31]. The types and sources of data used in this study are presented in Table 1.
There are 19 bioclimatic variables available in Worldclim (Table 2), but only 11 variables were used in this study (variables in bold). The selection of these 11 variables was based on research by the study [32], reporting that only 11 of these variables affected bioclimatic data in the tropics. Other environmental data used were altitude data and the slope of the land.
Coffee climate suitability projections for the 2050 period were analyzed using general circulation model (GCM) data. GCM is a numerical model representing physical processes in the atmosphere, ocean, cryosphere, and land. The GCM used was CNRM-CM5-2. Based on the results of research by the study [33], the CNRM-CM5-2 model has the best performance for climatological research in Southeast Asia. The scenarios used in this research are Representative Concentration Pathways (RCP) 2.6 and 8.5 scenarios. Scenario 2.6 is optimistic and is an aggressive mitigation strategy, while RCP 8.5 is a pessimistic scenario.
The suitability of the coffee climate was analyzed using the Maximum Entropy model with MaxEnt software version 3.4.1 [34] and downloaded from https://biodiversityinformatics.amnh.org/open_source/maxent/. QGIS software was used for data preparation and analysis and display of the output of the MaxEnt model.
Figure 1. Study area
Table 1. Types and sources of data
|
No |
Type of data |
Source of data |
|
1 |
Coffee distribution map |
(Condro et al. 2020) |
|
2 |
Climate data (precipitation, temperature, and relative humidity |
Worldclim |
|
3 |
Bioclimate data |
Worldclim |
|
4 |
Slope and elevation / Digital Elevation Model SRTM |
Usgs (https://earthexplorer.usgs.gov) |
|
5 |
Climate projection CNRM-CM5-2 |
Worldclim |
Table 2. Worldclim bio-climatic (Variables in bold were used in this study)
|
No |
Variable bioclimate |
Symbol |
Unit |
|
1 |
The Average Annual Temperature |
BIO1 |
Degrees Celsius |
|
2 |
Diurnal Temperature |
BIO2 |
Degrees Celsius |
|
3 |
Isothermally (BIO2/BIO7) (×100) |
BIO3 |
Dimensionless |
|
4 |
Temperature Seasonality (standard deviation ×100) |
BIO4 |
Degrees Celsius |
|
5 |
Max Temperature of Warmest Month |
BIO5 |
Degrees Celsius |
|
6 |
Min Temperature of Coldest Month |
BIO6 |
Degrees Celsius |
|
7 |
Temperature Annual Range (BIO5-BIO6) |
BIO7 |
Degrees Celsius |
|
8 |
Mean Temperature of Wettest Quarter |
BIO8 |
Degrees Celsius |
|
9 |
Mean Temperature of Driest Quarter |
BIO9 |
Degrees Celsius |
|
10 |
Mean Temperature of Warmest Quarter |
BIO10 |
Degrees Celsius |
|
11 |
Mean Temperature of Coldest Quarter |
BIO11 |
Degrees Celsius |
|
12 |
Annual Precipitation |
BIO12 |
millimeters |
|
13 |
Precipitation of Wettest Month |
BIO13 |
millimeters |
|
14 |
Precipitation of Driest Month |
BIO14 |
Millimeters |
|
15 |
Precipitation Seasonality (Coefficient of Variation) |
BIO15 |
Fraction |
|
16 |
Precipitation of Wettest Quarter |
BIO16 |
Millimeters |
|
17 |
Precipitation of Driest Quarter |
BIO17 |
Millimeters |
|
18 |
Precipitation of Warmest Quarter |
BIO18 |
Millimeters |
|
19 |
Precipitation of Coldest Quarter |
BIO19 |
Millimeters |
2.3 Data analysis
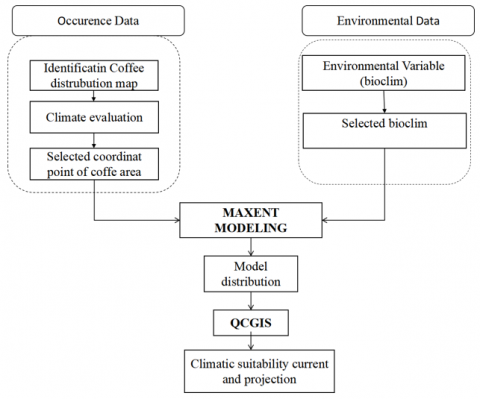
The stages of the research are presented in Figure 2. The study begins by identifying the coffee plantation area from the Indonesian agricultural commodities distribution map. The coffee plantation area is converted into a form of latitude and longitude coordinates. Not all point data are used as input in the MaxEnt model. The point data used are point data whose climate characteristics follow the optimal climate prerequisites for coffee plants. Considering the existing coffee area data, the suitability has not been analyzed. The data points were analyzed for climate suitability using criteria according to the technical guidelines for land evaluation for agricultural commodities [35].
Figure 2. Stages of the research
The criteria used are presented in Table 3, and the review's determination is calculated using an assessment (Table 4). The coffee point is highly suitable (S1) when it has a value of less than 12. It will have a suitability value of suitable (S2) when it has a value of 16 <S2 <18. The Moderately Suitable class (S3) values are in the range of 18 and 23, and unsuitable (N) when it reaches the value of 24.
Table 3. Criteria for determining the suitability of the coffe point (source: [35])
|
|
Land suitability classifications |
|||
|
Land and climate characteristics |
S1 (Highly Suitable) |
S2 (moderately suitable) |
S3(marginally suitable) |
N (not suitable) |
|
Precipitation (mm) |
1500-2000 |
2000-2500 |
2000-3000 |
<1000, > 3000 |
|
Temperature |
22-25 |
25-28 |
19-22, 28-32 |
<19, >32 |
|
Relative Humidity |
45-80 |
80-90, 35-45 |
>90, 30-35 |
<30 |
|
Dry Month (100 mm/month) |
1-3 |
3-4 |
4-5 or 1-2 |
>5, <1 |
|
Elevation |
300-500 |
500-600, 100-300 |
600-700, 0-100 |
>45 |
|
Slope (%) |
<8 |
8-25 |
25 -45 |
>45 |
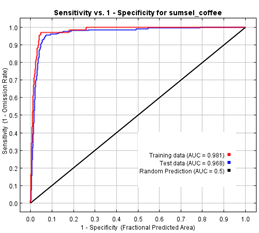
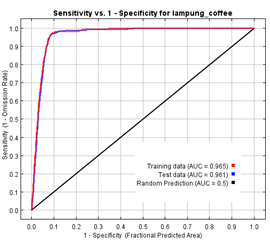
The selected point data was randomized, where 75% was used as a training model and 25% for testing and evaluating the performance of the MaxEnt model using the Receiver Operating Characteristic (ROC) method, which is included in the output of Maxent. The ROC works by comparing sensitivity and specificity. Sensitivity shows how well the model predicts attendance, while specificity shows how well the model predicts absenteeism. The evaluation results are described in the Area Under Curve (AUC) value. The AUC value is used to assess the model's performance. The AUC value is 0.6-0.7 the low performance, 0.71-0.8 in moderate performance, 0.81-0.9 in a good performance, and above 0.91 in high performance. The closer the value to 1, the better MaxEnt's performance in estimating climate suitability opportunities based on information on coffee area points.
Table 4. Determination of the value of the climate suitability of the coffee point
|
Suitability classification |
||||
|
Variable |
S1 |
S2 |
S3 |
N |
|
Precipitation |
1 |
2 |
3 |
4 |
|
Temperature |
1 |
2 |
3 |
4 |
|
Relative Humidity |
1 |
2 |
3 |
4 |
|
Dry month |
1 |
2 |
3 |
4 |
|
Elevation |
1 |
2 |
3 |
4 |
|
slope |
1 |
2 |
3 |
4 |
|
Score |
6 |
12 |
18 |
24 |
The contribution of environmental variables to building a climate suitability model through the Jackknife test on Maxent programming. MaxEnt will generate a probability estimate of climate suitability that varies from 0 (low) to 1 (very high). MaxEnt's output is data in ASCI (.asc) format. This data is processed and converted into a raster in ArcGIS to produce extensive information on the suitability of coffee climates and other information. The area based on the coffee climate suitability class was analyzed using current and projected climatic suitability data for 2050 (projection climatic suitability). Changes in coffee climate suitability are carried out by comparing the current and projected suitability areas.
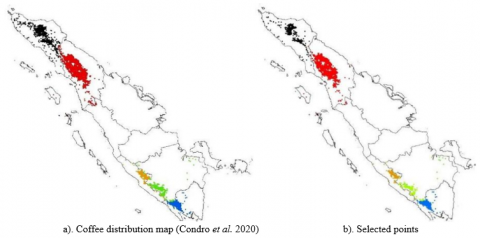
3.1 Identification of the coffee region
The points of the coffee area used in this study are presented in Figure 3. The number of points and the percentage of correspondence points for coffee plantations in the study area are presented in Table 5. There are 1347 coordinate points for coffee plantations in Aceh Province, 3190 points in North Sumatra, 430 points in South Sumatra, 985 points in Lampung, and 390 points in Bengkulu. North Sumatra and Aceh have the most point.
The analysis of the suitability of the coffee point shows the current climatic suitability coffee in Indonesia's main coffee centres. In general, the level of suitability in each province is moderately suitable (S2). The province with the highest highly suitable (S1) climate suitability class is North Sumatra with 34.51%, while other provinces have highly suitable highly suitable (S1) climate suitability below 20%. The province with the lowest level of S1 compliance is Aceh, with only 12.25%.
This study's results align with the report by [15], who reported that the majority of coffee production in Indonesia is cultivated in dry acid marginal land irrespective of the suitability of the climate zone.
The areas included in category S1 have few limiting factor that can affect productivity, and therefore suitable for sustain use. On the other hand S2 and S3 category have more limiting factors that can impact productivity. The results also imply that agricultural activities in S2 and S3 class of suitability areas require careful planning to maintain high productivity. Data from the Directorate General of Estate Crop (2020) reveals that North Sumatra Province has the highest smallholder farmer coffee productivity at 1.16 tons/ha, while South Sumatra, Lampung, Bengkulu, and Aceh have lower productivity ranging from 0,78 - 0.94 tons/ha [1].
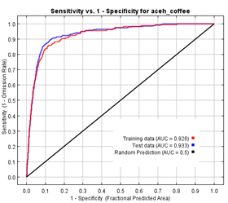
3.2 Model performance evaluation and contribution of environmental variables
Figure 4 displays the AUC values of this study, which are 0.926, 0.909, 0.981, 0.973, and 0.985, for Aceh, North Sumatra, South Sumatra, Bengkulu, and Lampung, respectively. All the AUC values obtained in this study were greater than 0.9, indicating the model's projection is highly reliable. According to the study [36], The AUC value close to 1 represented perfect prediction while AUC value of 0.5 or below indicated a bad performance. Furthermore, researchers [37] stated that the AUC value ranging 0.9 -1.0 categorized as excelent. According this AUC values, MaxEnt scientifically accepted to model climatic suitability of Robusta Coffee in the study area. Furthermore, this method could be an alternative method of analyzing land and climatic suitability for coffee in provincial level.
The outcome of this study is in agreement with previous research that has indicated MaxEnt's ability to accurately capture the climate suitability of coffee. Several studies have demonstrated the effectiveness of MaxEnt in capturing the climatic suitability of coffee, including [19, 38, 39]. These studies found that MaxEnt performed well in identifying the areas with the most suitable climate for coffee cultivation. Therefore, the current result aligns with the existing literature, suggesting that MaxEnt is a reliable approach for estimating the climate suitability of coffee.
The Jackknife test on the MaxEnt software was utilized to determine the contribution of environmental variables to the development of a model for coffee climate suitability. Table 6 presents the results of the Jackknife test, indicating the environmental variables that significantly influenced the climate suitability model in each province. Specifically, in Aceh, the model was most affected by the diurnal temperature and temperature of dries quarter, whereas in North Sumatra, temperature of dries quarter and d annua temperature were crucial. In South Sumatra, the average annual temperature and diurnal temperature were the most influential variables, whereas the temperature in the driest quarter and diurnal temperature were the most significant in Lampung. Finally, in Bengkulu, the temperature in the driest quarter and diurnal temperature were the environmental variables that had the greatest impact on the model's development.
Table 5. Suitability class of coffee plantation points
|
Province |
Suitability classification |
|
Total |
||||
|
S1 |
S2 |
S3 |
N |
Total |
|||
|
|
Number of Point |
165 |
448 |
381 |
353 |
1347 |
613 |
|
Aceh |
Percentage |
12.25 |
33.26 |
28.29 |
26.21 |
100 |
45.5 |
|
North Sumatera
|
Number of Point |
1101 |
1371 |
472 |
246 |
3190 |
2472 |
|
Percentage |
34.51 |
42.98 |
14.80 |
7.711 |
100 |
77.5 |
|
|
South Sumatera
|
Number of Point |
77 |
195 |
105 |
53 |
430 |
272 |
|
Percentage |
17.91 |
45.35 |
24.41 |
12.33 |
100 |
63.3 |
|
|
|
Number of Point |
134 |
500 |
272 |
79 |
985 |
634. |
|
Lampung |
Percentage |
13.60 |
50.76 |
27.61 |
8.02 |
100 |
64.4 |
|
|
Number of Point |
71 |
200 |
82 |
37 |
390 |
271. |
|
Bengkulu |
Percentage |
18.21 |
51.28 |
21.03 |
9.48 |
100 |
69.5 |
Figure 3. Coffee points in the research area
The result find that temperature is key variable in the model climatic suitability model for Robusta coffee. Bioclimatic variable derived from temperature in Indonesia is projected to increase [40]. Furhermore, researchers [41] reported an increasing extreme temperature both intensity and frequency. Distribution and quality of coffee have been linked with altitude and its association to temperature [42]. As temperatures rise, the climatically acceptable zones for farming coffee will migrate upward.
The findigd in line with recent studies that have reached conclusions about coffee's vulnerability to increasing temperatures. Some suggest the widespread loss, in excess of 50%, of suitable growing areas [43, 44]. The often cited optimal mean annual temperature range of Robusta is estimated to be between 22 and 26 or 22 and 30℃ [45-47]. Our study also higlight that rainfall influence climate sustainability of Robusta Coffee. Rainfall had a notable negative effect on yields in the flowering season [43]. Excessive rain and cool conditions during the quiescent growth phase can repress flowering and this has been linked to lower yields [45].
Figure 4. ROC curve climate suitability model
Table 6. Percentage variable contribution
|
No |
Aceh |
Nort Sumatera |
South Sumatera |
Bengkulu |
Lampung |
|
1 |
Diurnal Temp(45.7) |
Temp of Driest Quarter (69.8) |
Annual Temp (74.5) |
Temp of Driest Quarter(36.8) |
Temp of Driest Quarter (83.1) |
|
2 |
Temp of Driest Quarter (36.7) |
Annual Tempe (24.4) |
Diurnal Temp (19) |
Diurnal Temp (32.5) |
Diurnal Temp (6.4) |
|
3 |
Temp Seasonality (4.7) |
Temp of Wettest Quarter (2.1) |
Tempe of Wettest Quarter (2.4) |
Annual Prec (14.9) |
PrecSeasonality (4.6) |
|
4 |
Prec Seasonality (4.7) |
Prec of Driest Quarter (1.8) |
Prec of Driest Month (1.6) |
PrecSeasonality (9.9) |
Annual Temp (2.8) |
|
5 |
Annual Prec (3.9) |
Temp Seasonality (0.5) |
Temp of Driest Quarter (1) |
Prec of Wettest Month (3.3) |
Annual Precipitation (1.3) |
3.3 Robusta coffee climatic suitability modeling
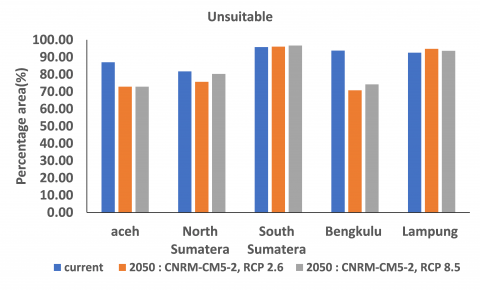
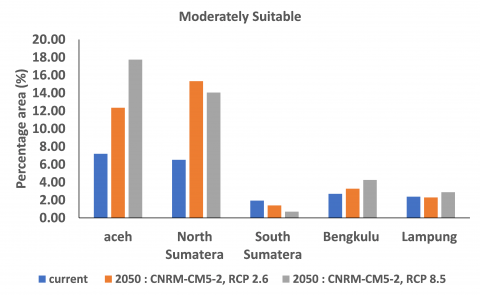
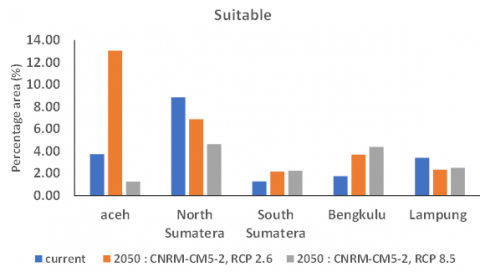
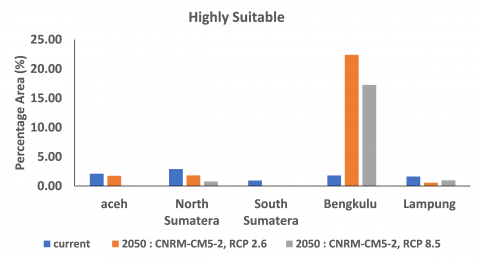
In general, the area with highly suitable decreases in both scenarios. In the scenario of an aggressive mitigation strategy, namely RCP 2.6, climate suitability is reduced. The most significant reduction occurred in the business-as-usual scenario (RCP 8.5). The change area of suitability classes are shown in Figure 5. South Sumatra Province in 2050 is even projected not to have a suitability area with a highly suitable class. The different results of the analysis are shown by the results of the analysis in Bengkulu Province, where the area of climatic suitability with highly suitable class is projected to increase significantly.
Figure 5. The percentage area of climatic suitability
The province of Aceh currently has an area with a highly suitable class is 2.1%, in 2050 the area is projected to decrease to 1.75% (scenario RCP 2.6). While in the projection RCP 8.5, the Aceh region is projected not to have a highly suitable area. Moreover the moderately suitable class is projected to expand. Currently the area with moderately suitable is approximately 7.19 %, while in 2050 it is projected to expand 2.6% (scenario RCP 2.6) and 8.5% 17.5% (RCP 8.5)
The same pattern is shown through the analysis of the climate suitability of Robusta coffee for the province of North Sumatra. Areas with highly suitable classes are projected to decrease with a significant reduction in scenario RCP 8.5. Currently, the area with highly suitable class is 2.9%. In 2050 in scenario RCP 2.6, it will decrease to 1.8%, and in scenario RCP 8.5 only 0.79%. The suitability class that is projected to increase is the region with the moderately suitable class. Area with a highly suitable class for the Province of South Sumatra are also projected to decrease, where currently the highly suitable area is 0.94% and by 2050, areas with highly suitable classes are projected to disappear. In contrast to North Sumatra Province, South Sumatra Province's suitability classes projected to increase are suitable and unsuitable classes.
Lampung Province is also projected to experience a reduction in the area with a highly suitability class, where currently, this highly class occupies approximately 1.63% of the area. In 2050, this area is projected to decrease to 0.56% in scenario RCP 2.6 and 0.98% in scenario RCP 8.5. In the province of Lampung, the suitability class of suitable and moderately suitable are also projected to decrease. The only class that is projected to increase is the unsuitable class.
The projection of the climatic suitability class Robusta coffee for Bengkulu Province shows a different pattern from other provinces. The results of MaxEnt's analysis show that in this province, the area with a highly suitable and moderately suitable area is projected to increase. The area that is projected to decrease is only the area with the unsuitability class.
|
Aceh |
||
|
North Sumatera |
||
|
South Sumatera |
||
|
Lampung |
||
|
Bengkulu |
||
|
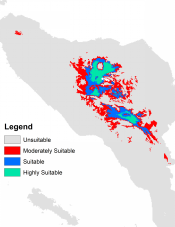
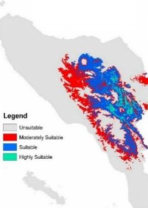
a) Current |
b) 2050 : CNRM-CM5-2, RCP 2.6 |
c) 2050 : CNRM-CM5-2, RCP 8.5 |
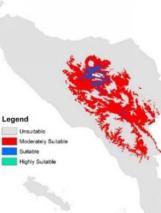
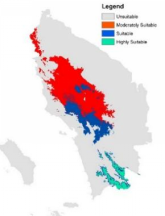
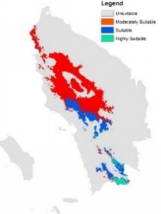
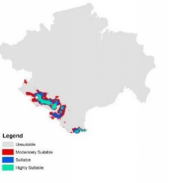
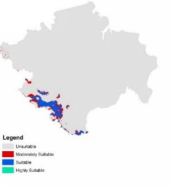
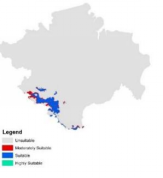
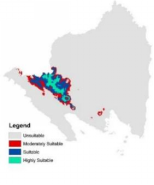
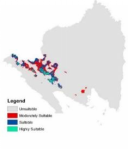
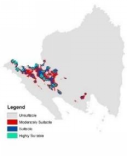
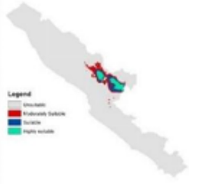
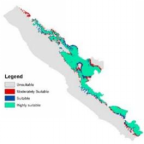
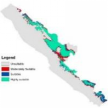
Figure 6. Current and projected Robusta coffee climate suitability a) Current, b) Projected 2050 RCP 2.6, and c) Projected 250 RCP 8.5
The class with a significant increase is the highly suitable class where the area currently has 1.81%, in 2050. It is projected to increase to 22.4% in the RCP 2.6 scenario and 17.26% in the RCP 8.5 scenario.
The current suitability map for Robusta coffee and its projections is presented in Figure 6. Spatially, it is generally seen that the climatic suitability of the Robusta coffee for 2050 is decreasing with a shift. However, Bengkulu Province shows different results where the projected future climate suitability of Robusta coffee is projected to increase. The projected suitability in 2050 for both scenarios in Aceh and North Sumatra Provinces shifts to the south, Lampung Province shifts to the west, and Bengkulu Province expands to the north, south, and west.
Most current Robusta coffee areas will be severely affected by climate change, especially in Aceh, North Sumatra, South Sumatera, and Lampung. The highly suitable suitability class is projected to decrease in all provinces except in Bengkulu Province. Even then, South Sumatera may cease to grow Robusta coffee in the upcoming decades since the highly suitable coffee area is projected to disappear. The result this study are in line with previous study that highly suitable coffee area is projected to decrease i.e. Nicaragua dan Meksiko [20], Ethiopia [21], Nepal [48] and global [24, 25].
In moderately suitable and unsuitable areas, coffee still can be grown but the climate would be significantly different from highly suitable areas. It predicts having an impact on coffee quality and productivity since the sensitivity of coffee quality to temperature, a rise in global may result in a drop in quality, while a decrease in rainfall may lead to lower yields. For sustainable production, adaptation strategy can include site-specific management options [25], plant breeding research for varieties that are better adapted to higher temperature [23], and water management [49].
By 2050, Bengkulu would become more climatically favorable for Robusta coffee due to rising temperatures, making it one of the most climatically suitable sites for such expansion of coffee production. Areas with an altitude above 800 meters sea level, which have been classified as unsuitable for Robusta coffee due to the increase in earth's surface temperature due to climate change, become suitable areas for Robusta coffee [19]. However, research is still needed to identify whether this area is a conservation area or a protected forest.
The analysis of climatic suitability of Robusta coffee using the maximum entropy model in the five study provinces showed very good performance, indicated by the AUC values exceed 0.9. Based on this performance, the MaxEnt approach scientifically accepted for analyzing the impact of climate change on the climatic suitability of Robusta coffee. Climate change impacts on the climatic suitability of Robusta coffee. In 2050, the Provinces of Aceh, North Sumatra, South Sumatra, and Lampung had decrement in areas with highly suitable and suitable classes. On the contrary, different results are obtained for Bengkulu province, where in 2050, highly suitable areas will expand. Information on the suitability of the coffee climate is crucial for the future sustainability of the coffee production system. The projection of the climatic suitability of the coffee is critical to determining new coffee development areas and the rejuvenation of the existing coffee plantations. Areas with decreasing climatic suitability classes for future sustainability are necessary to conduct research on adaptation technologies to anticipate the increasingly unsuitable environment.
This work was supported by Indonesian Agriculture Research and Development and IPB University.
[1] Direktorat Perkebunan (Directorate General of Estate crop). (2020). Statistik Perkebunan Indonesia (Tree crop estate statistics of Indonesia), Directorate General of Estate crop. Jakarta.
[2] Runtunuwu, E., Kondoh, A. (2008). Assessing global climate variability under coldest and warmest periods at different latitudinal regions. Indonesian Journal of Agricultural Science, 9(1): 7. https://doi.org/10.21082/ijas.v9n1.2008.p7-18
[3] Runtunuwu, E., Syahbuddin, H. (2012). Rainfall pattern change and its impact on length of growing period. Indonesian Soil and Climate Journal, (26): 134662. https://dx.doi.org/10.2017/jti.v0n26.2007.%p
[4] Laimeheriwa, S. (2014). Analisis tren perubahan curah hujan pada tiga wilayah dengan pola hujan yang berbeda di Provinsi Maluku. Jurnal Budidaya Pertanian, 10(2): 71-78.
[5] Ruminta, Nurmala, T. (2016). Impacts of rainfall patterns changes on rainfed land cropping in West Java. Agrin, 20(2): 155-168.
[6] Aldrian, E. (2016). Sistem peringatan dini menghadapi iklim ekstrem. Jurnal Sumberdaya Lahan, 10(2): 79-90.
[7] Tangang, F., Juneng, L., Aldrian, E. (2017). Observed changes in extreme temperature and precipitation over Indonesia. International Journal of Climatology, 37(4): 1979-1997. https://doi.org/10.1002/joc.4829
[8] Yuliasmara, F. (2017). El Nino effect on coffee growth and productivity on several agroforestry systems in Gumitir Mountain Coffee Farms, East Java, Indonesia. Pelita Perkebunan (a Coffee and Cocoa Research Journal), 33(3): 168-179. https://doi.org/10.22302/iccri.jur.pelitaperkebunan.v33i3.291
[9] Syakir, M., Surmaini, E. (2017). Perubahan iklim dalam konteks sistem produksi dan pengembangan kopi di Indonesia. Jurnal Penelitian dan Pengembangan Pertanian, 36(2): 77-90. https://doi.org/10.21082/jp3.v36n2.2017.p77-90
[10] Sarvina, Y., June, T., Sutjahjo, S.H., Nurmalina, R., Surmaini, E. (2021). The impacts of climate variability on coffee yield in five indonesian coffee production centers. Coffee Science, 16. https://doi.org/10.25186/.v16i.1917
[11] Choi, H.S., Schneider, U.A., Rasche, L., Cui, J., Schmid, E., Held, H. (2015). Potential effects of perfect seasonal climate forecasting on agricultural markets, welfare and land use: A case study of Spain. Agricultural Systems, 133: 177-189. https://doi.org/10.1016/j.agsy.2014.10.007
[12] Craparo, A.C.W,. Van Asten ,P.J.A., Läderach, P., Jassogne, L.T.P., Grab, S.W. (2015). Coffea arabica yields decline in Tanzania due to climate change : Global implications. Agricultural and Forest Meteorology, 207: 1-10. https://doi.org/10.1016/j.agrformet.2015.03.005
[13] Bacon, C.M., Sundstrom, W.A., Stewart, I.T., Beezer, D. (2017). Vulnerability to cumulative hazards: Coping with the coffee leaf rust outbreak, drought, and food insecurity in Nicaragua. World Development, 93: 136-152. https://doi.org/10.1016/j.worlddev.2016.12.025
[14] Tavares, P.D.S., Giarolla, A., Chou, S.C., Silva, A.J.D.P., Lyra, A.D.A. (2018). Climate change impact on the potential yield of Arabica coffee in southeast Brazil. Regional Environmental Change, 18: 873-883. https://doi.org/10.1007/s10113-017-1236-z
[15] Hafif, B., Prastowo, B., Prawiradiputra, B.R. (2013). Coffee plantation development based on innovation in acid dry land area. Pengembangan Inovasi Pertanian, 6(1): 199-206.
[16] Gunathilaka, R.P.D., Smart, J.C., Fleming, C.M. (2018). Adaptation to climate change in perennial cropping systems: Options, barriers and policy implications. Environmental Science & Policy, 82: 108-116. https://doi.org/10.1016/j.envsci.2018.01.011
[17] Iizumi, T., Ramankutty, N. (2015). How do weather and climate influence cropping area and intensity?. Global Food Security, 4: 46-50. https://doi.org/10.1016/j.gfs.2014.11.003
[18] Akpoti, K., Kabo-bah, A.T., Zwart, S.J. (2019). Agricultural land suitability analysis: State-of-the-art and outlooks for integration of climate change analysis. Agricultural Systems, 173: 172-208. https://doi.org/10.1016/j.agsy.2019.02.013
[19] Schroth, G., Läderach, P., Blackburn Cuero, D.S., Neilson, J., Bunn, C. (2015). Winner or loser of climate change? A modeling study of current and future climatic suitability of Arabica coffee in Indonesia. Regional Environmental Change, 15: 1473-1482. https://doi.org/10.1007/s10113-014-0713-x
[20] Läderach, P., Ramirez–Villegas, J., Navarro-Racines, C., Zelaya, C., Martinez–Valle, A., Jarvis, A. (2017). Climate change adaptation of coffee production in space and time. Climatic Change, 141(1): 47-62. https://doi.org/10.1007/s10584-016-1788-9
[21] Davis, A.P., Gole, T.W., Baena, S., Moat, J. (2012). The impact of climate change on indigenous arabica coffee (Coffea arabica): predicting future trends and identifying priorities. PloS One, 7(11): e47981. https://doi.org/10.1371/journal.pone.0047981
[22] Ranjitkar, S., Sujakhu, N.M., Merz, J., Kindt, R., Xu, J., Matin, M.A., Ali, M., Zomer, R.J. (2016). Suitability analysis and projected climate change impact on banana and coffee production zones in Nepal. PloS One, 11(9): e0163916. https://doi.org/10.1371/journal.pone.0163916
[23] Bunn, C., Läderach, P., Ovalle Rivera, O., Kirschke, D. (2015). A bitter cup: climate change profile of global production of Arabica and Robusta coffee. Climatic Change, 129(1): 89-101. https://doi.org/10.1007/s10584-014-1306-x
[24] Ovalle-Rivera, O., Läderach, P., Bunn, C., Obersteiner, M., Schroth, G. (2015). Projected shifts in Coffea arabica suitability among major global producing regions due to climate change. PloS One, 10(4): e0124155. https://doi.org/10.1371/journal.pone.0124155
[25] Grüter, R., Trachsel, T., Laube, P., Jaisli, I. (2022). Expected global suitability of coffee, cashew and avocado due to climate change. PloS One, 17(1): e0261976. https://doi.org/10.1371/journal.pone.0261976
[26] Pham, Y., Reardon-Smith, K., Mushtaq, S., Cockfield, G. (2019). The impact of climate change and variability on coffee production: A systematic review. Climatic Change, 156: 609-630. https://doi.org/10.1007/s10584-019-02538-y
[27] Phillips, S.J., Anderson, R.P., Schapire, R.E. (2006). Maximum entropy modeling of species geographic distributions. Ecological Modelling, 190(3-4): 231-259. https://doi.org/10.1016/j.ecolmodel.2005.03.026
[28] Elith, J., Graham, C.H., Anderson, R.H., et al. (2006). Novel methods improve prediction of species’ distributions from occurrence data. Ecography, 29(2): 129-151. https://doi.org/10.1111/j.2006.0906-7590.04596.x
[29] Garcia, K., Lasco, R., Ines, A., Lyon, B., Pulhin, F. (2013). Predicting geographic distribution and habitat suitability due to climate change of selected threatened forest tree species in the Philippines. Applied Geography, 44: 12-22. https://doi.org/10.1016/j.apgeog.2013.07.005
[30] Condro, A.A., Setiawan, Y., Prasetyo, L.B., Pramulya, R., Siahaan, L. (2020). Retrieving the national main commodity maps in indonesia based on high-resolution remotely sensed data using cloud computing platform. Land, 9(10): 377. https://doi.org/10.3390/land9100377
[31] Fick, S.E., Hijmans, R.J. (2017). WorldClim 2: New 1-km spatial resolution climate surfaces for global land areas. International Journal of Climatology, 37(12): 4302-4315. https://doi.org/10.1002/joc.5086
[32] Purba, P., Sukartiko, A.C., Ainuri, M. (2019). Modeling the plantation area of geographical indication product under climate change: Gayo Arabica coffee (Coffea arabica). In IOP Conference Series: Earth and Environmental Science, 365(1): 012021. https://doi.org/10.1088/1755-1315/365/1/012021
[33] Kamworapan, S., Surussavadee, C. (2019). Evaluation of CMIP5 global climate models for simulating climatological temperature and precipitation for Southeast Asia. Advances in Meteorology, 2019: 1-18. https://doi.org/10.1155/2019/1067365
[34] Phillips, S.J., Dudík, M., Schapire, R.E. (2004). A maximum entropy approach to species distribution modeling. In Proceedings of the Twenty-First International Conference on Machine Learning, p. 83. https://doi.org/10.1145/1015330.1015412
[35] Djaenudin, D., Hidayat, A., Suhardjo, H., Hikmatullah. (2011). Petunjuk teknis evaluasi lahan untuk komoditas pertanian.
[36] Wang, Y., Chao, B., Dong, P., Zhang, D., Yu, W., Hu, W., Ma, Z., Chen, G., Liu, Z., Chen, B. (2021). Simulating spatial change of mangrove habitat under the impact of coastal land use: Coupling MaxEnt and Dyna-CLUE models. Science of The Total Environment, 788: 147914. https://doi.org/10.1016/j.scitotenv.2021.147914
[37] Li, Q., Ren, H., Zheng, L., Cao, W., Zhang, A., Zhuang, D., Lu, L., Jiang, H. (2017). Ecological niche modeling identifies fine-scale areas at high risk of dengue fever in the Pearl River Delta, China. International Journal of Environmental Research and Public Health, 14(6): 619. https://doi.org/10.3390/ijerph14060619
[38] Zhang, S., Liu, B., Liu, X., Yuan, Q., Xiao, X., Zhou, T. (2022). Maximum entropy modeling for the prediction of potential plantation distribution of Arabica coffee under the CMIP6 mode in Yunnan, Southwest China. Atmosphere, 13(11): 1773. https://doi.org/10.3390/atmos13111773
[39] Zhang, S., Liu, X., Li, R., Wang, X., Cheng, J., Yang, Q., Kong, H. (2021). AHP-GIS and MaxEnt for delineation of potential distribution of Arabica coffee plantation under future climate in Yunnan, China. Ecological Indicators, 132: 108339. https://doi.org/10.1016/j.ecolind.2021.108339
[40] Hamed, M.M., Nashwan, M.S., Shahid, S., bin Ismail, T., Wang, X.J., Dewan, A., Asaduzzaman, M. (2022). Inconsistency in historical simulations and future projections of temperature and rainfall: A comparison of CMIP5 and CMIP6 models over Southeast Asia. Atmospheric Research, 265: 105927. https://doi.org/10.1016/j.atmosres.2021.105927
[41] Putra, I.D.G.A., Rosid, M.S., Sopaheluwakan, A., Sianturi, Y.C.U. (2020). The CMIP5 projection of extreme climate indices in Indonesia using simple quantile mapping method. In AIP Conference Proceedings, 2223(1): 050008. https://doi.org/10.1063/5.0000849
[42] Tolessa, K., D'heer, J., Duchateau, L., Boeckx, P. (2017). Influence of growing altitude, shade and harvest period on quality and biochemical composition of Ethiopian specialty coffee. Journal of the Science of Food and Agriculture, 97(9): 2849-2857. https://doi.org/10.1002/jsfa.8114
[43] Kath, J., Byrareddy, V.M., Craparo, A., Nguyen-Huy, T., Mushtaq, S., Cao, L., Bossolasco, L. (2020). Not so robust: Robusta coffee production is highly sensitive to temperature. Global Change Biology, 26(6): 3677-3688. https://doi.org/10.1111/gcb.15097
[44] Moat, J., Williams, J., Baena, S., Wilkinson, T., Gole, T.W., Challa, Z.K., Demissew, S., Davis, A.P. (2017). Resilience potential of the Ethiopian coffee sector under climate change. Nature Plants, 3(7): 1-14. https://doi.org/10.1038/nplants.2017.81
[45] DaMatta, F.M., Avila, R.T., Cardoso, A.A., Martins, S.C., Ramalho, J.C. (2018). Physiological and agronomic performance of the coffee crop in the context of climate change and global warming: A review. Journal of Agricultural and Food Chemistry, 66(21): 5264-5274. https://doi.org/10.1021/acs.jafc.7b04537
[46] Jayakumar, M., Rajavel, M., Surendran, U. (2016). Climate-based statistical regression models for crop yield forecasting of coffee in humid tropical Kerala, India. International Journal of Biometeorology, 60: 1943-1952. https://doi.org/10.1007/s00484-016-1181-4
[47] Rodrigues, W.P., Martins, M.Q., Fortunato, A.S., et al. (2016). Long-term elevated air [CO2] strengthens photosynthetic functioning and mitigates the impact of supra-optimal temperatures in tropical Coffea arabica and C. canephora species. Global Change Biology, 22(1): 415-431. https://doi.org/10.1111/gcb.13088
[48] Ranjitkar, S., Sujakhu, N.M., Budhamagar, K.; Rimal, S., Xu, J., Merz, J., Zomer, R.J. (2015). Projected climate change impacts on climatic suitability and geographical distribution of banana and coffee plantations in Nepal. ICRAF Working Paper 204. In World Agroforestry Centre East and Central Asia, Kunming, China. http://dx.doi.org/10.5716/WP15294.PDF
[49] Amarasinghe, U.A., Hoanh, C.T., D'haeze, D., Hung, T.Q. (2015). Toward sustainable coffee production in Vietnam: More coffee with less water. Agricultural Systems, 136: 96-105. https://doi.org/10.1016/j.agsy.2015.02.008