Toriq A. Ghuzdewan | Arief Nugroho* | Henricus Priyosulistyo
© 2023 IIETA. This article is published by IIETA and is licensed under the CC BY 4.0 license (http://creativecommons.org/licenses/by/4.0/).
OPEN ACCESS
Poor performance of key stakeholders contributes to project problems such as delays, cost overruns, inferior quality, work accidents, etc. Many studies have evaluated the correlation between stakeholders and project success; however, no research has been conducted to evaluate the interrelationships among their performances, i.e how one stakeholder’s performance affects the other(s) and ultimately determines the project’s success. This study aims to fill this gap. A conceptual model was developed using the technique of Structural Equation Modeling (SEM) and then was tested upon empirical data from a field survey of 273 experienced practitioners on construction projects in Indonesia representing the owners (27%), the designers (15%), the supervisors (17%), and the contractors (41%). The results show that all key stakeholders have important roles in the project’s success, although their contributions vary. The owner has a positive effect on all other stakeholders’ performance, the designer only has a significant influence on the supervisor’s performance, the supervision consultant only has a significant effect on the contractor's performance and the contractor has the greatest direct influence on the success of the project. This finding enriches the literature on stakeholder management of construction projects, especially in developing countries which is currently still sparse.
relationship, key stakeholder, performance, Indonesian construction, project success, structural equation modeling
Indonesia is a developing country with a high necessity for infrastructure. In 2014, the country's construction market was the largest in Asia after China, Japan, and India [1]. It was estimated that the value of the Indonesian construction project would continue to increase in the future, particularly in the housing, transportation, and infrastructure sectors [2]. Despite its growth, construction projects in Indonesia, however, confront many problems such as delays, cost overruns, poor quality, work accidents, etc. There are indications that the poor performance of project stakeholders caused these problems [3-7].
Stakeholders play essential roles in project success [8-10]. Stakeholders are parties that can influence or be influenced in achieving project objectives, which can be individuals, groups, or organizations [10]. In construction projects, the key stakeholders consist of the owner, consultant, and contractor [11]. Consultants may consist of design consultants and supervision consultants [12].
Stakeholder theory has developed rapidly since the 1980s, originally intended for business management [9], then developed in project management areas. In the Project Management Body of Knowledge (PMBOK), it is stated that project management is basically stakeholder management [10]. A study found 2026 articles on stakeholders in project management literature from 1984 to 2009 where most of the research was on construction projects originating from the UK, Australia, America, and Canada [13]. Many studies also have evaluated stakeholder relationships and project success [14]. Das and Ngacho [15] found that owner, consultant, and contractor factors were positively related to project success. Marleno et al. [16] found that the owner, design consultant, contractors, and supervision consultant had essential roles in project success in Indonesian construction projects. Although there have been some studies analyzing the roles of stakeholders in project success, most of them evaluated the direct relationship between stakeholders and project success [15, 16], and no research had been conducted to evaluate the interaction between project stakeholders' performance, i.e. how the performance of one stakeholder influenced the other stakeholder(s)’ performances in achieving a successful project [17]. Scott-young and Samson [18] stated that there was little explanation on how interaction among stakeholders affected project success.
This study aims to fill this gap by evaluating the performance relationship among key stakeholders in achieving success in the execution of construction projects in Indonesia. Specifically focus on projects which are carried out using the conventional delivery system in which there are four key stakeholders, namely the owner, designer, supervision consultant, and contractor. The Structural Equation Modeling (SEM) technique is employed for this purpose by developing a conceptual model of the relationship among key stakeholder performances based on theory. Then the model was tested based on empirical data from a field survey. The survey was conducted among experienced practitioners on construction projects in Indonesia representing the owner, designer, consultant supervision, and contractor. The results of SEM analysis can show how the relationship of influence between key stakeholders to achieve project success. SEM analysis can also show the direct and indirect effect of stakeholder performance on project success. Understanding the relationship between the performance of key stakeholders as a project team in achieving success is expected to help better project management and encourage each stakeholder to improve their performance and reduce project problems.
Stakeholders are parties that can influence or be influenced in achieving project objectives, which can be individuals, groups, or organizations [10]. Stakeholders can be classified into key stakeholders and wider stakeholders [19]. Key stakeholders are parties in which project objectives cannot be achieved without their support. For construction projects, there are many stakeholders such as owner, contractor, consultant, materials suppliers, government, and community, but mostly only three of them are actively involved in monitoring and evaluating the project, they are owner, contractor, and consultant [11].
Project stakeholders have their respective roles and responsibilities [20]. The owner is the party who initiates and funds the project. The owner makes contracts with the consultants and the contractor, therefore the owner has the power and authority to supervise the performances of the contractor and consultant. The owner is also the project leader who should encourage all parties to work well in achieving project success. Owners can provide support or cause obstacles in project delivery [20]. The role of the owner includes specifying criteria, building requirements, material specifications, reviewing documents, determining project cost, giving approval, making payments, defining the completion date, etc. The owner has a vital role in the project's success [21].
Consultants can be divided into the design consultant and the supervision consultant [12]. The task of the design consultant is to make designs according to the owner's requirements. The designer's jobs include conducting surveys, providing structural analysis, designs, specifications, bills of quantity, cost estimates, quality plans, etc. [22]. While supervision consultant works for the owner to supervise, monitor, and inspect the contractor's work so that the contractor's work meets the technical and administrative requirements of the contract. While the contractor has the main task to work according to the contract. The contractor's duties include preparing the work plan, leading, executing, supervising, and inspecting the works. The contractor provides labor, materials, equipment, and technology as needed.
Many studies have shown the important roles of stakeholders in project success and evaluated their relationship. Ngacho and Das [23] using confirmatory factor analysis to evaluate the direct relationship between stakeholders and success found that the owner had a correlation value of 0.38 to project success; the consultant had a correlation value of 0.42, while the contractor had a correlation value of 0.41. Using a similar method, Marleno et al. [16] studied Indonesian construction projects and found that the contractor had the most significant influence on project success with a correlation value of 0.775, followed by the owner at 0.231, the design consultant at 0.189, and the supervision consultant at -0.307.
Stakeholders should cooperate as a project team, their involvement was essential for project success where they should be able to utilize the skills, strengths, and supports of all of the team’s members [20]. Project stakeholders should commit to one goal, i.e., project success [10]. The involvement of all stakeholders has positive impacts [24], such as a fast decision-making process and increased transparency, enabling smooth use of work plans, and facilitating better communication [20].
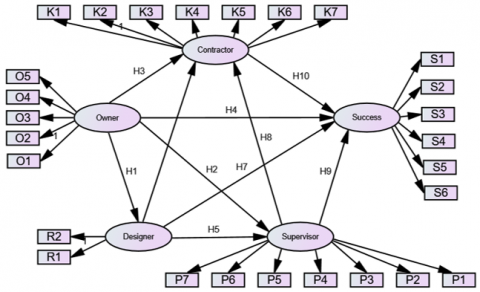
Based on the literature, stakeholders not only have a direct influence on project success [23] but also have indirect influence(s) through interaction and work together as a team in achieving project success [20]. The performance of one party can affect the performance of the other party which ultimately determines the success of the project. The owner is the party initiating the project and based on the contractual relationship has the authority to supervise and encourage the performance of consultants and contractors. The designer’s job is to make designs that are used by contractors for work guidelines. The designer is also obliged to assist the supervision consultant if there are problems related to the design. The supervisory consultant's main task is to oversee the contractor's performance. Meanwhile, contractors are parties who carry out physical activities directly so that their performance greatly affects the success of the project. Based on this theoretical framework, a conceptual model of the relationship between key stakeholders in the execution of construction projects in Indonesia is proposed as shown in Figure 1.
Figure 1. Conceptual model
Based on the conceptual model, hypotheses are developed as follows:
H1: Owner performance has a positive influence on designer performance
H2: Owner performance has a positive influence on supervisor performance
H3: Owner performance has a positive impact on contractor performance
H4: Owner performance has a positive impact on project success
H5: Designer performance has a positive impact on supervisor performance
H6: Designer performance has a positive impact on contractor performance
H7: Designer performance has a positive impact on project success
H8: Supervisor performance has a positive impact on contractor performance
H9: Supervisor performance has a positive impact on project success
H10: Contractor performance has a positive impact on project success
The performance indicators are identified from the literature that can be summarised as shown in Table 1 below.
Table 1. Variables and indicators
|
Variables |
Indicators |
Code |
|
Owner performance |
Adequacy of project duration |
O1 |
|
On-time payment |
O2 |
|
|
Owner approval time |
O3 |
|
|
Owner visits |
O4 |
|
|
Owner supervision |
O5 |
|
|
Design consultant performance |
Design consultant’s monitoring |
R1 |
|
Design consultant support |
R2 |
|
|
Supervisory consultant performance |
Evaluation of contractor's work plans |
P1 |
|
Supervision |
P2 |
|
|
Direction |
P3 |
|
|
Timely decision |
P4 |
|
|
Coordination |
P5 |
|
|
Administration |
P6 |
|
|
Present in the field |
P7 |
|
|
Contractor performance |
Working capital |
K1 |
|
Contractor work plan |
K2 |
|
|
Contractor resources |
K3 |
|
|
Technology & method |
K4 |
|
|
Contractor's QSHE programs |
K5 |
|
|
Monitoring & controlling systems |
K6 |
|
|
Coordination capabilities |
K7 |
|
|
Project success performance |
Project scope |
S1 |
|
Time |
S2 |
|
|
Budget |
S3 |
|
|
Quality |
S4 |
|
|
SHE |
S5 |
|
|
Owner satisfaction |
S6 |
Structural Equation Modeling (SEM) is a multivariate quantitative technique that can be used to describe the relationship among variables. SEM is a powerful statistical tool to test and evaluate causal relationships in a model. SEM can be used to evaluate the hypothesis of the relationship between variables developed from the literature review so that it can be utilized to validate theoretical models or as theory testing.
Figure 2 shows the SEM approach [25] adopted in this study. The first step is to create a theoretical model based on a literature review. Next, a survey instrument was developed for data collection. After obtaining the field data, model testing is then performed. Based on the results of the analysis carried out the interpretation of the model. This study uses AMOS (Analysis of Moment Structure) software to estimate the model based on the SEM equation.
Figure 3 shows the model developed based on the literature review. The indicators of variables, the variables, and the relationship between variables of stakeholder performance and project success can be seen from this theoretical model. There are five variables, namely owner performance, designer performance, supervisor performance, contractor performance, and project success performance. The indicators for each variable as shown in Table 1 consist of five indicators (O1-O5) for the owner performance, two indicators (R1, R2) for the design consultant performance, seven indicators (P1-P7) for the supervision consultant performance, seven indicators (K1-K7) for the contractor performance and six indicators (S1-S6) for the project success performance.
Figure 2. SEM approach [25]
Figure 3. Theoretical model
Based on the theoretical model, a survey instrument was developed. The Das and Ngacho [15] questionnaire was adopted as the basis for the development of this research survey instrument. Questions are structured so that respondents can give affirmative answers to performance indicators using 5 Likert scales. The survey instruments were reviewed first through interviews and a pilot survey was conducted before the questionnaires were widely distributed to larger respondents. The interviews aim to gain a better understanding of the indicators, variables, and the developed model. The interviews were conducted with eight respondents representing owners (2 people), designers (2 people), supervisors (2 people), and contractors (2 people). While the pilot survey was carried out by distributing questionnaires to 34 respondents to validate the questionnaire and it allows necessary improvements before it was distributed to a wider range of respondents. Finally, survey questionnaires were conducted to construction project practitioners in Indonesia who represented the owner, designer, supervision consultants, and contractors. The survey aims to obtain levels of agreement from the respondents on the indicators of stakeholder performance and project success. Appendix A shows the list of questions in the survey questionnaire. The surveys were conducted through networks of social media groups from professional associations and practitioner relatives.
5.1 Demographics data of respondents
Two hundred seventy-three respondents filled out the questionnaires from an online survey, with the composition of 27% owners, 15% designers, 17% supervision consultants, and 41% contractors. Most of the respondents had more than ten years of work experience (48%), followed by less than five years of experience (30%) and five to ten years of experience (22%). Most of the projects in this survey were building projects (48%), followed by road and bridge projects (24%), water construction projects (15%), and others (13%). The government projects were dominated by 73% compared to private projects by 27%. Most of the projects in the survey had a considerable contract value of more than 100 billion Rupiah (42%).
5.2 Assess the measures’ reliability and validity
Validity and reliability tests were conducted based on the questionnaires of the pilot survey to evaluate whether the questions had been valid and reliable before they were used in the final survey. A validity test was conducted based on Pearson Bivariate correlations using the SPSS program. A validity test was conducted on all questionnaires, whether related to owner performance, design consultant performance, supervisory consultant performance, contractor performance, and project success. The validity test obtained a valid result with an r-value greater than the r-table (0.184). Likewise, reliability tests attained in all questionnaires were reliable with questionnaire reliability values for owner performance was 0.824, design consultant performance was 0.809, supervisory consultant performance was 0.910, contractor performance was 0.918, and successful performance was 0.813.
5.3 Model validation
Model validation was tested using the Structural Equation Modeling (SEM) method to confirm whether the model's hypotheses were valid. The validation test consisted of CFA and Full Structural Model tests.
5.3.1 Confirmatory factor analysis (CFA)
CFA test was used to evaluate the validity and reliability of construct measurement models that could not be measured directly. This study refers to the standard goodness of fix measurement with assessment criteria in Table 2 [26]. CFA was performed both on exogenous variables and endogenous variables. There was only one exogenous variable in this model, i.e., owner performance, and there were four endogenous variables: design consultant performance, supervisory consultant performance, contractor performance, and project success performance.
The result showed that the owner performance variable met the requirements of the goodness-of-fit test based on GFI, AGFI, TLI, and CFI values. The next step was to examine the loading factor to ascertain whether the indicators qualified for the standardized loading factor value of > 0.50. No indicator had a loading factor value of ≤ 0.50, so all indicators for owner performance, i.e., O1, O2, O3, O4, and O5 are accepted and could be used for further analysis in the next model.
Table 2. Goodness of fit
|
Measures |
Cut off |
|
Probability |
≥ 0.05 |
|
CMIN/DF |
≤ 2 |
|
GFI |
≥ 0.9 |
|
AGFI |
≥ 0.9 |
|
TLI |
≥ 0.9 |
|
RMSEA |
0.05 – 0.08 |
The endogenous variables consisted of four variables, i.e. design consultant, supervisory consultant, contractor, and project success, as these variables were linked for CFA analysis. The result showed that the model fit was based on TLI and CFI values; but not on CMIN/DF, GFI, AGFI, and RMSEA. The next step was to look at the loading factor value to ascertain whether the indicators could be used. Since the standardized loading factor values of P7, S1, and S3 < 0.50, these indicators were eliminated. After the recalculating procedure, it was obtained that the model fit the GFI, TLI, CFI, and RMSEA values.
5.3.2 Full structural model test
The full structural model test was carried out by employing indicators that had been tested and disposing of indicators with estimated values of < 0.5 in the CFA test. The result showed that the model fit the TLI, CFI, and RMSEA values but not CMIN/DF, GFI, and AGFI values.
5.3.3 Data normality
The data normality test is intended to determine the normal distribution of each variable [27]. In this study, a data normality test was conducted with outlier elimination, i.e. removing data with extreme values where the Mahalanobis distance p2 < 0.05. Eighty-one extreme data were discarded, leaving 192 data. After the elimination, the data were still not distributed normally, and if data reduction continued, it would create the amount of data left to be too small. Therefore, no further elimination was taken, and bootstrapping was undertaken to overcome the problem with non-normal data on a multivariate basis [27].
Figure 4. Model modification
5.3.4 Bootstrapping
Bootstrapping is a technique by re-sampling the original sample treated as a population, so the original sample produces additional multiple data. The bootstrapping method was done on the AMOS program.
5.3.5 Model modifications
Model modification is done based on indices that aim to produce a better fit model. A considerable modification indices value indicates a relationship that will significantly influence the model’s fit [27]. Figure 4 shows model modifications that produce better CMIN/DF, GFI, TLI, CFI, and RMSEA.
5.4 Hypothesis testing
According to the SEM analysis, it can be resumed that:
5.5 Direct, indirect, and total effects
Table 3 below shows the relationships between variables based on the standardized direct effects test. Based on this Table, it can be explained that:
Table 4 shows the relationships among variables based on standardized indirect effects. It can be seen that:
Table 3. Standardized direct effects
|
Own |
Des |
Sup |
Con |
Succ |
|
|
Des |
.407 |
.000 |
.000 |
.000 |
.000 |
|
Sup |
.443 |
.327 |
.000 |
.000 |
.000 |
|
Con |
.360 |
.126 |
.230 |
.000 |
.000 |
|
Succ |
.204 |
-.026 |
.045 |
.810 |
.000 |
Table 4. Standardized indirect effects
|
Own |
Des |
Sup |
Con |
Succ |
|
|
Des |
.000 |
.000 |
.000 |
.000 |
.000 |
|
Sup |
.133 |
.000 |
.000 |
.000 |
.000 |
|
Con |
.184 |
.075 |
.000 |
.000 |
.000 |
|
Succ |
.455 |
.177 |
.186 |
.000 |
.000 |
Table 5 shows the relationships among variables based on standardized total effects. It explains that:
Table 5. Standardized total effects
|
Own |
Des |
Sup |
Con |
Succ |
|
|
Des |
.407 |
.000 |
.000 |
.000 |
.000 |
|
Sup |
.576 |
.327 |
.000 |
.000 |
.000 |
|
Con |
.543 |
.201 |
.230 |
.000 |
.000 |
|
Succ |
.659 |
.151 |
.231 |
.810 |
.000 |
Two tests were conducted namely the CFA test and the full model test. The CFA test was conducted to validate latent variable indicators, while the full model test was conducted to validate causal relationships between latent variables. Based on the CFA test, of the 27 indicators obtained from the theory, three indicators, namely P7, S1, and S3 were discarded because they had a loading factor value of 0.50 leaving 24 valid indicators. Thus, from the CFA analysis, five valid indicators were obtained for owner performance, two valid indicators for designer performance, six valid indicators for supervisor performance, seven valid indicators for contractor performance, and four valid indicators for project success performance.
The full model test was carried out after going through the normality test, bootstrapping and model modification to get a better fit model. The result of the full model test is a model fit that meets the requirements of CMIN / DF, GFI, TLI, CFI, and RMSEA values. Based on this analysis, it can be concluded that seven hypotheses are accepted from the ten developed hypotheses. The accepted hypotheses are H1, H2, H3, H4, H5, H8, and H10, and the three rejected hypotheses were H6, H7, and H9.
SEM analysis provides regression weight values as in Table 6 below which shows the significance of the relationship between latent variables. The owner's performance has a positive and significant impact on the performance of all other key stakeholders, namely the performance of the design consultant (H1), the performance of the supervisory consultant (H2), the performance of the contractor (H3), and the success of the project (H4). These results are in line with the literature where the owner performs a vital responsibility in project achievement. The owner ensures that all parties work with good performance and support each other as a project team [20]. The owner who engages better in a project will avoid problems and increase project success [20].
Design consultant performance has a positive and significant influence on supervisory consultant performance (H5), but design consultant does not have a significant effect on contractor performance (H6) and project success (H7). Thus, the design consultant mainly plays role in providing support to the supervisory consultant. The low correlation value of the design consultant on project success is in line with [16]. From the interview, it was found that in some cases project design is often carried out a long time before the project execution began so during the execution stage, it is often found that the design consultant is absent. When a design-related problem is found in the execution stage, the contractor and supervisory consultant mainly solve the problem. This may explain why the role of the design consultant is rated insignificant.
Supervision consultant performance positively affects contractor performance (H8), but supervisory consultant does not significantly affect project success (H9). Thus, the influence of the supervisory consultant on project success is indirect, i.e. through its support of contractor performance. Ghozali [20] says that the supervision consultant's primary job is to supervise the contractor's work and prevent rework. The low direct influence of supervisory consultants on project success is also in line with findings from the research [16].
Contractor performance influence on project success has the highest correlation value of 0.81. This result is in line with the researches [16, 23]. The contractor is the party that directly works on project activities, so its performance is very decisive for the project's success [20].
With SEM analysis can also be obtained the direct, indirect, and total effects of the relationship between latent variables. Related to the direct effects, the owner has an important influence on the performance of all project parties and the success of the project. While the designer has a direct influence on the performance of the supervisor only but does not have a significant effect on the performance of the contractor and the success of the project. Likewise, the supervision consultant has a direct influence on contractor performance but does not have a significant direct influence on project success. Meanwhile, the contractor is the party who has the greatest direct influence on the success of the project.
Table 6. Regression weight
|
Est |
S.E. |
C.R. |
P |
Label |
|||
|
Des |
< |
Own |
0.588 |
0.158 |
3.718 |
*** |
par_28 |
|
Sup |
< |
Own |
0.595 |
0.125 |
4.778 |
*** |
par_18 |
|
Sup |
< |
Des |
0.304 |
0.073 |
4.145 |
*** |
par_21 |
|
Con |
< |
Des |
0.090 |
0.058 |
1.557 |
0.12 |
par_20 |
|
Con |
< |
Sup |
0.178 |
0.071 |
2.486 |
0.01 |
par_23 |
|
Con |
< |
Own |
0.374 |
0.108 |
3.450 |
*** |
par_29 |
|
Succ |
< |
Own |
0.230 |
0.078 |
2.936 |
0 |
par_19 |
|
Succ |
< |
Des |
-0.020 |
0.040 |
-0.502 |
0.62 |
par_22 |
|
Succ |
< |
Sup |
0.037 |
0.049 |
0.768 |
0.44 |
par_24 |
|
Succ |
< |
Con |
0.876 |
0.113 |
7.729 |
*** |
par_25 |
Based on the indirect effect as shown in Table 4, the owner has an indirect influence on the performance of supervisors, contractors, and project success. While the designer has an indirect influence on the performance of the contractor and the success of the project. While the supervisor has an indirect influence on the performance of the project's success through the performance of the contractor. Based on the indirect effect, the owner performance relationship to project success has the highest coefficient value (0.455), followed by the supervisory consultant (0.186) and design consultant (0.177). It is interesting because the owner is often assumed to have a lower role than consultants.
Finally, based on the total effect, contractor performance has the highest coefficient value (0.810) on project success, followed by owner performance (0.659), supervisory performance (0.231), and design consultant performance (0.151).
Figure 5. Final model
Figure 5 shows the final model of the relationship between the key stakeholders of a construction project in Indonesia at the execution stage. The owner has a very important role because it can affect the performance of all other key stakeholders. The designer only plays a role in supporting the performance of the supervision consultant, while the supervision consultant has an important role in the performance of the contractor. The contractor is the party who plays the most important role in the success of the project.
This study found valid indicators of project stakeholder performance variables and project success variables in the implementation of construction projects in Indonesia. It evaluates relationships among key stakeholders, which consist of the owner, design consultant, supervision consultant, and contractor, on project success performance in a construction project execution. Out of the ten developed hypotheses, three were rejected, leaving seven accepted hypotheses. The role of the owner is important as it influences all of the other parties, i.e. design consultant, supervision consultants, contractors, and project success performances. The role of the owner is considered more important than that of the design and supervisory consultants. The owner, therefore, needs to be more engaged in the project execution to give support, directions, and supervision. The primary role of the design consultant is in supporting the supervision consultant. The role of the supervision consultant on project success is not direct, but it is significant to its support of contractor performance. Based on the total effect and the direct effect, the contractor is the party who plays the most important role in the success of the project, therefore, the contractor's performance needs to get the most attention.
Questionnaire
Section I: Respondent information
1. Respondent name: ………………..
2. Phone number/ email address: …………….……………..
3. Institution/ company: …………..
4. Construction project experience:
< 5 year 5 sd 10 year > 10 year
5. You work as:
Owner Designer Supervisor Contractor
Section II: Project information
To fill out the following questions, specify one project that you have worked on.
8. Type of project:
Building Infrastructure Else: ……
9. The owner of the project:
Government Private Else: ……
10. Project value:
< 2,5 billion Rp 2,5 – 50 billion Rp > 50 – 100 billion Rp > 100 billon Rupiah
Section III: Questions
Based on your association with the project as you mentioned above, you are kindly requested to indicate your level of agreement on the following statements on a 5-point Likert scale where: (1) Strongly disagree; (2) Disagree; (3) Indifferent; (4) Agree; (5) Strongly Agree.
|
No |
Statements |
1 |
2 |
3 |
4 |
5 |
|
O1 |
The project execution time given is adequate |
|
|
|
|
|
|
O2 |
The owner makes payment on time |
|
|
|
|
|
|
O3 |
On-time owner approval on documents needed for the project |
|
|
|
|
|
|
O4 |
Owner participation |
|
|
|
|
|
|
O5 |
Good owner supervision |
|
|
|
|
|
|
R1 |
The design consultant actively monitors and oversees the implementation of the work |
|
|
|
|
|
|
R2 |
The design consultant’s supports |
|
|
|
|
|
|
P1 |
Supervising consultant conducts a good evaluation of the contractor's work plan |
|
|
|
|
|
|
P2 |
The supervising consultant’s team |
|
|
|
|
|
|
P3 |
Supervising consultants supervise well & provide work direction |
|
|
|
|
|
|
P4 |
Supervising consultants make timely decisions |
|
|
|
|
|
|
P5 |
Supervising consultants coordinate with the project team well |
|
|
|
|
|
|
P6 |
The supervising consultant performs project administration (reporting) well |
|
|
|
|
|
|
P7 |
The supervising consultant is in the field at all times during working hours |
|
|
|
|
|
|
K1 |
The contractor has an adequate working capital |
|
|
|
|
|
|
K2 |
The contractor prepares a good work plan |
|
|
|
|
|
|
K3 |
The contractor’s work forces |
|
|
|
|
|
|
K4 |
The contractor’s technology/ equipment |
|
|
|
|
|
|
K5 |
QSHE implementation |
|
|
|
|
|
|
K6 |
The contractor’s monitors & controls the project properly |
|
|
|
|
|
|
K7 |
The contractors coordinate with the project team well |
|
|
|
|
|
|
S1 |
The project is running according to the scope as in the contract |
|
|
|
|
|
|
S2 |
The project progresses according to the timeline |
|
|
|
|
|
|
S3 |
The project costs on budget |
|
|
|
|
|
|
S4 |
The project meets quality as in the specification |
|
|
|
|
|
|
S5 |
HSE implementation is going well |
|
|
|
|
|
|
S6 |
The owner is satisfied with the work |
|
|
|
|
|
[1] BPS. (2021). Statistical Yearbook of Indonesia 2021. BPS-Statistics Indonesia. https://www.bps.go.id/publication/2021/02/26/938316574c78772f27e9b477/statistik-indonesia-2021.html
[2] Svendsen, A. (2022). Roadmap for an Energy Efficient, Low-Carbon Buildings and Construction Sector in Indonesia. https://ens.dk/en.
[3] Muliawan, J., Yudhistira, A., Chandra, H.P.P., Ratnawidjaja, S. (2018). Analysisi of causes, impacts, prevention and treatment of occupational accident victims in construction projects. Jurnal Dimensi Pratama Teknik Sipil, 7(2).
[4] Kog, Y.C. (2019). Construction delays in Indonesia, Malaysia, Thailand, and Vietnam. Practice Periodical on Structural Design and Construction, 24(3): 04019013. https://doi.org/10.1061/(ASCE)SC.1943-5576.0000434
[5] BPK (The Supreme Audit Agency). (2017). Insufficient competency of supervisors and owner – Cause infrastructure projects are harming regional finances. https://jatim.bpk.go.id/dari-media/kompetensi-pengawas-dan-ppk-kurang-penyebab-proyek-infrastruktur-merugikan-keuangan-daerah/, accessed on Dec. 12, 2021.
[6] Maya, E. (2018). Kompetensi pengawas proyek dipertanyakan. Project Supervisor Competence is in Question. https://www.suaramerdeka.com.
[7] Negara, K.P., Lamari, F., Susilawati, C., Trigunarsyah, B. (2020). Is technical competency necessary for client project manager? An empirical study of commitment-making officers (PPK) in Indonesian public construction. International Journal on Advanced Science, Engineering and Information Technology, 10(5): 2075-2081. https://doi.org/10.18517/ijaseit.10.5.12801
[8] Oppong, G.D., Chan, A.P., Dansoh, A. (2017). A review of stakeholder management performance attributes in construction projects. International Journal of Project Management, 35(6): 1037-1051.
[9] Freeman, R.E. (1984). Strategic Management: A Stakeholder Approach. Cambridge University Press.
[10] PMI. (2017). A Guide to the Project Management Body of Knowledge.
[11] Tengan, C., Aigbavboa, C. (2017). Level of stakeholder engagement and participation in monitoring and evaluation of construction projects in Ghana. Procedia Engineering, 196: 630-637. https://doi.org/10.1016/j.proeng.2017.08.051
[12] Government Regulations (2020). Government Regulations Number 22/2020 concerning Construction Services. https://jdih.pu.go.id/detail-dokumen/2750/1#div_cari_detail.
[13] Littau, P., Jujagiri, N.J., Adlbrecht, G. (2010). 25 years of stakeholder theory in project management literature (1984-2009). Project Management Journal, 41(4): 17-29. https://doi.org/10.1002/pmj.20195
[14] Rani, A., Singh, R., Taneja, S., Prasad, A.B., Dhiman, S. (2021). A review on key performance indicators for measuring real estate project success. International Journal of Sustainable Development and Planning, 16(4): 791-800. https://doi.org/10.18280/ijsdp.160420
[15] Das, D., Ngacho, C. (2017). Critical success factors influencing the performance of development projects: An empirical study of constituency development fund projects in Kenya. IIMB Management Review, 29(4): 276-293. https://doi.org/10.1016/j.iimb.2017.11.005
[16] Marleno, R., Surjokusumo, S., Oetomo, W., Ikhsan, M. (2018). The influence of stakeholder factors affecting the success of construction projects in Indonesia. https://doi.org/10.1088/1742-6596/1114/1/012135
[17] Derakhshan, R., Turner, R., Mancini, M. (2019). Project governance and stakeholders: A literature review. International Journal of Project Management, 37(11): 98-116. https://doi.org/10.1016/j.ijproman.2018.10.007
[18] Scott-young, C., Samson, D. (2008). Project success and project team management: Evidence from capital projects in the process industries. 26: 749-766. https://doi.org/10.1016/j.jom.2007.10.006.
[19] Wang, W., Liu, W., Mingers, J. (2015). A systemic method for organisational stakeholder identification and analysis using Soft Systems Methodology (SSM). European Journal of Operational Research, 246(2): 562-574. https://doi.org/10.1016/j.ejor.2015.05.014
[20] Fewings, P., Henjewele, C. (2019). Construction Project Management: An Integrated Approach.
[21] Okoye, P.U. (2021). Factors influencing clients’ commitment to sustainable construction practices. International Journal of Sustainable Development and Planning, 16(1): 39-4810. https://doi.org/18280/ijsdp.160104
[22] Song, L., Zhu, J., Liu, S., Qu, Z. (2022). Recent fire safety design of high-rise buildings. Journal of Urban Development and Management, 1(1): 50-57. https://doi.org/10.56578/judm010106
[23] Das, D., Ngacho, C. (2017). Critical success factors influencing the performance of development projects in Kenya: A confirmatory factor analysis. International Journal of Project Organisation and Management, 8(2): 172-196. https://doi.org/10.1504/IJPOM.2016.076390
[24] Abdeldayem, M.M., Aldulaimi, S.H., Baqi, A. (2022). Corporate sustainability strategies are often easier said than done. Opportunities and Challenges in Sustainability, 1(1): 76-85. https://doi.org/10.56578/ocs010108
[25] Thakkar, J.J. (2020). Structural Equation Modelling Application for Research and Practice (with AMOS and R). SpringerLink.
[26] Hair, J.F., Anderson, R.E.R.L., Black, W.C. (1998). Multivariate Data Analysis. Englewood Cliffs, NJ: Prentice-Hall.
[27] Ghozali, I. (2005). Model Persamaan Struktural: Konsep dan Aplikasi Dengan Program AMOS 24, 7th ed. Badan Penerbit Universitas Diponegoro.