Dedy Miswar*![]() | Agus Suyatna
| Agus Suyatna![]() | Wan Abbas Zakaria
| Wan Abbas Zakaria![]() | Endro P. Wahono
| Endro P. Wahono![]() | Yazid Saleh
| Yazid Saleh![]() | Suhendro Suhendro
| Suhendro Suhendro![]()
© 2023 IIETA. This article is published by IIETA and is licensed under the CC BY 4.0 license (http://creativecommons.org/licenses/by/4.0/).
OPEN ACCESS
This study aims to create a thematic spatial model of environmental carrying capacity for sustainable agriculture. The model was made with interpretation, surveys, and scoring an index for each modeling unit as the maximum level of resource for all ecosystem services using a GIS. The data analysis was carried out descriptively with an environmental approach for each unit in the entire region based on the results of ecoregion and land cover overlays. The results are in the form of thematic spatial models, environmental carrying capacity, and sustainable agriculture for each data used including the activity center model. Based on the results of this study, the future implications for the environmental carrying capacity model can be the basis for making RTRW, therefore this research can be used as one of the guidelines in making policies for an area, especially related to planning that is used as strategic land for regional development planning.
capacity, carrying, geospatial, GIS, modeling
The fixed area of agricultural land in Indonesia with increasing population growth will lead to reduced availability over time. This might also cause an imbalance in the population working as farmers in the existing agricultural land. Consequently, the pressure on the land becomes greater, in other words, the region will no longer be able to meet the food needs of its population [1]. Agriculture is expected to increase food availability which is an important basic need in life. Food is needed as a source of energy and to regulate the body's metabolism. The greater the percentage of land used for agriculture, the greater the carrying capacity [2].
One indicator of community welfare is the assurance of food as the most basic needs, also, Indonesia is an agricultural country whose populations are mostly farmers. However, the agricultural land has continued to experience a decline both in quality and quantity [3, 4]. This is due to the population pressure which continues to increase thereby reducing the availability of land to support people's lives, also known as land carrying capacity [5, 6]. The carrying capacity is the ability of the agricultural land to support the lives of people in an area, especially related to meeting food needs [7]. Therefore, analyzing the carrying capacity of agricultural land is very important for development planning, which can provide an overview of the relationship between population, land use, and the environment [8, 9]. Previous studies have examined the impact of the geographic condition on people and their entire livelihoods [10]. Determining the level of support from an area/land is very important for development planning to estimate various possibilities or the level of population needs adapted to the existing land conditions [11].
The population continues to increase and the development activities carried out have substituted the function of agricultural land to produce food with other uses, such as settlements and offices [12]. This situation has reduced the availability of agricultural land to meet the food needs of the population. According to Moniaga [13], although in society there are mechanisms to regulate the rate of population growth, the population density in many places has exceeded the carrying capacity. This is demonstrated in the cultivation of protected landscaping forests or it can be said that protected forest cultivation is reduced, as well as encroachment and illegal settlements on land to be used for agriculture [14] thereby causing environmental damage. The population is the main factor that determines the level of demand for consumption materials to be provided, as well as the number of public facilities needed in an area [15].
Population growth increases the rate of natural resource utilization as settlements for human life and other living things [16, 17]. This has culminated in a decrease in the quality and quantity of the environment in several areas of the Pringsewu Regency. Therefore, the use of natural resources must be carried out wisely, particularly by considering the environmental carrying capacity [18, 19]. In other words, the carrying capacity of the environment must serve as the basis for the use of natural resources, as well as development and spatial use planning [20, 21].
With the increasing demand and the scarcity of fertile agricultural land, as well as the competition for land use between the agriculture and non-agriculture sectors, there is a need to determine the carrying capacity of an area [22, 23]. According to a previous study, it is increasingly needed with the rising implementation of development [24]. Moreover, the carrying capacity is very useful in directing the course of development and to achieve the desired goals. Without a good regional carrying capacity, an imbalance will occur between land use, potentials, and needs [25, 26]. This condition can harm the community and the state, it is often found in agriculture land that has changed its function to non-agriculture comprising settlements, industrial purposes, and the use of protected forests as cultivated land [27].
The carrying capacity of the environment is important as the basis for the development of an area [28]. As mandated in Law 32 of 2009 concerning the carrying capacity of the environment contained in several articles including Article 12, without the Environmental Protection and Management Plan, the use of Development resources will affect the welfare of the people living in the area. Meanwhile, humans have the most complex needs compared to other living things on earth [29] and one of the basic needs is food [30, 31].
Humans need food to effectively carry out daily activities, also, the majority of the Indonesian population depends on agriculture for their livelihood [32]. Agricultural land as a place of farming activities is decreasing due to the increasing population pressure on agriculture land. Besides, an important issue in today's development is sustainable food agriculture. One of the agricultural resources that need to be prioritized is land, especially for food production [33-35]. According to Sabiham [36], sustainable agriculture is the management of resources to produce basic human needs, namely clothing, food, and shelter, while also maintaining, improving, and preserving the quality of the environment.
The natural resources in Pringsewu Regency are mostly used for agricultural activities, especially for staple food agriculture or rice fields. The Regency has a fairly large area of rice fields and is a district that supplies rice production needs in Lampung Province. From the number of rice fields, the Pringsewu Regency Government through Regional Regulation No. 2 of 2012 has estimated the area of wet food agriculture (paddy fields) to be 6,494 ha. The government's efforts to control changes in the use of paddy fields are yet to show results. This is because numerous paddy fields have turned into other non-agricultural uses such as settlements [37, 38].
Pringsewu Regency is one of the regencies in Lampung Province, with an area of 62,500 ha, data from the Central Statistics Agency (BPS) shows that there was a decrease in the area of rice fields in 2012 by 13,785,19 ha, and 2014 to 13,269,45 ha. Furthermore, the conversion of agricultural land into other uses in the Regency reached 515,74 ha. The land in Pringsewu Regency can be divided into 4 ecoregions according to their characteristics and natural appearance. ecoregion intent includes (1) Sumatera fluvial plan; (2) Path Structural Plain Bukit Barisan (3) Bukit Barisan Trail Structural Mountains (4) Structural Hills Bukit Barisan Trail that each ecoregion generally has different characteristics, including the provision of food for humans [39]. To observe and protect sustainable food areas, it is necessary to identify and map the existing condition of the area based on the characteristics of land suitability [40, 41].
One of the efforts to accelerate the creation of environmental carrying capacity models for sustainable agriculture is the use of remote sensing techniques. Remote sensing plays a very important role in overcoming the problem of insufficient data, especially regarding the carrying capacity of the environment which is used as the basis for development planning [42]. Considering the available imagery for the study area, as well as the target, the remote sensing imagery used for information sources was the SPOT 5 satellite, due to its availability by the Geospatial Information Agency in 2015 and 2020. The analysis of the environmental carrying capacity for sustainable agriculture using Geographic Information System technology (ArcGis program) can support accuracy, speed in the preparation, and manufacture of spatial models for sustainable agriculture [43, 44].
Based on the description above, the preparation of environmental carrying capacity in an area is very important and strategic. Therefore, there is a need to support a clear methodological system that can accommodate all the interests of development and conservation, especially in spatial modeling of the environmental carrying capacity in the Pringsewu Regency. For sustainable agriculture and to characterize objects that are under or above the earth's surface, geospatial data must be able to represent the actual situation in the field. The quality of the geospatial data can be interpreted as the proximity to the actual situation in the field which is usually complex and needs to be simplified with a model [45].
2.1 Research design
Environmental carrying capacity is an instrument that explains the process of scientific studies to determine the ability of an area to support the needs of human life and other living creatures. Therefore, the modeling is carried out through an environmental approach based on the modeling units, parameters, indicators, and benchmarks. The carrying capacity is dynamic, complex, and highly dependent on the geographical characteristics of a region, the population, and the existing conditions of natural resources.
The methodology for making the carrying capacity model of environmental services uses the interpretation of satellite imagery, surveys, and index scoring for each modeling unit as the maximum level of resource from all ecosystem services and geospatial data overlays using GIS. The data sources used are the interpretation results of SPOT 5 satellite imagery, surveys, and documentation from related agencies. The result of image interpretation is to obtain tentative spatial data on land cover and ecoregions, then a survey was conducted to clarify the results in accordance with actual conditions. In addition, pictures were taken according to the study objectives to strengthen the interpretation and survey results, while the land cover and ecoregion spatial data were overlaid to produce new spatial data. This data was used as the basis for providing an ecosystem service index for each unit to produce spatial data on environmental carrying capacity. The carrying capacity based on ecosystem services was overlaid with sustainable agriculture spatial data to produce a map for sustainable agriculture in Pringsewu Regency.
2.2 Research sites
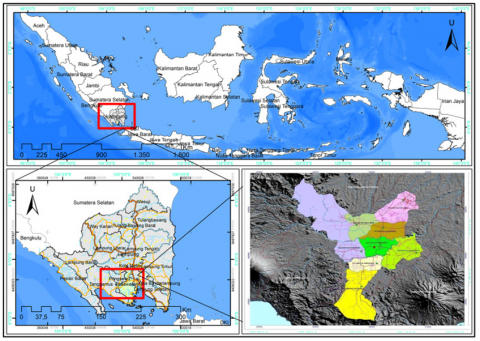
Geographically, Pringsewu County is located between 104°42'-105°8'E and between 5°8'-6°8'S. Pringsewu District has a land area of 625 km2, which is almost entirely land area. Most of the natural resource potential of Pringsewu District is utilized for agricultural activities (Figure 1).
2.3 Research tools and materials
The tools used in this study include GPS devices used to obtain information on the location and height of objects, a set of computers, which are used to process data from surveys and interpretations, other tools that support research such as abney levels, cameras and others. While the materials used in this study include a map of the Sumatra ecoregion on a scale of 1: 250,000 a map of soil types on a scale of 1: 250,000. 1:250,000 scale Geological Map, 1:50,000 scale digital RBI Map, SPOT 5 Imagery in 2015, Other thematic spatial data from Bappeda and related agencies, such as Dina Pertanian, Dinas Lingkungan hidup, and others.
2.4 Procedure research
This research was conducted through several stages including those shown in Figure 2.
Specifically, the procedure in this study was carried out in several stages as follows:
Stage 1: Preparation
This stage begins with reviewing the results of research on the carrying capacity of the environment and ecosystem services, especially in the regional scope, especially related to the use of remote sensing data and LP2B land data. Continued by reviewing policies, laws and regulations, and development programs related to research areas and compiling and making criteria regarding Ecosystem Services that will be used in making the carrying capacity of ecoregion environments based on ecosystem services; and drawing up a work plan and methodology to be used.
Stage 2: Secondary Data Collection and Surveys
This stage conducts a search for spatial data of Pringsewu Regency (Data Collecting). This data will later be used as the main material in the preparation of an inventory of the carrying capacity of the ecoregion environment based on ecoregion services, namely ecoregion data and land cover. Followed by the collection of various kinds of development policies and programs from relevant agencies, institutions/ SKPD; after that, extracting more detailed information through FGD (Focus Group Disscussion) or Indepth interviews with experts/experts in various fields using questionnaires and ending with filling out questionnaires from the parameters of Ecosystem Services in Pringsewu District.
Stage 3: Data Processing and Analysis
This stage is carried out by inputting data or entering coefficient values based on expert determination into spatial data that has been compiled with scoring techniques based on index values. Followed by data processing and analysis in the preparation of maps. Continued by tabulating regional data and information related to the carrying capacity of the environment based on ecosystem services, both based on administration (districts) and ecoregions. Ending with the processing of results and data analysis that produces 18 types of environmental carrying capacity maps based on ecosystem services will be used as verification material and ground checks as improvement results.
Stage 4: Observation
This stage is carried out considering the wide scope of the area, verification of observation results is carried out by conducting surveys based on administration in each sub-district, including with speakers and stakeholders as well as other parties related to research objectives.
Stage 5: Reporting of Research Results and Publications
The stage of making the results of this research is a series of research implementations carried out in accordance with research objectives including being published in reputable international journals.
2.5 Data analysis techniques
Data and unit analyses were carried out digitally using ArcGis software based on the index value given to the spatial data from the overlay of ecoregions and land cover using an environmental approach for sustainable food agriculture land. Data analysis techniques are carried out by scoring, specifically presented in Table 1.
Figure 1. Research sites
Figure 2. Procedure research
Table 1. Research data analysis techniques
|
Thematic Spatial Models |
Supporting Map |
Indicator |
Scoring |
|
Sustainable agriculture Model based on Environmental Carrying Capacity in ecosystem services |
Map of Carrying Capacity Model for Provider Ecosystem Services |
Food providers |
Score 1: Low Score 2: Medium Score 3: High |
|
Clean water providers |
|||
|
Fiber providers |
|||
|
Energy providers |
|||
|
Genetic source providers |
|||
|
Map of Cultural Ecosystem Service Carrying Capacity |
Map of dwellings and living spaces |
Score 1: Low Score 2: Medium Score 3: High |
|
|
Recreational map |
|||
|
Map of natural aesthetics |
|||
|
Map of Carrying Capacity Model for Regulatory Ecosystem Services |
Climate regulators |
Score 1: Low Score 2: Medium Score 3: High |
|
|
Water flow control and flood control |
|||
|
Prevention and protection from natural disasters |
|||
|
Water purification |
|||
|
Waste treatment and decomposition |
|||
|
Air quality maintenance |
|||
|
Natural pollination settings (pollination) |
|||
|
Pest and disease control |
|||
|
Map of Supporting Capacity Model for Supporting Ecosystem Services |
Map of soil layer formation and maintenance of fertility |
Score 1: Low Score 2: Medium Score 3: High |
|
|
Nutrient cycle map |
Geographically, the study area is located at a position of 104°42'-105°8'E and between 5°8'-6°8'S, Pringsewu Regency has a land area of 625 km2 and the natural resources present are mostly used for agriculture activities.
3.1 Ecosystem services provider in environmental carrying capacity models
The ecosystem services provide more emphasis on the provision of marine products, food from plants and animals, agriculture and plantation products for food, livestock products, water supply from the soil including its storage capacity, surface sources, forest products, sea, agriculture and plantation products for materials, firewood and fossil fuels [46, 47]. These ecosystem services are classified based on the index results for each ecoregion and land cover. The services providers in this study are food, clean water, fiber, energy and genetic resources.
Each ecosystem service provider is assigned an index value according to pre-determined criteria, namely: very high, high, medium, low, and very low which produced a spatial model in the form of ecosystem services provider distribution as shown in Table 2.
Table 2 shows that the highest index value in the food supply is in the Structural Plain ecoregion of the Bukit Barisan Trail at 13,30. Another ecoregion with a high value is the Sumatera Fluvial Plain with an index value of 6,90, and the constituent materials are generally heavily influenced by rivers. All natural processes, both physical and chemical, that lead to changes in the shape of the earth's surface are caused by the action of surface water, whether flowing in an integrated manner or concentrated [48, 49]. The fluviatile process produces a distinctive landscape due to the behavior of water flowing on the surface. The landscape is formed because of the erosion or sedimentation process carried out by surface water [50].
Furthermore, for the supply of clean water, ecoregions that have the highest index values are the Structural Plain of the Bukit Barisan Line and the Fluvial Plain of Sumatera [51] with values of 12,80 and 5.80, respectively. These two ecoregions are formed from the origin of structural and Fluvial processes, also, they have good water availability from surface and groundwater, while the river flows throughout the year, and springs are often found in buckling areas. Aside from food, another major need for humans is the availability of clean water [52].
Clean water is also one of the benefits obtainable from ecosystems, for example, the ground including its storage capacity, and surface sources. Naturally, clean water can come from the surface, such as rivers and lakes, or groundwater [53, 54] There are ecoregions in Pringsewu Regency that can provide benefits in the form of clean water.
Furthermore, clean water is a basic human need, hence, its availability is important, the availability of recharge areas will help maintain the stability of the water supply [55, 56]. The structural Plain of the Bukit Barisan Line and the Fluvial Plain of Sumatera ecoregions are also good fiber providers. Most of these ecoregions are still forested and naturally preserved. Ecosystems also provide natural fibers from plants, animals, or geological processes. Fibers derived from these sources can undergo weathering, for example, forest, marine, agriculture, and plantation products for materials [57]. There are ecoregions in Pringsewu Regency that can provide benefits in the form of fibers. Fiber originates from plants, animals, and geological processes. Fiber can be used as fuel for everyday life, such as burning material when cooking.
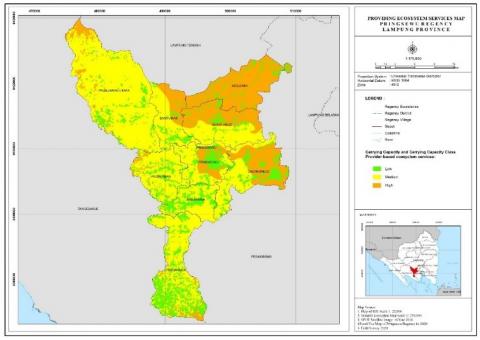
Meanwhile, ecoregions that provide good genetic resources are water bodies [58] with an index value of 19.60. The highest index value for energy sources was found in the Bukit Barisan Strip Structural Plain ecoregion with a value of 13,30. The ecoregion with the highest index in providing genetic resources is the Structural Plain of the Bukit Barisan Trail with a value of 17,40. Genetic resources are closely related to biodiversity, both flora and fauna, hence, high biodiversity will be followed by abundant genetic resources [59, 60]. The distribution of the index value for each ecoregion in Figure 3 shows the carrying capacity of the dominant provider of ecosystem services based on the high, medium, and low criteria, which are spread across all districts.
Table 2. Value of the ecosystem service carrying capacity index in each ecoregion
|
Ecoregion |
Carrying Capacity Index Value |
||||
|
Food |
Clean Water |
Fiber |
Energy |
Genetic Sources |
|
|
Sumatera fluvial plan |
6,9 |
5,8 |
6,3 |
7,3 |
7 |
|
Path Structural Plain Bukit Barisan |
13,3 |
12,8 |
19,6 |
13,3 |
17,4 |
|
Bukit Barisan Trail Structural Mountains |
3,1 |
3,2 |
6,1 |
3,6 |
6,3 |
|
Structural Hills Bukit Barisan Trail |
1,9 |
1,9 |
3,9 |
2,9 |
4,3 |
Source: Results of Data Processing Function Index and Criteria for Provider Ecosystem Services, with modifications
Figure 3. Carrying capacity model for provider ecosystem services
(Source: Personal Documentation of the Researchers, 2021)
3.2 Ecosystem services in cultural environmental carrying capacity models
Cultural ecosystem services emphasize spaces to live prosperously in the form of “hometown” with sentimental value, landscape features, natural uniqueness, or certain values that have become tourist attractions, and natural beauty with a selling value [61]. They are classified based on the index results for each ecoregion and land cover. The cultural ecosystem services in this study are (1) Map of residences and living spaces; (2) Recreation map; and (3) Map of natural aesthetics. Cultural ecosystem services in each ecoregion in Pringsewu Regency are spread over the districts. The distribution of the carrying capacity index values in each ecoregion is shown in Table 3.
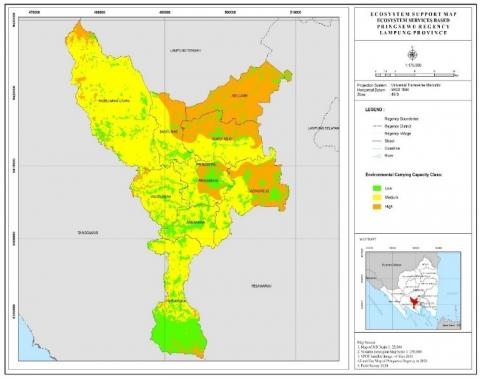
Table 3 shows that the carrying capacity of cultural ecosystem services is divided into high, medium, and low criteria. Ecoregions with high criteria are found in the Structural Plain of the Bukit Barisan Line with a Carrying Capacity Index Value of 13,60-17,90. That is, the location is rarely touched by humans due to geological factors. Meanwhile, the ecoregions of the Structural Mountains of the Bukit Barisan Trail and Hills of the Bukit Barisan Trail have a value between 1,80-4,00. It can be interpreted as an ecosystem that emphasizes the space to live and live in prosperity, anchor "hometown" that has sentimental value, landscape features, natural uniqueness, or certain values that are tourist attractions, and natural beauty that has a selling point. Figure 4 shows the carrying capacity of the dominant cultural ecosystem services based on the high, medium, and low criteria which are spread across all districts.
Table 3. Value of cultural ecosystem service carrying capacity in each ecoregion
|
Ecoregion |
Carrying Capacity Index Value |
||
|
Living space and residence |
Recreation |
Natural Aesthetics |
|
|
Sumatera fluvial plan |
8,7 |
4,6 |
5,1 |
|
Path Structural Plain Bukit Barisan |
17,9 |
13,6 |
15,4 |
|
Bukit Barisan Trail Structural Mountains |
2,8 |
3,8 |
4 |
|
Structural Hills Bukit Barisan Trail |
1,8 |
2,6 |
3,3 |
Source: Result of Data Processing Function Index and Criteria for Cultural Ecosystem Services with modifications.
Figure 4. Cultural ecosystem service carrying capacity model
(Source: Personal Documentation of the Researchers, 2021)
Based on the results of calculations and data overlays, alluvial plains play a high to very high role with an area of 23,801,02 hectares and are spread across Adiluwih, Sukoharjo, Gadingrejo, Pringsewu, Ambarawa, Pagelaran and parts of Banyumas Districts, while other sub-districts have a moderate ecosystem service role. downwards with an area of 38,698,98 hectares, this is because the area is located in the ecoregion area of the Bukit Barisan structural mountains and the Bukit Barisan structural hills.
Judging from the residence and living space, most of the vast land that has high potential as a place to live and living space is located in the ecoregion of the fluvial plains of Sumatra, and the structure of the Bukit Barisan line structure. Both ecoregions are areas that have flat geographical conditions and a relatively large supply of clean water, making them suitable for the development of facilities. In addition, the construction of facilities and infrastructure in the lowland ecoregion is relatively easy and low cost due to flat geographical conditions. Most of the vast land that has low potential for residence and living space is located in the fluvial plains of Sumatra, and the structure of the Bukit Barisan line structure.
In terms of recreational and ecotourism places, most of the land that has high potential as a place for recreation and ecotourism is located in the structure of the ecoregion plains of the barisan hill path, the structural mountains of the barisan hill path, and the structural hills of the barisan hill path. This ecoregion has cool air conditions that are suitable for use as a tourist area. Meanwhile, in terms of aesthetics, most of the land that has high aesthetic potential for natural beauty lies in the ecoregion of the Bukit Barisan Structural Plain, the Structural Mountains of the Bukit Barisan Line, and the Structural Hills of the Bukit Barisan Path.
3.3 Ecosystem services regulating environmental carrying capacity model
Naturally, ecosystem services are provided in the form of microclimate regulation, which includes temperature, humidity, rain, wind, greenhouse gas control, and carbon sequestration [62-64]. The function of climate regulation is influenced by the presence of biotic factors, especially vegetation, as well as the location and physiographic factors such as altitude and landforms. Areas with dense vegetation and large elevations such as mountains will have a better climate regulation system with direct benefits in reducing carbon dioxide emissions and the greenhouse effect as well as global warming impacts namely rising sea levels, extreme climate change, and heat waves [65, 66].
The role of ecosystem services in regulating the climate of each ecoregion is different [67], ecoregions with high to very high criteria have a dominant area compared to the Sumatera Fluvial Plain and Bukit Barisan Structural Plain. These regulatory ecosystem services emphasize the regulation of temperature, humidity, rain, control of greenhouse gases and carbon, the hydrological cycle, as well as natural infrastructure for water storage, flood control, water conservancy, natural infrastructure for prevention and protection from land fires, erosion, abrasion, landslides, storms and tsunamis, as well as the capacity of water bodies to dilute, decompose, and absorb pollutants. They also comprise the site's capacity to neutralize, decompose, and absorb waste with garbage, the capacity to regulate air chemistry systems, the distribution of habitats for supporting species of natural pollination processes, as well as the distribution of habitats for controlling species pests and diseases [68, 69].
These ecosystem services are classified based on the index results for each ecoregion and land cover. Regulatory ecosystem services in this study are (1) Climate control map; (2) Map of water flow control and flood control; (3) Map of prevention and protection from natural disasters; (4) Water Purification Map; (5) Map of waste treatment and decomposition; (6) Air quality maintenance map; (7) Map of natural pollination settings (pollination); and (8) Map of pest and disease control. Each regulatory ecosystem service is assigned an index value according to pre-determined criteria, namely very high, high, medium, low, and very low producing a spatial model in the form of the distribution of regulatory ecosystem services, the distribution of the carrying capacity index values in each ecoregion is shown in Table 4.
Table 4 shows that the highest index value on the carrying capacity of regulatory ecosystem services was found in the Structural Plain ecoregion of the Bukit Barisan Trail with a value of 19,9. Another ecoregion with a high value is the Sumatera Fluvial Plain ecoregion with an index value of 17,2. While the coefficient value between approximately 4,6 until 8,5 means that the regulatory function is supported by environmental conditions that are no longer natural, due to human factors. The setting function is supported by unspoiled environmental conditions. The more natural the environmental conditions, the greater the regulatory potential. Figure 5 shows the carrying capacity of the dominant regulatory ecosystem services based on the criteria of high, medium, and low which is spread throughout the district area.
Based on the results of overlay data calculations, it is known that most of the land that has high and very high potential in terms of climate regulation is located in four ecoregions of the study area, namely the fluvial sumatran plain, the structural plain of the Bukit Barisan route, the structural mountains of the Bukit Barisan route, and the structure of the Bukit Barisan line area. The four ecoregions are dominated by the use of forest land, plantations and agricultural land which are also oxygen producers. Land use and altitude cause the air in the mountains and hills to be cooler and relatively clean. Forests are also a natural filter of air pollution produced by human activities. Land that has low potential in climate control is mostly in the fluvial plains of Sumatra and the Bukit Barisan highway.
In terms of water management, it is known that the land with high to very high potential for water management in Pringsewu Regency has an area of 14,618,11 hectares or 1,928,93 of the total land area in Pringsewu Regency. The land that is potentially under water management has an area of 313,98 hectares. Meanwhile, land with low to very low potential has an area of 38,613,29 hectares and 7,025,27 hectares.
In terms of disaster prevention and protection aspects, it is known that land with high to very high potential in disaster prevention and protection in Pringsewu Regency has an area of 4,800,62 hectares and 10,866,23 of the total land in Pringsewu Regency. The potential land in disaster prevention and protection has an area of 14,163,08 hectares. Meanwhile, land with low to very low potential has an area of 30,620,7 hectares and 2,049,35 of the total land in Pringsewu Regency.
Reviewed for water purification matters, it is known that the land with high to very high potential for water purification in Pringsewu district has an area of 429,16 hectares and 2613,02 of the total land in Pringsewu district. The land that is potentially under water purification has an area of 666,14 hectares. while the low-potential land has an area of 48,267 hectares and 10,524,3 of the total land in Pringsewu district. most of the land that has high to high potential in rapeseed water purification is in the structural ecoregion of the Barisan Hills, the structural mountains of the Barisan Hills and the structural hills of the Barisan Hills.
Judging from the aspects of waste processing and decomposition, it is known that land that has moderate potential and dominates in waste processing and decomposition has an area of 39,654,49 hectares. Meanwhile, land with low to very low potential has an area of 5,636,48 hectares and 1,351,79 hectares of total land in Pringsewu District.
Judging from the regulatory aspects of air quality maintenance, the high to very high potential is 9,824,7 hectares and 3,546,99 hectares. Meanwhile, the medium potential is 28,144,3 hectares and the low to very low potential is 10,065,3 hectares and 10,918,3 hectares. The oxygen produced by the forest neutralizes the quality of the air and dirty particles that the plants absorb. This causes the air in the forest area to be relatively cool and clean. Although it does not dominate, the plantation area in Pringsewu Regency also has high potential in regulating air quality improvement.
Judging from the aspect of natural pollination, the land potential of each ecoregion located in Pringsewu Regency has a different area. Ecoregions that are classified as having a large or very high to high percentage of potential land are the Sumatra Fluvial Plain, the Bukit Barisan Line Structural Plain, and the Bukit Barisan Line Structural Hills. In fact, the Bukit Barisan Structural Mountains ecoregion also plays a role in natural pollination.
From the aspect of pest and disease control, it is known that the percentage of potential land that is large or the highest is the fluvial plain of Sumatra, the Bukit Barisan highway, and the structural hills of Bukit Barisan. although it is also found in the structural mountainous ecoregion of the Bukit Barisan line. The ecoregion area is 26,588,06 hectares and 22,528,4 hectares. The potential for pest and disease control with medium, low and very low potential is 5,997,85 hectares, 5,833,48 hectares and 1,551,79 hectares.
Figure 5. Carrying capacity model for regulatory ecosystem services
(Source: Personal Documentation of the Researchers, 2021)
Table 4. Value of regulatory ecosystem services carrying capacity in each ecoregion
|
Ecoregion |
Carrying Capacity Index Value |
|||||||
|
Climate Control |
Flood Control |
Natural Disasters |
Water Purification |
Waste Decomposition |
Air Quality |
Natural Pollination |
Pests And Diseases |
|
|
Sumatera fluvial plan |
5,6 |
7,5 |
8,5 |
4,6 |
7,5 |
5,8 |
15,2 |
17,2 |
|
Path Structural Plain Bukit Barisan |
11,7 |
14,6 |
16,7 |
15,6 |
13,6 |
16,6 |
19,9 |
19,1 |
|
Bukit Barisan Trail Structural Mountains |
5 |
5 |
4,5 |
5,5 |
4,6 |
6,5 |
5,2 |
4,7 |
|
Structural Hills Bukit Barisan Trail |
4,1 |
3,2 |
2,8 |
3,2 |
2,3 |
5,3 |
4,2 |
2,7 |
Source: Results of Data Processing Function Index and Criteria for Ecosystem Services Providers with modifications
3.4 Ecosystem services supporting environmental carrying capacity models
Supporting ecosystem services emphasize soil fertility, and levels of agriculture production [70]. They are classified based on the index results for each ecoregion and land cover. Supporting ecosystem services in this study are (1) Map of the formation of soil layers and maintenance of fertility; and (2) Nutrient cycle map. Each service is assigned an index value according to pre-determined criteria, namely very high, high, medium, low, and very low producing a spatial model in the form of the distribution of supporting ecosystem services. The distribution of the carrying capacity index values in each ecoregion is shown in Table 5.
Table 5 shows that the highest index value on the carrying capacity of supporting ecosystem services was found in the Structural Plain Ecoregion of the Bukit Barisan Trail with values of 19,4 and 18,3 on soil fertility and nutrient cycles respectively. Another ecoregion with a high value is the Sumatera Fluvial Plain ecoregion with an index value of 7,0-9,0. This coefficient value can be used like agricultural land for the surrounding community. The distribution of each ecoregion in Figure 6 shows the carrying capacity of the dominant supporting ecosystem services based on very high, high, medium, low and very low criteria spread across all districts.
Table 5. Value of supporting ecosystem services carrying capacity in each ecoregion
|
Ecoregion |
Carrying Capacity Index Value |
|
|
Soil fertility |
Nutrient cycle |
|
|
Sumatera fluvial plan |
9 |
7 |
|
Path Structural Plain Bukit Barisan |
19,4 |
18,3 |
|
Bukit Barisan Trail Structural Mountains |
1,9 |
1,9 |
|
Structural Hills Bukit Barisan Trail |
3 |
2,3 |
Source: Data Processing Result of Index Function and Criteria for Supporting Ecosystem Services with modifications
Based on the results of overlay data analysis calculations, in terms of ecosystem aspects supporting soil layer formation and ecoregion maintenance, most of the land with high to high potential to support soil formation and maintenance is in the Sumatran Fluvial Plain ecoregion. Structural Plains of Bukit Barisan, and Structural Hills. Traces of Bukit Barisan, although they exist in other ecoregions.
Continued with the supporting aspects of the land nutrient cycle that has the potential to support high to very high nutrient cycles in Pringsewu Regency which has an area of 25,488,19 hectares and 15,036,2 of the total land in Pringsewu Regency. The land that has the potential to support the moderate nutrient cycle has an area of 10,172,68 hectares. Meanwhile, land with low to very low potential has an area of 9,754,3 hectares and 2,048,18 of the total land in Pringsewu Regency.
Figure 6. Supporting capacity model for supporting ecosystem services
(Source: Personal Documentation of the Researchers, 2021)
3.5 Environmental carrying capacity model for sustainable food agricultural land
Sustainable agricultural land emphasizes substantial food sovereignty [71, 72]. The availability of data on spatial form as well as from survey results is an important prerequisite for realizing protection efforts according to the mandate of Law Number 41 of 2009. The management of several spatial data will be very difficult when performed manually. The spatial data in this case is on the environmental carrying capacity generated from the overlay of the service model of all ecosystem services, each of which has been assigned an index value. The criteria for the environmental carrying capacity model are divided into 3, namely: high, medium, and low. Furthermore, the carrying capacity model is overlaid again with Sustainable Food Agriculture Land. The results were also based on high, medium, and low criteria to distinguish as well as analyze sustainable food agriculture land. The area of sustainable agriculture based on the environmental carrying capacity for each district is shown in Table 6.
Table 6. Area of sustainable agriculture based on environmental carrying capacity
|
District |
Area based on Carrying Capacity |
Total |
||
|
High |
Middle |
Low |
||
|
Adiluwih |
15,79 |
0 |
738,63 |
754,42 |
|
Ambarawa |
372,21 |
0 |
1,69 |
1,954,63 |
|
Banyumas |
69,55 |
326,57 |
236,90 |
633,02 |
|
Gading Rejo |
158,11 |
1,343,02 |
1,606,71 |
3,107,84 |
|
Pagelaran |
112,61 |
1,576,27 |
15,88 |
1,704,76 |
|
Pagelaran Utara |
108,58 |
370,85 |
0,36 |
479,78 |
|
Pardasuka |
181,90 |
1,874,72 |
0 |
2,056,62 |
|
Pringsewu |
154,98 |
895,18 |
717,25 |
1,767,41 |
|
Sukoharjo |
46,20 |
587,52 |
519,14 |
1,152,86 |
|
Total |
1,219,92 |
8,554,85 |
3,836,56 |
13,611,34 |
Source: Sustainable agriculture model overlay results with environmental carrying capacity
Table 6 shows that based on the results of the calculation for the sustainable agriculture area in each district, it can be classified as moderate to high, with an area of 8,554,85 and 1,219,92 of the land area in Pringsewu Regency. The district with the most extensive sustainable agriculture is Ambarawa, while the area of sustainable agriculture with a low carrying capacity is North Pagelaran District. The distribution of each area based on its carrying capacity is shown in Figure 7.
Figure 7. Sustainable agriculture model based on environmental carrying capacity in ecosystem services
(Source: Personal Documentation of the Researchers, 2021)
Figure 5 shows that the carrying capacity ranging from low to high in sustainable agriculture is spread throughout the district area, but the most predominant is the medium. The results from environmental carrying capacity determination are used as a reference in the preparation of regional spatial plans. Considering that the carrying capacity of the environment cannot be limited based on administrative boundaries, the implementation of a spatial plan must consider the aspects of ecological linkages, effectiveness and efficiency of space utilization, while the management must pay attention to inter-regional cooperation.
The concept used to determine the critical threshold for carrying capacity is the assumption that there is a limited number of populations which can be supported without degrading the natural environment. The carrying capacity of the region is the maximum level at which the environment can be empowered by humans. In other words, it refers to the maximum population that can be supported indefinitely without destroying the ecosystem. Furthermore, the carrying capacity analysis is a development planning tool that provides an overview of the relationship between the population, land use, and the environment. It also provides the necessary information in assessing the level of land capability to support all human activities in the area concerned.
The information obtained from the analysis results in general will address the supporting capacity possessed by an area for development by comparing the amount of land owned and the existing population. The carrying capacity of the environment in spatial planning aims to ensure that the use of space will not exceed the limits of the environment's ability to support and accommodate human activities without causing environmental damage [73, 74]. Consequently, spatial planning that ignores the carrying capacity will certainly cause problems and degradation of environmental quality such as floods, landslides and droughts, pollution, etc. [75], this is due to climate change which potentially affects human existence [76].
The results are consistent with previous studies which showed that the potential of the area, both physical and social, greatly determines the development according to its designation and objectives [77, 78]. Regarding the environmental carrying capacity of sustainable agriculture for the activity centers, it is recommended that the government pay attention, especially to areas experiencing rapid development in the Pringsewu Regency spatial plan. Harmonization between activity centers and sustainable agriculture is important for development, especially on lands with high carrying capacity to physically and socio-economically support the conversion of agricultural land.
The essence of the concept of a sustainable agricultural system must meet three criteria such as the level of productivity of animals and plants, socio-economic survival, and the maintenance of resources in the long term [79]. Furthermore, Rotz [80] mentioned that various models of sustainable agricultural systems can be developed such as diversified agricultural models, inorganic agriculture, agroforestry and mixed agriculture. In essence, the main goal of sustainable agriculture is to increase productivity and strengthen food security [81].
Several previous relevant studies have also discussed innovations in the development of sustainable agriculture such as Basso & Antle [82] in the form of global food system design through digital agriculture with digital and geospatial technologies to monitor, assess, and manage soil, climate, and genetic resources and illustrate how to face these challenges balancing the economic, environmental and social dimensions of sustainable food production. The developed design framework can also be presented in Figure 8.
Figure 8. Design sustainable agricultural systems [82]
The design of this framework also supports the use of GIS for the benefit of sustainable agriculture with the aim of strengthening food in certain regions. In line with Delgado's research [83] it states that they introduced the WebGIS framework as a smart farm for regional and global coverage that is beneficial for the agricultural industry and local government policymakers. In addition, GIS is one of the tools for assessing the suitability of land for sustainable agriculture [84]. In addition, the role of advanced technologies such as IoT, UAVs, remote and ground sensors, communication technologies, and cloud computing, is needed to advance agriculture to meet the future of sustainable agriculture [85].
Some of these relevant studies at once illustrate that the benefits of sustainable agriculture are essential for increasing land production and conservation of natural resources [86]. Not only that, in order to support sustainable agriculture Rose et al. [87] it requires increased exchange of knowledge about sustainable agriculture for those farmers. Some countries are ambitious to be able to contribute to advancing this sustainable agriculture such as the results of sustainable agriculture research in the Himalayan region [88]; Central Romania (Cluj County) [89]; Kurdistan province, Iran [90]; Serbian [91] and several other countries.
The importance of applying technology to sustainable agriculture can be seen from an article [92] that released a line of usable software such as ADAPT (from Washington DC, USA); AGERmetrix (from Florida, USA); AgHub (from Texas, USA); Agrivi (from United Kingdom); Agroptima (from Spain); AgroSense (from Netherlands and Spain); AgVerdict (from California, USA); Akkerweb (from The Netherland); APEX TM JDLink (from Illinois, USA); CASE IH AFS software (from Wisconsin, USA); Connected Farm (from California, USA); Cropio (from New York, USA); Cropwin Vintel (from France); The Phytech Platform (from Israel); ESE™ Agri solution (from Massachusetts USA); Farmbrite (from Colorado, USA); FarmCommand (from Manitoba, Canada); Farmleap (From France); Farm Management Pro (from Ireland); KSAS (from Japan); Mapgrower (from Chile); Myeasyfarm (from France); My Farm Manager (from Alberta, Canada); Phoenix (from Queensland Australia); PLM Connect (from Italy); Telematics (from Germany); Visual Green (from Spain); WinGIS (from Austria). This line of software from various countries characterizes if the field can develop in the 5.0 era which has great benefits for global farmers.
Based on the results, a spatial model can facilitate the description of the data in the area. The data model created in the study is presented in a thematic form comprising administration, rainfall, groundwater basin, watershed, landform, slope, geology, soil type, contour, land use, road network, land capability, population, population density, ecoregion, and land cover. Furthermore, the spatial data model of ecosystem service-based environmental carrying capacity consists of: 1) provider 2) cultural; 3) regulatory; and 4) supporting ecosystem services. It is determined by two important components namely ecoregion and land cover, while the carrying capacity spatial model is categorized into 3, namely high, medium, and low. The most predominant ecoregion in Pringsewu Regency is the Bukit Barisan Strip Structural Plain. This ecoregion has an area of 28,557,3 hectares or approximately 45,69% of the total area in the Regency.
The sustainable agriculture land area was analyzed using a spatial approach based on the 4 activity centers in the study area in line with the Regional Regulation concerning the RTRW, comprising local and regional promotion centers, as well as regional and environmental service centers. The upcoming implications for the environmental carrying capacity model in Pringsewu District have not been used as a basis for making RTRW, therefore this research can be used as one of the guidelines in policy making for an area, especially related to planning which is used as strategic land for regional development planning.
In addition, the theme of sustainable agriculture is an important focus in strengthening global food considering the increasing population growth rate, so expect further research by developing technology-based models to be used by farmers to increase food productivity effectively and efficiently and practically can be used by farmers in Indonesia to achieve sustainable agriculture in the era of society 5.0.
The authors are grateful to the Pringsewu Regency Government, the Institute for Research and Community Service, the University of Lampung, and all stakeholders who supported this study.
[1] Ratu, A.S., Jocom, S.G., Lolowang, T.F. (2021). Analisis daya dukung lahan pertanian di kecamatan passi timur kabupaten bolaang mongondow (agriculture land carrying capacity analysis in east passi district, bolaang mongondow regency). Journal of Agribusiness and Rural Development (Jurnal Agribisnis dan Pengembangan Pedesaan), 3(1): 1-9.
[2] Jocom, S.G. (2017). kajian daya dukung lahan pertanian dalam menunjang swasembada pangan di kabupaten minahasa selatan. Jurnal Agri-Sosioekonomi, 13(1): 11-24. https://doi.org/10.35791/agrsosek.13.1.2017.14881
[3] Pretty, J. (2008). Agriculture sustainability: concepts, principles and evidence. Philosophical Transactions of the Royal Society B: Biological Sciences, 363(1491): 447-465. https://doi.org/10.1098/rstb.2007.2163
[4] Mubarokah, N., Rachman, L.M., Tarigan, S.D. (2020). Analisis daya dukung lahan pertanian tanaman pangan daerah aliran Sungai Cibaliung Provinsi Banten. Jurnal Ilmu Pertanian Indonesia, 25(1): 73-80. https://doi.org/10.18343/jipi.25.1.73
[5] Godfray, H.C.J., Garnett, T. (2014). Food security and sustainable intensification. Philosophical transactions of the Royal Society B, biological sciences, 369(1639): 20120273. https://doi.org/10.1098/rstb.2012.0273
[6] Mekuria, W. (2018). The link between agriculture production and population dynamics in Ethiopia, a review. Advances in Plants & Agriculture Research, 8(4): 348-353. https://doi.org/10.15406/apar.2018.08.00336
[7] Rees, W.E. (2018). Ecological footprints and appropriated carrying capacity: What urban economics leaves out. Urbanisation, 2(1): 285-297. https://doi.org/10.1177/0956247892004002
[8] Niemelä, J., Saarela, S.R., Söderman, T., Kopperoinen, L., Yli-Pelkonen, V., Väre, S., Kotze, D.J. (2010). Using the ecosystem services approach for better planning and conservation of urban green spaces: A Finland case study. Biodiversity and Conservation, 19(11): 3225-3243. https://doi.org/10.1007/s10531-010-9888-8
[9] Maria, R.P., Supardjo, S. (2018). Analisis daya dukung dan daya tampung lahan di kecamatan malalayang kota manado. Media Matrasain, 15(2): 36-49. https://doi.org/10.35792/matrasain.v15i2.21275
[10] Plokhikh, R., Fodor, G., Shaken, A., Berghauer, S., Aktymbayeva, A., Tóth, A., Dávid, L.D. (2022). Investigation of environmental determinants for agritourism development in almaty region of Kazakhstan. Geo Journal of Tourism and Geosites, 41(2): 354-361. https://doi.org/10.30892/gtg.41203-837
[11] Muta’ali L., (2011). Environmental carrying capacity based on spatial planning. Indonesian Journal of Geography, 43(2). https://doi.org/10.22146/ijg.2382
[12] Putra, H., Nasir, M. (2015). Analisis Faktor-Faktor yang Mempengaruhi Produksi Sektor Pertanian di Propinsi Aceh. Jurnal Agrisep, 16(1): 53-60.
[13] Moniaga V.R.B., (2011). Analisis Daya Dukung Lahan Pertanian. Jurusan Sosial Ekonomi Fakultas Pertanian Universitas Sam Ratulangi. Manado, AGRI-SOSIOEKONOMI, 7(2): 61-68. https://doi.org/10.35791/agrsosek.7.2.2011.92
[14] Lusiana, B., van Noordwijk, M., Cadisch, G. (2012). Land sparing or sharing? Exploring livestock fodder options in combination with land use zoning and consequences for livelihoods and net carbon stocks using the FALLOW model. Agriculture, Ecosystems & Environment, 159: 145-160. https://doi.org/10.1016/j.agee.2012.07.006
[15] Didu, S., Fauzi, F. (2016). Pengaruh jumlah penduduk, pendidikan dan pertumbuhan ekonomi terhadap kemiskinan di Kabupaten Lebak. Jurnal Ekonomi-Qu, 6(1). http://dx.doi.org/10.35448/jequ.v6i1.4199
[16] Schneider, F., Kallis, G., Martinez-Alier, J. (2010). Crisis or opportunity? Economic degrowth for social equity and ecological sustainability. Introduction to this special issue, Journal of cleaner production. 18(6): 511-518. https://doi.org/10.1016/j.jclepro.2010.01.014
[17] Christiani, C., Tedjo, P., Martono, B. (2014). Analisis Dampak Kepadatan Penduduk Terhadap Kualitas Hidup Masyarakat Provinsi Jawa Tengah. Jurnal Serat acitya, 3(1): 102. http://dx.doi.org/10.56444/sa.v3i1.125
[18] Prayitno, G., Wardana, N.W.S. (2019). Analysis of land carrying capacity for the development of leading commodities in Kulon Progo Regency. Indonesia. GEOMATE Journal, 16(53): 171-176. https://doi.org/10.21660/2019.53.37276
[19] Andriansyah, A., Sulastri, E., Satispi, E. (2021). The role of government policies in environmental management. Research Horizon, 1(3): 86-93. https://doi.org/10.54518/rh.1.3.2021.86-93
[20] Rusdiyanto, W., Riani, A.L. (2015). Pengaruh kepemimpinan transformasional dan transaksional terhadap kepuasan kerja dan organizational citizenship behavior. Jurnal Economia, 11(2): 161-168. https://doi.org/10.21831/economia.v11i2.7950
[21] Marfai, M.A. (2019). Pengantar Etika Lingkungan dan Kearifan Lokal.
[22] Francis, C.A., Hansen, T.E., Fox, A.A., Hesje, P.J., Nelson, H.E., Lawseth, A.E., English, A. (2012). Farmland conversion to non-agriculture uses in the US and Canada: Current impacts and concerns for the future. International Journal of Agriculture Sustainability, 10(1): 8-24. https://doi.org/10.1080/14735903.2012.649588
[23] Sharma, V.P. (2015). Dynamics of land use competition in India: Perceptions and realities. http://hdl.handle.net/11718/16626.
[24] Banta, W., Gibbs, M. (2009). Factors controlling the development of the aquaculture industry in New Zealand. legislative reform and social carrying capacity, Coastal Management, 37(2): 170-196. https://doi.org/10.1080/08920750902758473
[25] Peng, J., Du, Y., Liu, Y., Hu, X. (2016). How to assess urban development potential in mountain areas? An approach of ecological carrying capacity in the view of coupled human and natural systems. Ecological indicators, 60: 1017-1030. https://doi.org/10.1016/j.ecolind.2015.09.008
[26] Wang, X., Dong, X., Liu, H., Wei, H., Fan, W., Lu, N., Xing, K. (2017). Linking land use change, ecosystem services and human well-being: A case study of the Manas River Basin of Xinjiang, China. Ecosystem services, 27: 113-123. https://doi.org/10.1016/j.ecoser.2017.08.013
[27] Murhaini, S., Ludang, Y. (2020). Sociological Aspects of Transferred Land to Settlements in Indonesia. International Journal of Management (IJM), 11(3): 247-255.
[28] Moldan, B., Janoušková, S., Hák, T. (2012). How to understand and measure environmental sustainability. Indicators and targets. Ecological Indicators, 17: 4-13. https://doi.org/10.1016/j.ecolind.2011.04.033
[29] Pecl, G.T., Araújo, M.B., Bell, J.D., Blanchard, J., Bonebrake, T.C., Chen, I.C., Williams, S.E. (2017). Biodiversity redistribution under climate change. Impacts on ecosystems and human well-being, Science, 355(6332). https://doi.org/10.1126/science.aai9214
[30] Prasetiyani, I., Widiyanto, D. (2013). Strategi menghadapi ketahanan pangan (dilihat dari kebutuhan dan ketersediaan pangan) penduduk Indonesia Di Masa Mendatang. Jurnal Bumi Indonesia, 2(2). https://core.ac.uk/download/pdf/295176009.pdf
[31] Talumingan, C., Jocom, S.G. (2017). Kajian daya dukung lahan pertanian dalam menunjang swasembada pangan di kabupaten minahasa selatan. Jurnal Agri-Sosio Ekonomi Unsrat, 13(1): 11-24. https://doi.org/10.35791/agrsosek.13.1.2017.14881
[32] Faiz, A.Z., R Rijanta, R.R. (2019). Pola pemanfaatan sumberdaya lahan untuk aktivitas pertanian di kecamatan jumo, Kabupaten Temanggung. Jurnal Bumi Indonesia, 8(1).
[33] Widowaty, Y., Wahid, D.A. (2021). Law enforcement of land transfer from agriculture land to housing in Indonesia. International Conference on Agribusiness and Rural Development (IConARD 2020), 232: 04008. https://doi.org/10.1051/e3sconf/202123204008
[34] Prajanti, S.D.W. (2014). Strategy for controlling agriculture land conversion of paddy by using analytical hierarchy process in Central Java. Management of Environmental Quality: An International Journal, https://doi.org/10.1108/MEQ-07-2013-0080
[35] Sumarsono, B., Hidayat, M.F. (2021). Interaksi Aktor dalam Perlindungan Lahan Pertanian Pangan Berkelanjutan di Kabupaten Hulu Sungai Selatan. Jurnal Pertanahan, 11(2).
[36] Arsyad, S., Rustiadi, E. (Eds.). (2008). Penyelamatan Tanah, Air, Dan Lingkungan.
[37] Fathurrakhman, J., Sudarmi, S., Miswar, D. (2016). Analisis Perubahan Penggunaan Lahan Sawah Menjadi Permukiman di Kabupaten Pringsewu Tahun 2012-2014. JPG (Jurnal Penelitian Geografi), 4(1).
[38] Miswar, D., Sugiyanta, I.G., Yasta, R.D. (2020). Analisis Geospasial Perubahan Penggunaan Lahan Sawah Berbasis LP2B Kecamatan Pagelaran Utara. Media Komunikasi Geografi, 21(2): 130-143. http://dx.doi.org/10.23887/mkg.v21i2.27760
[39] Drummond, M.A., Auch, R.F., Karstensen, K.A., Sayler, K.L., Taylor, J.L., Loveland, T.R. (2012). Land change variability and human–environment dynamics in the United States Great Plains. Land Use Policy, 29(3): 710-723. https://doi.org/10.1016/j.landusepol.2011.11.007
[40] Hossain, M.S., Das, N.G. (2010). GIS-based multi-criteria evaluation to land suitability modelling for giant prawn (Macrobrachium rosenbergii) farming in Companigonj Upazila of Noakhali. Bangladesh, Computers and electronics in agriculture, 70(1): 172-186. https://doi.org/10.1016/j.compag.2009.10.003
[41] Zolekar, R.B., Bhagat, V.S. (2015). Multi-criteria land suitability analysis for agriculture in hilly zone: Remote sensing and GIS approach. Computers and Electronics in Agriculture, 118: 300-321. https://doi.org/10.1016/j.compag.2015.09.016
[42] Pettorelli, N., Laurance, W.F., O'Brien, T.G., Wegmann, M., Nagendra, H., Turner, W. (2014). Satellite remote sensing for applied ecologists: opportunities and challenges. Journal of Applied Ecology, 51(4): 839-848. https://doi.org/10.1111/1365-2664.12261
[43] Syafitri, R. (2018). Pemodelan Penentuan Lahan Pengganti LP2B (Lahan Pertanian Pangan Berkelanjutan) Berdasarkan Proyeksi Perubahan Lahan Pertanian di Kabupaten Karanganyar (Doctoral dissertation, Institut Teknologi Sepuluh Nopember). https://repository.its.ac.id/55564/, accessed on Dec 2020.
[44] Arham, I. (2019). Perencanaan Pembangunan Desa Pertanian Berkelanjutan Berbasis Citra Drone (Studi Kasus Desa Sukadamai Kabupaten Bogor).
[45] Riqqi, A., Taradini, J., Effendi, A. (2018). Pemodelan Kualitas Informasi Geospasial Dasar Di Indonesia. Geomatika, 24(1): 13-20. http://dx.doi.org/10.24895/JIG.2018.24-1.773
[46] Sutrisno, A., Wahyuni, E., Titing, D. (2021). Daya Dukung Lingkungan Daerah Aliran Sungai Kayan dan Sembakung Kalimantan Utara Dalam Penyediaan Pangan dan Air. Environmental Science, 235527488.
[47] Sari, M., Fatma, F., Purba, T., Bachtiar, E., NNPS, R.I.N., Simarmata, M.M., Affandy, N.A., Chaerul, M., Rosyidah, M., Kharisma, D., Purba, B., Manullang, S.O., Nurdin, N. (2021). Pengetahuan lingkungan. Yayasan Kita Menulis.
[48] Huntington, J.L., Niswonger, R.G. (2012). Role of surface‐water and groundwater interactions on projected summertime streamflow in snow dominated regions. An integrated modeling approach, Water Resources Research. 48(11). https://doi.org/10.1029/2012WR012319
[49] Harvey, J., Gooseff, M. (2015). River corridor science: Hydrologic exchange and ecological consequences from bedforms to basins. Water Resources Research, 51(9): 6893-6922. https://doi.org/10.1002/2015WR017617
[50] Muliasari, A., Wahyuningsih, L. (2013). Simulasi Perancangan Drainase Muka Tanah pada Bandar Udara Achmad Yani Semarang Sebagai Salah Satu Usaha Pencegahan Banjir. Warta Ardhia, 39(4): 305-316. https://dx.doi.org/10.25104/wa.v39i4.127.305-316
[51] Krey, K. (2019). Kasuri Block High Conservation.
[52] Maryono, A. (2020). Menangani Banjir, Kekeringan dan Lingkungan.
[53] Haines-Young, R., Potschin, M. (2010). The links between biodiversity, ecosystem services and human well-being. Ecosystem Ecology, a new synthesis. 1: 110-139. http://dx.doi.org/10.1017/CBO9780511750458.007
[54] Mulawarman, A., Paddiyatu, N., Sumarni, B. (2019). Daya dukung ketersediaan air dan pangan di Kecamatan Sukamaju. Jurnal Linears, 2(2): 92-99. https://doi.org/10.26618/j-linears.v2i2.3126
[55] Kløve, B., Ala-Aho, P., Bertrand, G., Boukalova, Z., Ertürk, A., Goldscheider, N., Widerlund, (2011). A. Groundwater dependent ecosystems. Part I: Hydroecological status and trends, Environmental Science & Policy, 14(7): 770-781. https://doi.org/10.1016/j.envsci.2011.04.002
[56] David, R., Pyne, G. (2017). Groundwater Recharge and Wells: A Guide to Aquifer Storage Recovery.
[57] Hecht, S.B., Cockburn, A. (2011). The Fate of the Forest.
[58] Fischer, G., Nachtergaele, F.O., van Velthuizen, H., Chiozza, F., Francheschini, G., Henry, M., Tramberend, S. (2021). Global Agro-ecological Zones (GAEZ v4)-Model Documentation.
[59] Hoffmann, I. (2010). Climate change and the characterization, breeding and conservation of animal genetic resources. Animal genetics, 41: 32-46. https://doi.org/10.1111/j.1365-2052.2010.02043.x
[60] Purwanto, Y.O.H.A.N.E.S. (2020). Penerapan Data Etnobiologi Sebagai Wahana Mendukung Pengelo-laan Sumber Daya Hayati Bahan Pangan Secara Berkelanjutan. In Prosiding Seminar Nasional Masyarakat Biodiversitas Indonesia, 6(1): 470-483. http://dx.doi.org/10.13057/psnmbi/m060128
[61] Neumann, B. (2019). Stripped Down: Extractive Industries, Cultural Ecosystem Services and Environmental Identity in West Virginia. State University of New York College of Environmental Science and Forestry ProQuest, 2907374.
[62] Palm, C., Blanco-Canqui, H., DeClerck, F., Gatere, L., Grace, P. (2014). Conservation agriculture and ecosystem services: An overview Agriculture. Ecosystems & Environment, 187: 87-105. https://doi.org/10.1016/j.agee.2013.10.010
[63] Rolando, J.L., Turin, C., Ramírez, D.A., Mares, V., Monerris, J., Quiroz, R. (2017). Key ecosystem services and ecological intensification of agriculture in the tropical high-Andean Puna as affected by land-use and climate changes. Agriculture, Ecosystems & Environment, 236: 221-233. https://doi.org/10.1016/j.agee.2016.12.010
[64] Kristiandi, K., Simarmata, M.M., Sagala, D., Afriani, A., Riyanto, R., Melani, D., Ruwaida, I.P. (2021). Ekologi Pertanian.
[65] Gurnell, A. (2014). Plants as river system engineers. Earth Surface Processes and Landforms, 39(1): 4-25. https://doi.org/10.1002/esp.3397
[66] Mardiatno, D., Marfai, M.A. (2021). Analisis Bencana Untuk Pengelolaan Daerah Aliran Sungai (das): Studi Kasus Kawasan Hulu das Comal.
[67] Wajdi, R. (2021). Daya Dukung dan Daya Tampung Lingkungan Hidup Berbasis Jasa Ekosistem di Kawasan Cekungan Bandung. Prosiding FTSP Series 2: 904-915.
[68] Dominati, E., Patterson, M., Mackay, A. (2010). A framework for classifying and quantifying the natural capital and ecosystem services of soils. Ecological economics, 69(9): 1858-1868. https://doi.org/10.1016/j.ecolecon.2010.05.002
[69] Maltby, E., Ormerod, S., Acreman, M., Dunbar, M., Jenkins, A., Maberly, S., Ward, R. (2011). Freshwaters. openwaters, wetlands and floodplains [chapter 9].
[70] Summers, J.K., Smith, L.M., Case, J.L., Linthurst, R.A. (2012). A review of the elements of human well-being with an emphasis on the contribution of ecosystem services. Ambio, 41(4): 327-340. https://doi.org/10.1007/s13280-012-0256-7
[71] Dirman, E.N., Saleng, A., Sapiddin, A.S.A. (2018). Food agriculture land legal protection to improve food security in Indonesia. Earth and Environmental Science, 196(1): 012047. https://doi.org/10.1088/1755-1315/196/1/012047
[72] Miswar, D., Salsabilla, A., Yarmaidi, Y., Susanti, E., Aryati, F. (2021). Study of Sustainable agriculture (LP2B) Using Spatial Approach South Pringsewu District. International Journal of Multicultural and Multireligious Understanding, 8(12): 74-86. http://dx.doi.org/10.18415/ijmmu.v8i12.3176
[73] Febrianto, F. (2017). Daya Dukung Lingkungan Berbasis Ecological FootPrint di Kelurahan Tamangapa Kota Makassar (Doctoral dissertation, Universitas Islam Negeri Alauddin Makassar).
[74] Sinery, A.S. (2019). Daya Dukung dan Daya Tampung Lingkungan.
[75] Ali, A.A. (2017). Analisis Daya Dukung Lahan Dalam Mengendalikan Pertumbuhan Penggunaan Lahan Untuk Bangunan Di Wilayah Perkotaan. Simposium II UNIID, 2(1): 219-228.
[76] Widodo, B.S., Ibrahim, M.H., Yani, M.T., Prabawati, I., Segara, N.B. (2022). Assessing survival factors of rice farmers in the flood-Prone area: A case study in Bojonegoro district, Indonesia. GeoJournal of Tourism & Geosites, 42. https://doi.org/10.30892/gtg.422spl19-890
[77] Roberts, P. (2000). The evolution, definition and purpose of urban regeneration. Urban regeneration, 9-36. http://digital.casalini.it/9781473906174
[78] Sumual, F.S., Waani, J.O., Siregar, F.O. (2018). Analisis Perubahan Fisik Kawasan Koridor Jalan Boulevard Ii Pasca Operasional Jalan. Spasial, 5(1): 21-31. https://doi.org/10.35793/sp.v5i1.18935
[79] Widodo, S. (1998). Farming system approach for sustainable agriculture. Agro Ekonomi (Indonesia), 5(1): 1-6.
[80] Rotz, C.A. (2004). The integrated farm system model: A tool for developing more economically and environmentally sustainable farming systems for the Northeast. The American Society of Agricultural and Biological Engineers, NABEC-04-0022 https://doi.org/ 10.13031/2013.16116
[81] Riptanti, E.W., Masyhuri, Irham, Suryantini, A. (2022). The sustainability model of dryland farming in food-insecure regions: Structural Equation Modeling (SEM) approach. International Journal of Sustainable Development and Planning, 17(7): 2033-2043. https://doi.org/10.18280/ijsdp.170704.
[82] Basso, B., Antle, J. (2020). Digital agriculture to design sustainable agricultural systems. Nature Sustainability, 3(4): 254-256. https://doi.org/10.1038/s41893-020-0510-0
[83] Delgado, J.A., Short Jr, N.M., Roberts, D.P., Vandenberg, B. (2019). Big data analysis for sustainable agriculture on a geospatial cloud framework. Frontiers in Sustainable Food Systems, 3: 54. https://doi.org/10.3389/fsufs.2019.00054
[84] Ennaji, W., Barakat, A., El Baghdadi, M., Oumenskou, H., Aadraoui, M., Karroum, L.A., Hilali, A. (2018). GIS-based multi-criteria land suitability analysis for sustainable agriculture in the northeast area of Tadla plain (Morocco). Journal of Earth System Science, 127(6): 1-14. https://doi.org/10.1007/s12040-018-0980-x
[85] Khan, N.; Ray, R.L.; Sargani, G.R.; Ihtisham, M.; Khayyam, M.; Ismail, S. (2021). Current progress and future prospects of agriculture technology: Gateway to sustainable agriculture. Sustainability, 13: 4883. https://doi.org/10.3390/ su13094883
[86] Sayed, Y.A., Fadl, M.E. (2021). Agricultural sustainability evaluation of the new reclaimed soils at Dairut Area, Assiut, Egypt using GIS modeling. The Egyptian Journal of Remote Sensing and Space Science, 24(3): 707-719. https://doi.org/10.1016/j.ejrs.2021.08.002
[87] Rose, D.C., Sutherland, W.J., Barnes, A.P., Borthwick, F., Ffoulkes, C., Hall, C., Moorby, I.M., Nicholas-Davies, P., Twining, S., Dicks, L.V. (2019). Integrated farm management for sustainable agriculture: Lessons for knowledge exchange and policy. Land use policy, 81: 834-842. https://doi.org/10.1016/j.landusepol.2018.11.001
[88] Kumar, A., Pramanik, M., Chaudhary, S., Negi, M.S. (2021). Land evaluation for sustainable development of Himalayan agriculture using RS-GIS in conjunction with analytic hierarchy process and frequency ratio. Journal of the Saudi Society of Agricultural Sciences, 20(1): 1-17. https://doi.org/10.1016/j.jssas.2020.10.001
[89] Croitoru, A.E., Man, T.C., Vâtcă, S.D., Kobulniczky, B., Stoian, V. (2020). Refining the spatial scale for maize crop Agro-Climatological suitability conditions in a region with complex topography towards a smart and sustainable agriculture. Case study: Central Romania (Cluj County). Sustainability, 12(7): 2783. http://dx.doi.org/10.3390/su12072783
[90] Taghizadeh-Mehrjardi, R., Nabiollahi, K., Rasoli, L., Kerry, R., Scholten, T. (2020). Land suitability assessment and agricultural production sustainability using machine learning models. Agronomy, 10(4): 573. http://dx.doi.org/10.3390/agronomy10040573
[91] Jurjević, Ž., Bogićević, I., Đokić, D., Matkovski, B. (2019). Information technology as a factor of sustainable development of Serbian agriculture. Strategic management, 24(1): 41-46. http://dx.doi.org/10.5937/StraMan1901041J
[92] Saiz-Rubio, V., Rovira-Más, F. (2020). From smart farming towards agriculture 5.0: A review on crop data management. Agronomy, 10(2): 207. http://dx.doi.org/10.3390/agronomy10020207