Ghadeer Jamal Hasham | Majeed Mattar Ramal*
© 2022 IIETA. This article is published by IIETA and is licensed under the CC BY 4.0 license (http://creativecommons.org/licenses/by/4.0/).
OPEN ACCESS
The main objective of this research is an examination of the applicability of the QUAL2K mathematical model on large rivers like the Euphrates, and it is the first study of its kind conducted on this important section within Fallujah Euphrates Reach (FER), using this model for the purpose of evaluating the quality of water and creating a database to predict the quality of river. The tests were conducted during January and April of 2022, where they were calibrated and verified for DO and CBOD5 at a distance of 12.86 km. Google Earth pro and Arc-GIS were utilized to provide certain data as input into the QUAL2K model. The model was calibrated in January using the trial-and-error technique, and the verification was completed in April using the model calibration parameters. For the purposes of evaluating the model's performance, statistical measures such as mean absolute error (MAE), root mean square error (RMSE), and relative error (RE) were used. In addition, three different scenarios were applied (pollution load modification, flow augmentation for point sources, and flow augmentation for headwater) to improve the water quality of Euphrates river. The results show that the difference between observed and anticipated values had a relatively small error percentage, which means that this mathematical model can be applied to this important section of the river. While the concentration of DO was within the permissible limits to perpetuate aquatic life and maintain the ecological health of the river, the concentration of CBOD5 was also within the limits in some locations. In addition, the scenario represented by modifying the pollution loads represented by BOD5 for sewage water were effective in raising the concentration of DO in the river, while increasing point sources discharge and headwater flow does not yield meaningful results.
water quality, Modeling, QUAL2K model Dissolved Oxygen, BOD5
For decades, water resource management has gained a priority in public policy, and much work has gone into establishing efficient water management techniques to assure enough exceptional quality water [1, 2]. Urbanization, industrialization, and agriculture have all contributed to a significant increase in the demand for natural resources as the world's population grows [3]. The direct repercussions concern the amount and quality of fresh water available for human consumption. Due to issues with water resources, it is necessary to increase management measures, research, and monitoring in order to guarantee that they are managed effectively [4, 5]. The discharge of biodegradable waste into bodies of water reduces water quality in general and DO (dissolved oxygen) concentrations in particular [6]. In many poor nations, industrial waste dumping into urban and agricultural areas with no treatment before disposal is a prevalent practice [7].
Water quality simulation is critical for mastering the variation law of contaminants in water bodies, reducing the danger of water pollution and loss, and ensuring the safety and environmental quality of water [8, 9]. Water quality model research is mostly conducted in Europe and other industrialized nations, where the model's theoretical base and applied research are well established [10-12].
Changes in wastewater discharges can be predicted using mathematical models [13, 14]. They are frequently used to set priorities for reducing existing wastewater discharges or forecast the effects of a planned new release. It has become an easy technique to analyze the kinematics of river systems thanks to the use of mathematical equations and modern computer technology. Modeling is a scientific activity that can provide personalized answers by discovering a number of configurations. This, in turn, offers up an unlimited number of opportunities for integrating, analyzing, and assessing complex water quality concerns, leading planners, managers, and outcome to take immediate action to remove pollutants and operate watersheds in a detailed and scientific manner [15, 16]. Mathematical models are a means to represent relationships between water bodies and waste loads, as well as the concentration of each pollutant as a result of the properties of the receiving water body [17]. There are several types of water quality models, such as WASP, HEC-RAS, QUASAR, QUAL2K, SWAT, MIKE 11, SIMCAT, QUAL2KW, QUAL2E, and AQUATOX. Choosing any of these models depends on several criteria, such as data accessibility, simulation abilities for water quality, the intricacy of the model, waterbody type, the availability of a good model certification, and simple access to the source code of the software. In addition to the extent of the popular use of the model and its ease of application, taking into account the cost factor [18]. The QUAL2K model will be used to mimic the goodness of the River Euphrates water within Fallujah city in this research. The QUAL2K is an advanced version of the QUAL2E. The US Environmental Protection Agency (USEPA) provided QUAL2K in 2007, this model depends in its work on differential equations and deals with constant and non-uniform flow in addition to being one -dimensional (one direction). The QUAL2K model is useful for simulating stream water quality and diffuse loads as well as hydrological conditions. In order to address the shortcomings of QUAL2E, Park and Lee created QUAL2K. QUAL2K has a lot of additional features: It's beneficial in data-constrained situations, it's free, and it's not just for big rivers [5].
Several investigations on the quality of river water have been conducted. Such as in study [19] they used of the QUAL2K model to simulate the quality of water of the Garger river. In addition to the hydrological characteristics, the case study located to the north of Shoushtar city (Iran) determined the quality parameters of water and the hydraulically parameters represented by the river flow and point sources. Despite the absence of data, the findings indicated that the model is the most responsive to river flows. In another study, the potential of QUAL2K mathematical model used to the lower part of Diyala river, located on the Tigris river, to simulate the biological demand for oxygen (BOD5) and dissolved oxygen (DO) [20]. The trial-and-error approach was used to calibrate the model, while its performance was evaluated by adopting statistical criteria for relative error (RE), root mean square error (RMSE) and mean absolute error (MAE). The results indicated that the model's projected values matched the values of observed data in the research laboratories and in the field, and that DO and BOD concentrations were higher than the allowed limit for sustaining aquatic life in the river. Therefore, several scenarios were used to maintain water quality standards within the permissible level. Examining the chemical as well as physical characteristics of water samples and utilizing the digital elevation model (DEM) to acquire hydraulic parameters as key inputs to QUAL2K model to estimate the quality of river water were used to analyze the water quality of the Likas river. The findings revealed that industrial pollution discharged from nearby residential areas, as well as a high concentration of the 5-day Biochemical Oxygen Demand, have an impact on river water quality (BOD5) [21].
The importance of this research is evident from the important geographical location of this section, as it is a major source that supplies water to one of the most important and large cities in the Iraqi Anbar Governorate, which is the city of Fallujah, which is characterized by its dense population, especially in the extension beyond the Saqlawiyah bridge. So it is necessary to pay attention to the quality of the water available in this section. In the absence of monthly checks and periodic water monitoring in this section, due to the high cost of the tests and their taking a long time, it is preferable to use mathematical models for the purpose of determining the characteristics of water quality instead of laboratory tests, which provide important environmental prospects. In this study, we shall use a one-dimensional mathematical model with steady flow called the QUAL2K model. Water samples were tested during January and March for the purpose of evaluating the water quality for this reach. The obtained results will be applied to samples that were tested to assess the environmental impacts of the waste water discharged from rainwater disposal plants in the Euphrates River. This is the first study conducted on the Euphrates River in which the QUAL2K model is applied. The physio-chemical properties of the river and stations are inputs for this model, while the hydro-geometric data is provided by using the Arc-GIS technique and Google Earth as assisting instruments.
2.1 Study area
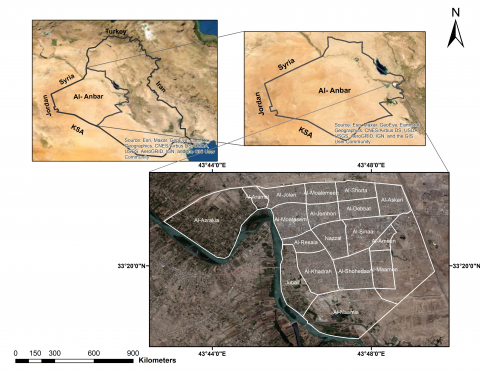
The Euphrates River, which has five major tributaries, is one of Iraq's longest lasting rivers [22]. However, there are no tributaries within Iraq. The river travels from Turkey's eastern highlands, via Syria, and into Iraqi territory from the middle western section, where it flows westward to the central region of Iraq, where it meets the Tigris River [23]. The Euphrates River Basin covers about 440,000 km2, with 22 percent in Syria, 28 percent in Turkey, and 47 percent in Iraq. Five dams were built on the Euphrates River in Turkey (Karkamis dam, Birecik dam, Karakaya dam, Keban dam, and Ataturk dam), three in Syria (Tabba dam, Tishreen dam, and Al Baath dam), and Haditha-Dam in Iraq [24-26]. The Euphrates river enters Iraqi territory from Al-Qaim city (west Anbar) and flows through the Anbar governorate, crossing the Syrian border. It is a vital supply of water for the city of Fallujah (study area), which is one of the governorate of Anbar's biggest cities, which is about 47 km east of Ramadi and about 60 km west of the Iraqi capital, Baghdad [27, 28]. As illustrated in Figure 1, Fallujah city is situated in the northern hemisphere's middle latitudes (33° 21' 09"–33° 17' 47") and longitudes (43° 44' 58"–43° 49' 33"). Euphrates river water was used for agricultural and industrial purposes, in addition to its use as a drain for sewage and rainwater, especially in the winter months. The DO and BOD concentrations were modeled using this reach (FER), which is 12.86 kilometers long. The study area is characterized by a dry desert climate with high temperatures in summer and little rain in winter because it is located between the two rain lines (100-150 mm). The surface water quality of Iraq region has received much attention by the interested researchers [29, 30], and this bring the interest of the current research for an investigation of the water quality evaluation.
Figure 1. Study area with Sampling location
2.2 GIs technique and google earth pro
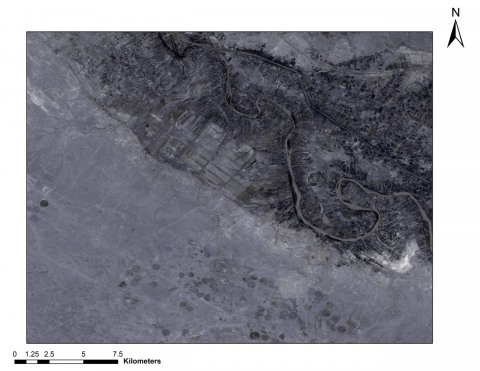
A satellite image for Landsat 8 OLI (2020) was corrected by using Arc-GIS 10.8, which has been used in this research as shown in Figure 2. Google Earth Pro is a software program that can display a two [2D] and three [3D] dimensional image for earth's surface. In comparison to other views of the Earth's surface [31]. It is used to calculate geographical data such as longitude and latitude, as well as segment length, river width, side slope, and channel slope, which are linked together in the QUAL2K model to get the result.
Figure 2. Satellite images of Fallujah city from Landsat 8-OLI (2020) corrected by used Arc-GIS 10.8
2.3 Sampling and analysis
Water samples were taken from four locations at various distances along the river, using the procedure of dipping the cleaned and prepared plastic bottles at a depth of around 30 cm. The velocity of the water at the main river's headwaters was measured using a current velocity meter. We applied the theory of areas of open channel velocity because this device is designed based on this theory. The velocity is calculated by using this device, while the area of the cross section is calculated by measuring the distance using the metric bar, while depth is measured by using a small handheld device called the LCD DIGITAL SOUNDER (HONDEX PS-7). Whereas, the discharge of point sources were calculated from knowing the actual number of operating hours for each pump. All of the analysis was carried out using the procedures outlined in (APHA, 1998) as shown in Table 1. The bottles were maintained at +4℃ for 24 hours before being examined. The samples were analyzed at the Large Ramadi water project's quality control laboratory.
Table 1. Analytical approach for DO and BOD5
|
Parameters |
Unit |
Instrument |
|
DO |
mg/L |
Lovibond Senso direct |
|
BOD5 |
mg/L |
Oxi direct device |
2.4 Meteorological data
The meteorological data used for the purpose of calibration and validation of the model includes air temperature, wind speed, Dew point temperature, cloud cover and shade, and they were all obtained from the weather station in Ramadi city over a period of 24 hours as shown in Table 2. As for the variable called the shade, it represents the amount of sunlight blocked from the surface of the earth, represent the percentage of vegetation cover along the study section. The percentage of plant cover on both banks of the river was estimated at a moderate rate of up to 35%.
Table 2. Input Meteorological data (From the weather station in the city of Ramadi for January and March)
|
Month |
Air temperature (℃) |
Wind speed (m/sec) |
Cloud cover % |
Dew point temperature (℃) |
Shade % |
|
January |
13.5 |
11.11 |
50 |
8.5 |
35 |
|
April |
16.28 |
8 |
20 |
5 |
35 |
Nakhaei and Shahidi used QUAL2K, which is a mathematical model belonging to the US Environmental Protection Agency, was applied to the Zayandehrood River, one of the largest rivers in Iran and the Middle East, to assess the water quality and predict the water quality of the river in the future, as well as simulate the concentration of DO and BOD in river water, because this river suffers from pollution because it represents industrial waste dump, which causes a lack of dissolved oxygen (DO). Therefore, several scenarios were applied to improve water quality, including a 20% increase in wastewater loads, which is a reasonable increase owing to population growth and industrialization, and the addition of the 7Weir, to increase the concentration of dissolved oxygen and improve water quality in the future. The calibration and verification results demonstrated that the Qual2k model has high reliability in matching its results with measured data in the field, and the application of the critical scenario, adding 7 weirs, helped to increase the concentration of dissolved oxygen in the downstream for industrial waste above 5 mg/L [32]. While Ismail and Abed validated and calibrated for BOD and DO profiles of the Tigris River throughout a 49.97-kilometer span by using the QUAL2K model. The hydro-geometric data was obtained using the Arc-GIS software, as well as the remote sensing technique, and the modeling used these data as inputs. The findings show that the simulation values are in complete agreement with the observed values, as the modeling results show that the dissolved oxygen concentration in the river is not less than 4 mg/L, while the concentration of BOD varies across three reaches, but its concentration exceeds 4 mg/l only in Reach three, and a two-strategy was suggested to keep BOD concentration within these limits. Firstly, assuming that the BOD concentration of industrial effluent should not exceed 50 mg/L, while the area that suffers from high pollution in the river is downstream because it is an industrial waste dump. The first strategy is enough to maintain the concentration of CBOD within the permissible limits of not exceeding 4 mg/L, but the second strategy did not give feasible results, as the concentration of CBOD increases even with reduced water discharge at the headwater [33].
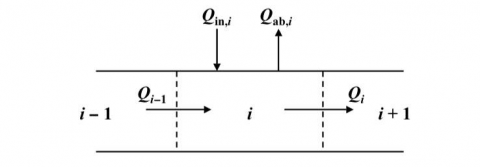
Greg Pelletier and Steve Chapra created QUAL2K, a one-dimensional computer model for modeling river and stream water quality, which was first launched in 1987 [34]. The US Environmental Protection Agency (USEPA) created the QUAL2K framework, it is capable of simulating the movement and alteration of typical pollutants. The stream is modeled as a one-dimensional channel and with a non-uniformity steady flow, and pollution loads from both point and non-point sources are taken into consideration [35]. In additionally to being widely employed in big rivers for environmental control, the framework model contains various novel elements that make it appropriate for highland, shallow, and other rivers [10]. Water quality models grew increasingly complicated as time went on, combining diverse transformation and transport mechanisms to represent ecohydrological events in rivers [36]. Finally, the use of mathematical models and sophisticated computer technologies has made studying the dynamics of river systems a simple process. So modeling is a scientific activity that can provide personalized answers by discovering a number of configurations. This, in turn, opens up infinite possibilities for integrating, analyzing, and evaluating complex water quality issues, guiding planners, policymakers, and decision makers to take immediate action to minimize pollution and Water systems should be managed in a more scientific and thorough way [15]. The river is split into multiple reaches in the QUAL2K model, each reach is broken down into parts as shown in Figure 3. These are the shortest simulation segments in the model [37]. QUAL2K is a version of QUAL2E that has been upgraded. Brown [38], and the two are distinguished by the following characteristics: one-dimensional. In a steady condition, the model deals with the channel as a well-mixed channel in the lateral and vertical directions and in a state of steady non-uniform flow. It takes into account the mainstream and the side tributaries. These two models simulate all variables of water quality, temperature, and a diurnal heat budget. Inputs of heat and mass are used in the model, and the simulation includes both diffuse and point loads, as well as abstractions [37].
One of the most important reasons behind choosing the QUAL2K model for this study is because of:
1-The QUAL2K model has popularity and simplicity of use, with the possibility to apply the trial-and-error method to reduce or eliminate errors that appear in model simulations [10].
2- QUAL2K is a mathematical model used to simulate the water quality of the Euphrates River in the specified section of the study, because the Euphrates River lacks simulation using this model.
3- The model’s ability to simulate a new water quality interaction such as DO shifts generated by fixed plants, denitrification, and transforming dead algal to BOD. QUAL2E's restrictions can be overcome with these added additions [20, 39].
Figure 3. Reach flow balance
$Q_i=Q_{i-1}+Q_{i n, 1}-Q_{a b, i}$ (1)
where, Qa,b,i is the total outflow owing to non-point and point sources from the reach i [m3/day]. Qin,1 is the total inflow of non-point and point sources into the reach i [m3/day]. Qi-1 is the upstream inflow reaching i-1 [m3/day]. Qi is the flow of information from reach i to reach i+1 [m3/day]. After estimating the outflow from each reach, one of the three approaches is used to estimate the velocity and depth: manning equations, rating curves, or weirs.
In this work, each reach is treated in the simulation only as a trapezoidal channel. Under steady-state conditions, the Manning equation can be used to illustrate the relationship between flow with depth as follows:
$Q=\frac{S o^{1 / 2}}{n} \times \frac{A c^{5 / 3}}{P^{2 / 3}}$ (2)
where, Q = Discharge [m3/day]. So = slop at the bottom. n = Coefficient of Manning roughness. P = Wetted perimeter (m). $A_c$ = Cross -section area (m2).
The parameters that can be simulated in this model are dissolved oxygen (DO), temperature, sediment oxygen demand (SOD), pH, nitrate-nitrogen (NO3-N), Carbonaceous Biochemical Oxygen Demand (CBOD5), organic phosphorus (OP), total nitrogen (TN), organic nitrogen (ON), Inorganic Phosphorus (IP), Ammonium Nitrogen (NH4 +-N), Total Phosphorus (TP), bottom algae, phytoplankton, and total nitrogen (TN) [15]. The Qual2k model is characterized by having a general equation for mass balance in order to measure the concentration of the components of the model represented by the following variables: Dissolved oxygen (o), conductivity (s), nitrate nitrogen, inorganic suspended solids, organic nitrogen, organic phosphorus, ammonia nitrogen, fast reacting CBOD5, slow reacting CBOD5, alkalinity (ALK), detritus phytoplankton (X), and bottom algae biomass [37]. The mass balance equation for bottom algae modeling does not include the loading and transport factors [23]. A component's overall mass balance in a reach (Figure 4) is written as:
$\frac{d_{c i}}{d t}=\frac{Q_{i-1}}{V i} C_{i-1}-\frac{Q_i}{V i} C_i-\frac{Q_{a b, i}}{V i} C_i+\frac{E_{i-1}}{V i}\left(C_{i-1}-C_i\right)+$
$\frac{E_i}{V i}\left(C_{i+1}-C_i\right)+\frac{W_i}{V i}+S_i$ (3)
where, Wi = external loading of the component to attain i [g/day ]or [mg/day]; t = time [day]; Ci = the quantity of water quality components in reach i [g/m3]; Ei= between reaches i and i + 1 the bulk dispersion coefficient [m3/day]; Ei-1 = between i-1 and i the bulk dispersion coefficient [m3/day]; Vi = volume of reach i [m3]; Si= sinks and sources of component due to mass transfer processes and reaction [g/m3/day] or [mg/m3/day].
Figure 4. Mass balance for reach i
For a boundary between two reaches, we compute longitudinal dispersion, the QUAL2K used a formula based on the channel’s hydraulics [39].
$E_{p, i}=0.011 \frac{U_{i^2{ }^Bi^2}}{H_i U_i^*}$ (4)
$U_{i^*}=\sqrt{g H_i S_i}$ (5)
where, $E_{p, i}$ = between reaches i and i+1, the longitudinal dispersion; $U_i$ = mean velocity (m/sec); $B_i$ = width of river in the section (m); $H_i$ = depth average (m); $U_i$ = velocity of shear (m/sec); g = Gravitational acceleration and it is equal 9.81 m/ $\mathrm{sec}^2$; $S_i$ = longitudinal channel slope.
The information required by the model: meteorological features (air temperature, wind speed, shade, cloud cover, and dew point), geographical peculiarities (elevation, latitude and longitude), hydraulic characteristic (flow curve, aspects of morphology, Roughness coefficient Manning), physical -chemical and biological parameters for river and waste water.
3.1 Model calibration
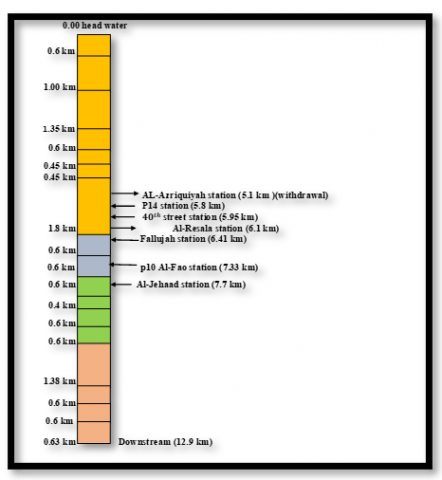
Mathematical model was calibrated by modifying several parameters of model with iterative operations until achieving the best possible agreement between the measured and expected data and reaching the lowest error rate in the BOD5 and DO. The 12.86-length extension was divided from the Saqlawiyah Bridge to Fallujah Dam in four reaches and is divided into smaller parts called "segments" as shown in Figure 5. The data for the month of January was used for the purpose of calibrating the model as it represents a low drain period as shown in Table 3 and the section was considered as a well-mixed one-dimensional channel with a continuous and non-uniform flow points inside the river in the field using portable devices to measure the discharge inside the river, while calculate the discharge of point sources by the rain water drainage stations were based on the pump capacity and the number of operation hours, while the intake stations discharge were measured by based on the diameter of the pipe and the speed of flow. Use Google Earth Pro to calculate the latitude and longitude for each point along the section allocated for study as shown in Table 5. The link between flow and depth was expressed using the Manning equation.
The Euphrates River is also a natural stream channel that has some clear, straight sections and others that are clean, winding, and weedy. Therefore, the value of the manning coefficient is adopted at 0.100 as the river section is an irregular and rough section by adopting Tables 5, 6 values of the Roughness coefficient from open channel hydraulics for [40].
Figure 5. The research region's schematic diagram
Table 3. The input parameters of water quality and flow rate for head water and point sources in January 8/1/2022
|
Distance km |
Discharge /withdrawal |
BOD5 mg/l |
DO mg/l |
Flow $m^3$ /sec |
|
0.00 |
Head water |
4 |
9 |
320 |
|
5.1 |
Al-Azriqyah |
7 |
8 |
9 |
|
5.8 |
$p_{14}$ station |
174 |
1.9 |
0.07109 |
|
5.95 |
$40^{t h}$ street |
149 |
2.1 |
0.00124 |
|
6.1 |
Al-Resala station |
5 |
11 |
1.8 |
|
6.41 |
Fallujah |
180 |
1.3 |
0.00413 |
|
7.33 |
$p_{10}$ Al-Fao |
160 |
1.5 |
0.0330 |
|
7.7 |
Al-Jehaad |
193 |
1.2 |
0.1917 |
3.2 Model validation
Testing of an additional set of data represented by the increase in flow in the Season of high flow or decrease in the Season of low flow and the change in concentration of chemical and physical parameters for rivers and point sources against the calibrated model with the use of the same parameters of the model used when calibrates for the purpose of obtaining a real perception of the water quality in a way that can be used in the future, in this study the data for the month of April was used to verify from the correctness of the model as shown in Table 4.
Table 4. The input parameters of water quality and flow rate for head water and point sources in March 8/3/2022
|
Distance km |
Discharge /withdrawal |
BOD5 mg/l |
DO mg/l |
Flow $m^3$ /sec |
|
0.00 |
Head water |
6 |
8.30 |
335 |
|
5.1 |
Al-Azriqyah |
4 |
8.20 |
11.11 |
|
5.8 |
$p_{14}$ station |
77 |
2 |
0.0486 |
|
5.95 |
$40^{t h}$ street |
240 |
1.50 |
0.0003 |
|
6.1 |
Al-Resala |
2 |
7.10 |
2.2200 |
|
6.41 |
Fallujah |
209 |
2.10 |
0.0038 |
|
7.33 |
$p_{10}$ Al-Fao |
109 |
1.10 |
0.0248 |
|
|
Al-Jehaad |
88 |
1.20 |
0.2096 |
Table 5. Model segmentation, position, and length of each section from Google Earth Pro
|
Reach |
Element |
Downstream location (km) |
Down stream |
|
|
Latitude |
Longitude |
|||
|
1 |
E1 |
0.0 |
$33^0 21^{\prime} 1.70^{\prime \prime}$ |
$43^0 42^{\prime} 39.10^{\prime \prime}$ |
|
E2 |
0.6 |
$33^0 20^{\prime} 50.77^{\prime \prime}$ |
$43^0 42^{\prime} 59.91^{\prime \prime}$ |
|
|
E3 |
1.000 |
$33^0 20^{\prime} 32.20^{\prime \prime}$ |
$43^0 43^{\prime} 31.58^{\prime \prime}$ |
|
|
E4 |
1.350 |
$33^0 20^{\prime} 6.00^{\prime \prime}$ |
$43^0 44^{\prime} 13.75^{\prime \prime}$ |
|
|
E5 |
0.6 |
$33^0 20^{\prime} 19.42^{\prime \prime}$ |
$43^0 44^{\prime} 30.32^{\prime \prime}$ |
|
|
E6 |
0.45 |
$33^0 20^{\prime} 32.70^{\prime \prime}$ |
$43^0 44^{\prime} 36.92^{\prime \prime}$ |
|
|
E7 |
0.45 |
$33^0 20^{\prime} 45.82^{\prime \prime}$ |
$43^0 44^{\prime} 45.73^{\prime \prime}$ |
|
|
E8 |
1.800 |
$33^0 21^{\prime} 5.83^{\prime \prime}$ |
$43^0 45^{\prime} 29.56^{\prime \prime}$ |
|
|
2 |
E9 |
0.6 |
$33^0 20^{\prime} 46.55^{\prime \prime}$ |
$43^0 45^{\prime} 35.88^{\prime \prime}$ |
|
E10 |
0.6 |
$33^0 20^{\prime} 27.30^{\prime \prime}$ |
$43^0 45^{\prime} 38.89^{\prime \prime}$ |
|
|
3 |
E11 |
0.6 |
$33^0 20^{\prime} 8.40^{\prime \prime}$ |
$43^0 45^{\prime} 39.78^{\prime \prime}$ |
|
E12 |
0.4 |
$33^0 19^{\prime} 55.11^{\prime \prime}$ |
$43^0 45^{\prime} 39.58^{\prime \prime}$ |
|
|
E13 |
0.6 |
$33^0 19^{\prime} 35.14^{\prime \prime}$ |
$43^0 45^{\prime} 39.36^{\prime \prime}$ |
|
|
E14 |
0.6 |
$33^0 19^{\prime} 14.99^{\prime \prime}$ |
$43^0 45^{\prime} 40.49^{\prime \prime}$ |
|
|
4 |
E15 |
1.380 |
$33^0 18^{\prime} 39.77^{\prime \prime}$ |
$43^0 46^{\prime} 10.03^{\prime \prime}$ |
|
E16 |
0.6 |
$33^0 18^{\prime} 25.64^{\prime \prime}$ |
$43^0 46^{\prime} 26.59^{\prime \prime}$ |
|
|
E17 |
0.6 |
$33^0 18^{\prime} 14.11^{\prime \prime}$ |
$43^0 46^{\prime} 45.62^{\prime \prime}$ |
|
|
E18 |
0.630 |
$33^0 18^{\prime} 9.41^{\prime \prime}$ |
$43^0 47^{\prime} 9.27^{\prime \prime}$ |
|
Table 6. Elevation and Manning formula parameters for each segment from FER as input in QUAL2K
|
Element |
Elevation |
Manning formula |
||||
|
Upstream (m) |
Down stream (m) |
Width (m) |
Side slope |
Channel slope |
||
|
Left |
Right |
|||||
|
E1 |
- |
42.03 |
170 |
0.0163 |
0.027 |
0.0022 |
|
E2 |
42.03 |
41.9 |
202 |
0.0052 |
0.00583 |
0.00021 |
|
E3 |
41.9 |
41.2 |
311 |
0.0548 |
0.0034 |
0.0007 |
|
E4 |
41.2 |
40.72 |
167 |
0.0243 |
0.00315 |
0.00035 |
|
E5 |
40.72 |
39.9 |
117 |
0.0313 |
0.01125 |
0.00136 |
|
E6 |
39.9 |
39.73 |
145 |
0.0218 |
0.0363 |
0.00037 |
|
E7 |
39.73 |
39.69 |
240 |
0.0014 |
0.0228 |
0.00008 |
|
E8 |
39.69 |
39.5 |
90 |
0.0457 |
0.00226 |
0.00010 |
|
E9 |
39.5 |
39.4 |
263 |
0.0344 |
0.0056 |
0.00016 |
|
E10 |
39.4 |
39.37 |
259 |
0.067 |
0.0195 |
0.00036 |
|
E11 |
39.37 |
39.29 |
191 |
0.0283 |
0.0838 |
0.0002 |
|
E12 |
39.29 |
39.15 |
153 |
0.040 |
0.00142 |
0.00035 |
|
E13 |
39.15 |
39 |
159 |
0.00125 |
0.0067 |
0.00025 |
|
E14 |
39 |
38.65 |
291 |
0.02 |
0.0112 |
0.00058 |
|
E15 |
38.65 |
38.5 |
275 |
0.00714 |
0.00067 |
0.00010 |
|
E16 |
38.5 |
38 |
209 |
0.0064 |
0.0076 |
0.00833 |
|
E17 |
38 |
37.7 |
112 |
0.0044 |
0.0061 |
0.0005 |
|
E18 |
37.7 |
37.5 |
156 |
0.048 |
0.0078 |
0.00031 |
3.3 System parameters
QUAL2K has most of the options set to default. The user's handbook for QUAL2K. included some of the model rate settings that were needed [36]. To calculate reaeration coefficient for the Euphrates river (FER) we applied O'Connor-Dobbins formula [41, 42], as shown in Table 7.
$K_a(20)=3.93 \frac{U^{0.5}}{H^{1.5}}$ (6)
Table 7. The model parameter which is considered as input for QUAL2K model [20]
|
parameter |
Units |
Symbol |
Range |
Calibrated |
|
Stoichiometry |
||||
|
Carbon |
mgC |
gC |
- |
40 |
|
Nitrogen |
mgN |
gN |
- |
7.2 |
|
Phosphorus |
mgP |
gP |
- |
1 |
|
Dry weight |
mgD |
gD |
- |
100 |
|
Chlorophy II |
mgA |
gA |
- |
1 |
|
Oxygen |
||||
|
Reaeration model |
- |
- |
O’Connor -Dobbins |
|
|
Temperature correction |
- |
$\theta_a$ |
- |
1.024 |
|
$O_2$ for carbon oxidation |
gO2/gC |
roc |
- |
2.46 |
|
$O_2$ for $\mathrm{NH}_4$ nitrification |
gO2/gN |
ron |
- |
4.7 |
|
CBOD |
||||
|
CBOD hydrolysis rate |
1/d |
khc |
0.04-4.2 * |
2.6 |
|
CBOD Oxidation rate |
1/d |
kdc |
0.04-4.2 * |
0.006 |
4.1 Model calibration and validation
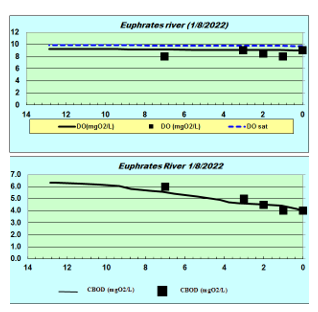
Figures 6 and 7, respectively, demonstrate the outcomes of the model's CBOD5 and DO predictions for calibration and validation.
After obtaining the final calibration and validation results, the mathematical model's performance was assessed using three statistical criteria: Relative Error (RE), Root Mean Square Error (RMSE), and Mean Absolute Error (MAE) to calculate the amount of error between observed and predicted water quality parameter values. The equations of statistical indicators are shown below [43]:
$\mathrm{RE}=100 * \frac{1}{N} \sum_{i=1}^N\left|\frac{X_{i \text { exp }}-X_i \text { pred }}{X_{i \exp }}\right|$ (7)
MAE $=\frac{1}{N} \sum_{i=1}^N\left|X_{i \text { exp }}-X_{i \text { pred }}\right|$ (8)
$\mathbf{R M S E}=\sqrt{\frac{1}{N} \sum_{i=1}^N\left(X_{i \exp }-X_{i \text { pred }}\right)^2}$ (9)
where: $X_{i \exp }$ = The observed values, $X_{i \text { pred }}=$ =The predicted values, N=Number of predicted and observed data [44].
For both calibration and verification, the difference between expected and observed DO and CBOD values was computed, as indicated in Table 8.
Figure 6. Simulated DO and CBOD along FER of Euphrates river for model calibration in January, 2022
Table 8. DO and CBOD error values for model calibration and validation
|
parameter |
DO (mg/L) |
CBOD (mg/L) |
||
|
Calibration |
Validation |
Calibration |
Validation |
|
|
MAE |
0.572 |
0.324 |
0.494 |
0.592 |
|
RMSE |
0.74224 |
0.412408 |
0.698241 |
0.764408 |
|
RE |
6.729412 |
3.785047 |
10.51064 |
10.2069 |
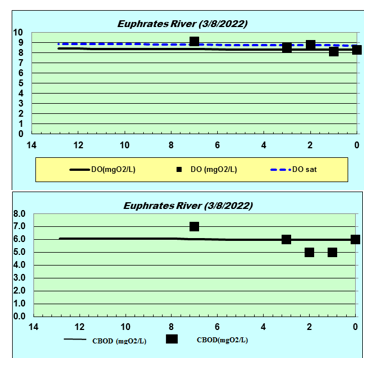
Figure 7. Simulated DO and CBOD along FER of Euphrates river for model validation in April, 2022
The RE result revealed that the predicted and measured values for both the DO and the BOD are in good agreement, and the difference is very small between the calibration and validation values based on MAE and RMSE, meaning that the error rate is small and it is within the acceptable limits. This suggests that the mathematical model may be used to anticipate the Euphrates river's water quality, which is a useful tool.
From outputs of modeling Figure 6, the total DO concentrations in the river meet the acceptable quality limits for the sustainability of the fishery. DO concentrations must be equal to or more than 4 mg/L [37, 38].
It can be seen that the concentration of BOD 5 in the Euphrates river can be divided into three reaches in the case of BOD 5. The first reach stretches along the river's flow from Saqlawiyah Bridge (0 km) to a distance of 1 km. We note that the concentration of $\mathrm{BOD}_5$ was within the permissible level not to exceed 4 mg/L [45]. The second reach extends from 1 km to 3 km. At present, there is an increase in the concentration of $\mathrm{BOD}_5$, which may be caused by water pollution from the areas adjacent to the two banks of the river because they are areas that have been exploited by the population for the purposes of living, especially at a distance of 3 km, where the right bank of the river is densely populated, thus throwing waste into the river. The river's third reach, which stretches from 3 to 7 kilometers, notes a high gradual rise in the concentration of $\mathrm{BOD}_5$, where the concentration reached 6 mg/L at 7 km, which exceeds the permissible limit of 4 mg/L, and this may caused by the effect of point sources thrown into the river without treatment.
From the outputs of the model as shown in Figures 6, and 7, the concentration of DO meets the target quality standards that recommend that its concentration should be greater or equal to 4 mg/L and it is in a state of continuous increase ranging from 8.31 mg/L at the headwater (0 km) to 8.36 mg/L at the (7 km) The concentration of BOD5 increased in March, and the concentration of $\mathrm{BOD}_5$ decreased in April. This may be due to the increased discharge from 320 m3/sec in January to 335 m3/sec in March as a result of the increased velocity of the Euphrates river, which causes an increase in the aeration of water. The rate of chemical processes, as well as the metabolic activity of living things, and the interactions of pollutants, parasites, and other diseases with aquatic residents are all affected by temperature. The quantity of daylight hours, sample collection time, and climatic conditions are all factors that affect temperature change. During the seasons investigated, the temperatures of the air and water were positively connected. This meant that the temperature of water was exclusively altered by the temperature of air in the surrounding environmental, implying that there was no source of thermal water pollution [46]. The high discharge of the river as a result of the high velocity of the river helps the mitigation process to occur, and thus the process of self-purification occurs inside the river, but it is slow, thus enhancing the river’s ability to absorb pollutant [47]. In addition to increasing the temperature at the headwater from 16.5 to 22, the DO concentration in March is lower than in January because the oxygen solubility has increased [48].
4.2 Strategies for control the quality of Euphrates river water
To keep the concentration of DO in the Euphrates river under control and below acceptable limits, various strategies were used. The modeling result clarified that the concentration of DO and CBOD were within the permissible level and that the water quality in this section was good (a section that is not polluted), but three different strategies were suggested with fixed trial values of CBOD to maintain water quality within this level or improve it.
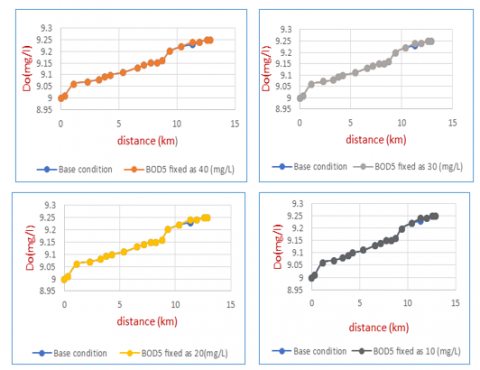
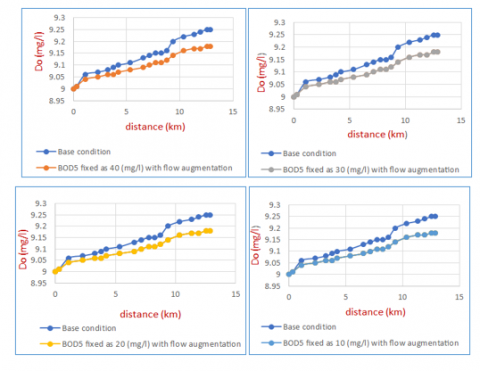
Strategy 1: Modification of the pollution load: With constant experimental values of CBOD such as 40 mg/L, 30 mg/L, 20 mg/L, and 10 mg/L for pollution load (point sources pollution), this scenario assumed the provision of units for the treatment of rainwater sewage before dumping it into the river and the concentration of CBOD in the scenario started from a concentration of 40 mg/L because it is the highest permissible concentration of CBOD in sewage water based on the Iraqi standard [49]. Figure 8 shows the DO profiles that were obtained from the simulation processes. The minimal DO criteria is met by all DO profiles with a small increase in the level of the DO at the fourth reach with an exact match between all curves when assuming fixed trial values of CBOD for all scenarios, as illustrated by the figures shown below 8, 9, and 10.
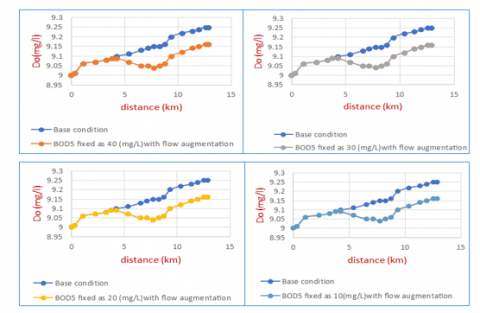
Strategy 2: Flow augmentation for point sources: In this scenario, it was proposed to increase the discharge of all point sources to 1 m3/sec, assuming an increase in rainfall or population density, while maintaining the fixed trial CBOD values of 40 mg/L, 30 mg/L, 20 mg/L, and 10 mg/L for pollution load (point sources pollution). The results showed that the DO concentration decreased from the original condition, in which the point sources discharge was very small. This means that the higher the discharge, the lower the DO concentration, and consequently, the worse the ecological condition of the river. Despite the DO concentration decreasing as a result of implementing this scenario, all DO profiles still fully meet the minimum requirements for DO, as shown in Figure 9.
Strategy 3: Flow augmentation for headwater: It was suggested to increase the headwater discharge to 450 m3/sec with the application of the fixed experimental values of CBOD as 40 mg/L, 30 mg/L, 20 mg/L, and 10 mg/L for point sources pollution as clarified in Figure 10. These scenarios' proposed values are clarified in the Table 9 below:
Table 9. The Fixed trial values of BOD5 for point sources with flow increases in point sources and Headwater
|
Discharge |
Location (km) |
Flow $m^3$ /sec Scen.1 |
Flow $m^3$ /sec Scen.2 |
Flow $m^3$ /sec Scen.3 |
BOD5 mg/L |
BOD5 mg/L |
BOD5 mg/L |
BOD5 mg/L |
|
Head water |
0.0 |
320 |
320 |
450 |
4 |
4 |
4 |
4 |
|
P14 |
5.8 |
0.0711 |
1 |
0.0711 |
40 |
30 |
20 |
10 |
|
40 th street |
5.95 |
0.0012 |
1 |
0.0012 |
40 |
30 |
20 |
10 |
|
Fallujah |
6.41 |
0.0041 |
1 |
0.0041 |
40 |
30 |
20 |
10 |
|
P10 Al-Fao |
7.33 |
0.0330 |
1 |
0.0330 |
40 |
30 |
20 |
10 |
|
Al-Jehaad |
7.7 |
0.1917 |
1 |
0.1917 |
40 |
30 |
20 |
10 |
Figure 8. DO concentrations along the Fallujah Euphrates Reach (FER) with different BOD5 concentrations for point sources
Figure 9. DO concentration along Fallujah Euphrates Reach (FER) with different BOD5 concentration for point sources and point sources flow augmentation
Figure 10. DO concentrations along the Fallujah Euphrates Reach (FER) with different BOD5 concentrations for point sources and head water flow augmentation
The most important conclusions drawn from this article are:
1-Rresults of applying three statistical criteria: Relative Error (RE), Root Mean Square Error (RMSE), and Mean Absolute Error (MAE) for the purpose of evaluating the performance of the QUAL2K mathematical. The amount of error between the observed and expected values does not exceed 15% by using RE, while the error rate between MAE and RMSE is very small and it is within the acceptable limits, which means that the mathematical model can be applied to large rivers such as the Euphrates river and not only to small rivers such as the Diyala river.
2-The important findings of the modeling process are that the water quality of the Euphrates river is within quality standards, as the concentration of DO exceeds 4 mg/L, and that the concentration of BOD5 was within the standard, as it did not exceed 4 mg/L, except for the last station at 7 km, where it exceeded the permissible value for entering the effect of point sources, but the effect was minimal because the discharge was so small.
3- The application of three hypothetical strategies for the purpose of improving the quality of Euphrates river water. Based on the results of the first strategy, it is recommended that the responsible authorities add treatment units to water before dumping it in the river, as this strategy was successful in increasing the concentration of DO in the river, where the concentration of BOD5 in sewage water should not exceed 40 mg/L, depending on the standard specification for sewage water. While the second strategy is specific to increasing the discharge of point sources, it did not give good results. As for the third strategy, which represents an increase in the discharge into headwater, it also did not give good results, as it was noted that the DO decreased even with a decrease in the BOD5.
4-The most important conclusion: we can say that we have achieved the two most important main goals of modeling. We were able to create models to support water quality management in this section and help responsible people make decisions because these models represent surface water realistically. In addition, we were able to learn more about chemical, physical, and biological processes. In addition to establish a water quality policy in the future.
[1] Gupta, A.D., Pandey, P., Feijóo, A., Yaseen, Z.M., Bokde, N.D. (2020). Smart water technology for efficient water resource management: A review. Energies, 13(23): 6268. https://doi.org/10.3390/en13236268
[2] Tiyasha, T., Bhagat, S.K., Fituma, F., Tung, T.M., Shahid, S., Yaseen, Z.M. (2021). Dual water choices: The assessment of the influential factors on water sources choices using unsupervised machine learning market basket analysis. IEEE Access, 9: 150532-150544. https://doi.org/10.1109/ACCESS.2021.3124817
[3] Bao, C., Fang, C. (2012). Water resources flows related to urbanization in China: Challenges and perspectives for water management and urban development. Water Resour. Manag., 26(2): 531-552. https://doi.org/10.1007/s11269-011-9930-y
[4] Ali, M., Deo, R.C., Xiang, Y., Li, Y., Yaseen, Z.M. (2020). Forecasting long-term precipitation for water resource management: A new multi-step data-intelligent modelling approach. Hydrol. Sci. J., 65(16): 2693-2708. https://doi.org/10.1080/02626667.2020.1808219
[5] Bottino, F., Ferraz, I.C., Mendiondo, E.M., Calijuri, M.C. (2010). Calibration of QUAL2K model in brazilian micro watershed: effects of the land use on water quality. Acta Limnol. Bras., 22(4): 474-485. https://doi.org/10.4322/actalb.2011.011
[6] Bhagat, S.K., Tiyasha, T., Awadh, S.M., Tung, T.M., Jawad, A.H., Yaseen, Z.M. (2020). Prediction of sediment heavy metal at the Australian Bays using newly developed hybrid artificial intelligence models. Environ. Pollut., 268: 115663. https://doi.org/10.1016/j.envpol.2020.115663
[7] Zhao, Y., Wang, Y., Wang, Y. (2021). Comprehensive evaluation and influencing factors of urban agglomeration water resources carrying capacity. J. Clean. Prod., 288: 125097. https://doi.org/10.1016/j.jclepro.2020.125097
[8] Tiyasha, Tung, T.M., Yaseen, Z.M. (2020). A survey on river water quality modelling using artificial intelligence models: 2000-2020. J. Hydrol., 585: 124670. https://doi.org/10.1016/j.jhydrol.2020.124670
[9] Asadollah, S.B.H.S., Sharafati, A., Motta, D., Yaseen, Z.M. (2020). River water quality index prediction and uncertainty analysis: A comparative study of machine learning models. J. Environ. Chem. Eng.
[10] Zhang, R., Qian, X., Yuan, X., Ye, R., Xia, B., Wang, Y. (2012). Simulation of water environmental capacity and pollution load reduction using QUAL2K for water environmental management. Int. J. Environ. Res. Public Health, 9(12): 4504-4521. https://doi.org/10.3390/ijerph9124504
[11] Ghalib, H.S., Ramal, M.M. (2021). Spatial and temporal water quality evaluation of heavy metals of Habbaniyah Lake, Iraq. International Journal of Design & Nature and Ecodynamics, 16(4): 467-475. https://doi.org/10.18280/ijdne.160414
[12] Ramal, M.M., Abdulhameed, U.H., Jalal, A.D. (2021). Trace elements risk assessment in taps drinking water of Ramadi City, Anbar Province, Iraq. International Journal of Safety and Security Engineering, 11(6): 623-634. https://doi.org/10.18280/ijsse.110602
[13] Cromey, C.J., Black, K.D., Edwards, A., Jack, I.A. (1998). Modelling the deposition and biological effects of organic carbon from marine sewage discharges. Estuar. Coast. Shelf Sci., 47(3): 295-308. https://doi.org/10.1006/ecss.1998.0353
[14] Gou, X., Zeng, B., Gong, Y. (2022). Application of the novel four-parameter discrete optimized grey model to forecast the wastewater discharged in Chongqing China. Eng. Appl. Artif. Intell., 107: 104522. https://doi.org/10.1016/j.engappai.2021.104522
[15] Kalburgi, P.B., Shareefa, R.N., Deshannavar, U.B. (2015). Development and Evaluation of BOD–DO Model for River Ghataprabha near Mudhol (India), using QUAL2K. Int. J. Eng. Manuf., 5(1): 15-25. https://doi.org/10.5815/ijem.2015.01.02
[16] Ramal, M.M., Jalal, A.D., Abdulhameed, U.H. (2021). Heavy metal assessment in taps drinking water of Ramadi city using water quality Indices, Anbar Province, Iraq. International Journal of Sustainable Development and Planning, 16(7): 1349-1357. https://doi.org/10.18280/ijsdp.160715
[17] Nakhaei, N., Shahidi, A.E. (2010). Waste water discharge impact modeling with QUAL2K, case study: The Zayandehrood River. In Modelling for Environment’s Sake: Proceedings of the 5th Biennial Conference of the International Environmental Modelling and Software Society, iEMSs 2010. http://www.iemss.org/iemss2010/index.php?n=Main.Proceedings.
[18] Ejigu, M.T. (2021). Overview of water quality modeling. Cogent Eng., 8(1): 1891711. https://doi.org/10.1080/23311916.2021.1891711
[19] Rafiee, M., Akhond Ali, A.M., Moazed, H., Lyon, S.W., Jaafarzadeh, N., Zahraie, B. (2014). A case study of water quality modeling of the Gargar River, Iran. J. Hydraul. Struct., 1(2): 10-22.
[20] Mustafa, A., Sulaiman, S.O., Shahooth, S.H. (2017). Application of QUAL2K for water quality modeling and management in the lower reach of the Diyala River. Iraqi J. Civ. Eng., 11(2): 66-80. https://doi.org/10.37650/ijce.2017.134910
[21] Jitolis, J.L., Ali, A.N.A., Bolong, N. (2021). Water quality modelling using QUAL2K at Likas River, Sabah. Trans. Sci. Technol., 8(3-2): 363-371.
[22] Yaseen, Z.M., Sulaiman, S.O., Sharif, A. (2021). The Nature of Tigris–Euphrates Rivers Flow: Current Status and Future Prospective. In: Jawad, L.A. (eds) Tigris and Euphrates Rivers: Their Environment from Headwaters to Mouth. Aquatic Ecology Series, vol 11. Springer, Cham. https://doi.org/10.1007/978-3-030-57570-0_8
[23] Sissakian, V.K., Al-Ansari, N., Adamo, N., Knutsson, S., Laue, J. (2018). Geology of the Euphrates river with emphasize on the Iraqi part. Journal of Earth Sciences and Geotechnical Engineering, 8(3): 167-185.
[24] Chabuk, A., Hammood, Z.A., Al-Ansari, N., Abed, S.A., Laue, J. (2021). Classification Maps for TDS Concentrations in the GIS Along Euphrates River, Iraq. Water, Air, & Soil Pollut., 232: 317. https://doi.org/10.1007/s11270-021-05236-7
[25] Al-Ansari, N., Adamo, N., Sissakian, V.K. (2019). Hydrological characteristics of the Tigris and Euphrates Rivers. Geology of Iraq Water Resources.
[26] Chabuk, A., Al-Zubaidi, H.A.M., Abdalkadhum, A.J., Al-Ansari, N., Abed, S.A., Al-Maliki, A., Laue, J., Ewaid, S. (2021). Application ArcGIS on modified-WQI method to evaluate water quality of the Euphrates River, Iraq, using physicochemical parameters. Proceedings of Sixth International Congress on Information and Communication Technology. Springer Singapore, pp. 657-675. https://doi.org/10.1007/978-981-16-2380-6_58
[27] Saod, W.M., Yosif, Y.M., Abdulrahman, M.F., Mohammed, A.H. (2021). Water quality index along the Euphrates between the cities of Al-Qaim and Falluja: A comparative study. IOP Conf. Ser. Earth Environ. Sci., 779(1): 12058.
[28] Nasif Al Fahdawi, Y.M., Mashee Al Ramahi, F.K., Hamadi Alfalahi, A.S. (2021). Measurement albedo coefficient for land cover (Lc) and land use (Lu), using remote sensing techniques, a study case: Fallujah city. J. Phys. Conf. Ser., 1829(1): 12003. https://doi.org/10.1088/1742-6596/1829/1/012003
[29] Ramal, M.M., Jalal, A.D., Sahab, M.F., Yaseen, Z.M. (2021). River water turbidity removal using new natural coagulant aids: Case study of Euphrates River, Iraq. Water Supply, 22(3). https://doi.org/10.2166/ws.2021.441
[30] Yaseen, Z.M., Ramal, M.M., Diop, L., Jaafar, O., Demir, V., Kisi, O. (2018). Hybrid adaptive neuro-fuzzy models for water quality index estimation. Water Resour. Manag., 32(7): 2227-2245. https://doi.org/10.1007/s11269-018-1915-7
[31] Suharini, E., Ariyadi, M.H., Kurniawan, E. (2020). Google earth pro as a learning media for mitigation and adaptation of landslide disaster. Int. J. Inf. Educ. Technol., 10(11): 815-820. https://doi.org/10.18178/ijiet.2020.10.11.1464
[32] Nakhaei, N., Shahidi, A.E. (2010). Waste water discharge impact modeling with QUAL2K, case study: The Zayandeh-rood River. 5th International Congress on Environmental Modelling and Software - Ottawa, Ontario, Canada - July 2010. http://www.iemss.org/iemss2010/index.php?n=Main.Proceedings.
[33] Ismail, H., Robescu, D. (2017). Application of a onedimensional steady state model for simulation the water quality in a large river: A case study of the Danube River. UPB Scientific Bulletin, Series D: Mechanical Engineering, 79(2): 183-192.
[34] Gardner, S., Griggs, B., Handy, J., Lemme, N., Paudel, M. (2007). A Qual2K water quality analysis of the Rio Blanco watershed near Jalisco, Mexio. Water Resour. Eng. http://cemexico.groups.et.byu.net/2007/RioBlanco/Microsoft%20Word%20-%20Rio%20Blanco%20Final%20Report.pdf.
[35] Zhang, R., Qian, X., Li, H., Yuan, X., Ye, R. (2012). Selection of optimal river water quality improvement programs using QUAL2K: A case study of Taihu Lake Basin, China. Sci. Total Environ., 431: 278-285. https://doi.org/10.1016/j.scitotenv.2012.05.063
[36] Bui, H.H., Ha, N.H., Nguyen, T.N.D., Nguyen, A.T., Pham, T.T.H., Kandasamy, J., Nguyen, T.V. (2019). Integration of SWAT and QUAL2K for water quality modeling in a data scarce basin of Cau River basin in Vietnam. Ecohydrology and Hydrobiology, 19(2): 210-223. https://doi.org/10.1016/j.ecohyd.2019.03.005
[37] Chapra, S.C., Pelletier, G.J., Tao, H. (2003). QUAL2K: A modeling framework for simulating river and stream water quality: Documentation and users manual. Civ. Environ. Eng. Dept., Tufts Univ. Medford, MA.
[38] Brown, L.C., Barnwell, T.O. (1987). The enhanced stream water quality models QUAL2E and QUAL2E-UNCAS: Documentation and user manual. EPA.
[39] Ismail, A.H., Abed, G.A. (2013). BOD and DO modeling for Tigris River at Baghdad city portion using QUAL2K model. Water Quality Modelling.
[40] te Chow, V. (1988). Open-Channel Hydraulics, Classical Textbook Reissue. MC Graw Hill.
[41] Mohammadighaleni, M., Ebrahimi, K., Omid, M.H. (2015). Evaluation of Sefidroud river’s reaeration-rate coefficient, Iran. Proceedings of the 36th IAHR World Congress.
[42] O’Connor, D.J., Dobbins, W.E. (1958). Closure to ‘Mechanism of Reaeration in Natural Streams’. J. Sanit. Eng. Div., 84(1): 3-7. https://doi.org/10.1061/JSEDAI.0000124
[43] Heidarzadeh, N., Mahdavi, H., Yaghouti, M. (2021). Reservoir water-quality simulation using simplified mathematical models (case study: Seymareh Reservoir). Mar. Freshw. Res., 72(10): 1533. https://doi.org/10.1071/MF20334
[44] Mohadesi, M., Aghel, B. (2020). Use of ANFIS/genetic algorithm and neural network to predict inorganic indicators of water quality. J. Chem. Pet. Eng., 54(2): 155-164. https://doi.org/10.22059/jchpe.2020.264471.1244
[45] Kannel, P.R., Lee, S., Lee, Y.S., Kanel, S.R., Pelletier, G.J. (2007). Application of automated QUAL2Kw for water quality modeling and management in the Bagmati River, Nepal. Ecol. Modell., 202(3-4): 503-517. https://doi.org/10.1016/j.ecolmodel.2006.12.033
[46] Ezzat, S.M., Mahdy, H., Abo-State, M.A., Abd El Shakour, E.H., Elbahnasawy, M.A. (2012). Water quality assessment of river nile at rosetta branch: Impact of drains discharge. Middle East Journal of Scientific Research, 12(4): 413-423. https://doi.org/10.5829/idosi.mejsr.2012.12.4.1694
[47] Karnita, G.G. (2009). Hydrodynamics and water quality: Modeling, rivers, lakes, and estuaries. J. Am. Water Resour. Assoc., 45(3): 811. https://search.proquest.com/openview/7e95aea8c08038b28ca3022428c93cdc/1?pq-origsite=gscholar&cbl=34915
[48] Adeyemo, O.K., Adedokun, O.A., Yusuf, R.K., Adeleye, E.A. (2013). Seasonal changes in physico-chemical parameters and nutrient load of river sediments in Ibadan City, Nigeria. Global NEST Journal, 10(3), 326-336. https://doi.org/10.30955/gnj.000458
[49] Majeed, J. (2008). Determining the extent of the agreement between modern paints company waste water and sewage and Iraqi specifications. J. Tech., 21(4): A19-A26.