Karzan J. Saadoon* | Mustafa Muhlis | Rezhan O. Mohammed
© 2022 IIETA. This article is published by IIETA and is licensed under the CC BY 4.0 license (http://creativecommons.org/licenses/by/4.0/).
OPEN ACCESS
The importance of service quality is undeniable. For years, numerous marketing professionals have researched its direct and indirect impacts on customer satisfaction and loyalty. Academics have proposed empathy, responsiveness, assurance, reliability, and tangibles as the primary drivers of service quality, university-related physical items or resources (technologic apparatus, smartboards, air conditioners, garden facilities, sports facilities, computer laboratories, etc.). The capacity of a service provider to offer essential service or acceptable and trustworthy responses to a student's demands or questions is referred to as reliability. This research aimed to benchmark the service quality dimensions of the architectural engineering department compared to other departments at Tishk International University-Sulaimani, Iraq. A quantitative research method has been applied. To do this, we have used ServQual and asked those questions to more than 100 students from architectural engineering, civil engineering, and business management departments. The data were analysed, and the results were initially analysed through regression analysis, and the obtained standardised weights of the regression analysis have been used for benchmarking after being normalised. The results show that the architectural engineering department delivered the best service quality compared to civil engineering and the business management department.
service quality, education service quality, private universities, student satisfaction, SERVQUAL, benchmarking
Private education institutions are emerging all around the world day-to-day. Further, the students of these institutions are paying much more than they do in public education institutions. Thus, students would like to select a university where they can get better services in exchange for the payment. In this research, we have studied the impact of service quality on the students' satisfaction.
The significance of service quality is not in question. Many experts in the marketing field of study have been looking into its direct and indirect effects on consumer satisfaction and loyalty for years [1]. In order to increase organisational effectiveness, managers must pay close attention to the quality of services given in the workplace, which directly impacts customer perception. Businesses need contented consumers and loyal customers that want to maintain their relationship with their existing organisations for long-term business efficiency and success [2].
Service quality boosts productivity in the workplace and gives businesses a competitive edge in the marketplace [3]. On the other hand, it favours customers' perceptions and leads to satisfaction from satisfying their expectations [4]. Furthermore, customer interaction with staff influences customers' perceptions of quality service [5]. Grönroos [6] states that service quality is determined by both anticipated and observed service. Hence, to conform to the customers' expectations, which are students of private institutions in this research, universities must conduct a survey questionnaire to understand their demands regarding service quality.
In this research, we have studied the impact of service quality determinants, developed by Parasuraman and Zeithaml [7], on the students' satisfaction. Scholars have suggested that empathy, responsiveness, assurance, reliability, and tangibles as the main determinants of service quality; tangibles – are the physical equipment or materials covering university education (technical and technological equipment, smartboards, air conditioners, garden facilities, sports facilities, computer labs…etc.). Reliability refers to a service provider's capacity to provide essential service or adequate and trustworthy answers to a student's demands or inquiries. E.g. lecturing is expected every time each lecturer has an error-free record of students' grades, payments…etc. Responsiveness – how eager academic and administrative staff to provide efficient education and administrative performance. Assurance – providing confidence to students (polite and trustworthy behaviours). Empathy – understanding students' needs, providing personal care to academic and administrative staff, and behaving proactively in case of any risk during the education process.
More studies investigated the service quality and the students’ satisfaction in higher education [8-10]. Several dimensions have been gathered under a questionnaire by the scholars and used in various services fields. Besides, no studies evaluate the education quality by investigating the quality of classes, cafeteria, accounting, student affairs, dean of students, department management, and overall university facilities in private universities in Iraq. This study conducted SERVQUAL to approximately 100 students from architectural engineering, business, management, and civil engineering departments at Tishk International University-Sulaimani, Iraq. First, the results have been analysed by regression analysis. Then, as next, the architectural engineering department was benchmarked with other departments through service quality perceptions in all those departments. Finally, based on the results, some strategic advice has been given—ease of Use.
2.1 Service quality
Service quality can be defined as the ability to understand what customers expect and meet these expectations as long as the choice opportunities increase in the modern world and competitive markets [11]. This may be the only way for a service to be among the customer's choice alternatives. On the other hand, it is challenging to say that there is a complete consortium regarding the service quality and dimensions [12].
For example, when discussing service quality, Parasuraman et al. [13] defined it as "richness, reliability, responsiveness, competence, civility, trust, security, access, communication, and customer understanding." After that, Parasuraman and Zeithaml [7] created the ServQual scale, the most well-known and used in many fields today, and divided its dimensions into five main parts: 'empathy, responsiveness, assurance, reliability, and tangibles'.
The difference between students' expectations and real experiences is described as service quality in higher education [14, 15]. SERVQUAL has been utilised in the traditional learning environment to measure service quality [16]. The tendency to use SERVQUAL in educational settings is strong [17, 18].
Service quality can essentially be categorised as an activity where production and facilities significantly take place concurrently [19]. It is complicated for the customer to estimate the quality of facilities due to the lack of physical evidence related to service quality. Private universities must be worried about the quality of their education and the quality of the service surrounding the tangible product. Service quality evaluation is based on customer satisfaction or customer expectation, which considers how well the delivered service level corresponds [20]. In addition, meeting or agreeing on the customer consummation is key to preserving the service quality image. To improve service quality, some steps should be applied first to recognise quality determinants, such as the quality of classes and labs. Step two, it is very important to emphasise the types of complaints and record the complements of the customers. Those factors become a frequent change for the future of service strategy Berry, Zeithaml & Parasuraman had used this method.
These technical results of the production process practice match the service's involved performance. Although usually, the consumer will be able to visit the university in most cases, before the study, a service organisation cannot hide behind brand names. Therefore, the organisation sharing information and sometimes the local image of an office or organisational unit is most important to present service quality [21].
Vests investigation and theoretical research have been published from the perspective of service quality, and many researchers emphasise education quality and its determining factors. However, in the case of private universities (Architecture department), very primitive research is applied [22]. Ashraf et al. [22] pointed out that short or long-term objects must be reached. Therefore, a long-term national vision is essential. However, most university departments do not have such a vision. His target was stated: "Improving the curriculum incessantly and teaching quality, as well as resource environment, upgrading skill and proficiency, assessment methods and learning those factors address the determinant quality education in universities. Student-lecturer interaction and enhancement challenges must be considered through appropriate quality assurance to determine quality. From the viewpoint of consumer behaviour, student behaviour can positively be considered. However, student performance may not be calculated as an ultimate consumption product."
Regarding consumer assessment of service quality Parasuraman and Zeithaml [7] addressed a tool consisting of the statements related to assessing consumer perception, and the research resulted in two stages of the process from the responded organisation. In the first stage, the ability number of items was reduced based on reliability and discrimination. The scale and form's dimensionality depends on its component's abilities in stage two. In the beginning, the dimension was 22, but because of overlapping some dimensions, the actual number was reduced to 5, which is shown in the list below [7]:
Higher education and private universities have provided excellent service quality to study. While higher education frequently occupant administrative and supporting service areas in ways similar to typical.
The business and service businesses differ from the academic/instructional field. The academic areas of higher education are set apart from the idea of academic independence in typical service business processes. In addition, creating a private institution-wide implementation of regulations and practices is similar to the concept of shared governance, which is more difficult since each private institution of higher education has its regulation and structural model. This research emphasises service quality in education management, such as in undergraduate and graduate programs in public universities and general regulations and supplementary functions (e.g. accommodation, Administrator, Financial Aid, foot Facilities, etc.). Other education organisations (private universities and online-only institutions) will face similar problems concerning service quality. The variance between the observations of the tangible service encounter and expected from a service encounter is measured by SERVQUAL [7]. The researcher named this the diversification model and operationalised it as Service Quality (Q), Perception (P) Expectation (E). The classic importance/performance model is the most suitable means of assessing service quality in education.
The literature recommends that recent quality improvements in higher education must be motivated. From the 1990s, the rise in TQM efforts, student competition and operational funds increased due to difficulties of the financial situation in higher education. Irmayani, et al. [23] stated that competition for funding, resources, and students should be increased and motivators to improve education quality. The economic conditions affect higher education standards toward industry-style competition [24]. In the 1990s, funding formulas were changed, students became 'savvier' and discriminating, and non-governmental institute sources became more selective [25].
2.2 Customer satisfaction
Most researchers pay attention to consumer satisfaction and service quality in an inclusive diversity of disciplines. There is a strong link between conceptions and customer trustworthiness [26, 27]. Parasuraman claims that the media cannot distinguish between these two constructs – however, he focuses on the important models to measure customer satisfaction and the causal ordering of these two structures [28, 29]. Consumer registered the ServQual measuring satisfaction and expectation [7, 13, 30].
Present visions interestingly find the challenge of measuring satisfaction: when students were asked about the start of their educational experience and previous expectations, the gap between opportunities and performance had predictive power. Nonetheless, the gap model proved satisfactory in predicting overall satisfaction when students were offered to attend a short course after the semester [31].
According to the research, there were discrepancies in expectations at the start of the course versus predictions remembered at the end of the encounter. The sheer amount of the event detracts from the re-creation of previous expectations.
This research aimed to benchmark the service quality of the architectural engineering department compared with the business, management, and civil engineering departments from the empathy, responsiveness, assurance, reliability, and tangibles points of view. To do this, we have gathered data from students asking service quality of the department based on the survey questionnaire of Parasuraman et al. [32]. The researchers attempted to survey the whole population of the newly-established institution using these three departments. As a result, nearly all of the students in these departments took part in the survey, and we could gather more than 100 responses to meet the qualitative study sample size criterion. As described in the literature, each major sub-group in the populace should receive 100 samples, while minor sub-groups should receive 20 to 50 samples [33, 34].
The results initially have been evaluated by proposing regression analysis, and in this way, the standardised weights of each service quality determinant have been obtained. Secondly, the results regression analysis has normalised and integrated the benchmarking process. Finally, students' average evaluation for each dimension has been multiplied by the normalised weights, and benchmarking of the process has been finalised.
3.1 Data analysis
In this section, we have analysed the data collected from students. Analysis has been proposed by regression analysis. However, before proposing regression analysis, the reliability of the questionnaire has been tested. Cronbach's Alpha has tested the reliability analysis in IBM SPSS 23. The results of the analysis are shown in Table 1.
Each dimension should have a dependability value greater than 0.7, according to Cronbach's Alpha criteria. As a result, the troubling group of questions can be deemed a solid construct. In Table 1, it can be seen that each dimension has a Cronbach's Alpha value greater than 0.7. As a result, it can be stated that the dimensions of the service quality survey questionnaire were trustworthy enough to warrant further investigation.
Then, we offered regression analysis to evaluate the impact of each service quality factor on students' satisfaction in the concerned department as shown in Table 2.
The analysis results show that service quality dimensions have explained 80 per cent of the overall students' satisfaction in their departments. Further, it can be revealed that tangibles (0.316), assurance (0.311), and empathy (0.258) dimensions were the top impacting dimensions of the students' satisfaction and reliability (0.174), and the responsiveness (0.101) have been secondarily important determinants of the students' satisfaction. After, we normalised the weights of the regression analysis for the further process of benchmarking. The results of normalisation are shown in Table 3.
Given in Table 3, normalised weights are ready to run the benchmarking process. First, weights have been normalised by dividing each standardised weight by the total sum. Then, as the next step, the benchmarking process was run.
In benchmarking, the normalised weights have been multiplied by each department's service quality dimensions. Therefore, there were some marks for each department. The results show which department provides the best service quality compared to others as shown in Table 4.
For example, the benchmarking calculation of the architectural engineering department has been proposed through;
Mean of empathy + responsiveness + assurance + reliability + tangibles in Arch. Dept. * Normalized weight of each dimension.
Further, the results have been concerted out of five to out of 100 through;
(Results of architectural engineering department * 100) / 5.
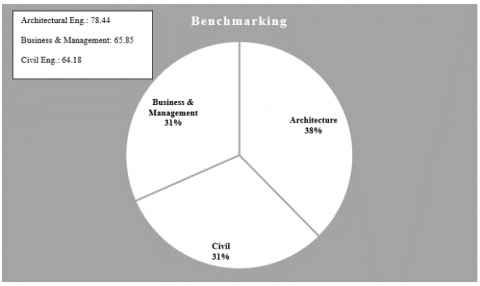
All results have been calculated and shown in Figure 1.
The results show us that the architectural engineering department obtained 78, the business management department obtained 66, and the civil engineering department obtained a point out of 100 in service quality of the department. Therefore, with these results, the architectural engineering department has been considered the best service provider department than the business management and civil engineering departments.
Figure 1. Benchmarking results
The architecture department got more empathy (students’ care and individualised attention) in the survey results than other departments. So this is an indication of how important to provide the students with necessary care beyond normal education and lectures. This indicates that architectural education's nature may assist this cooperation and collaboration between students and instructors. Because architecture education combines several practical and theoretical courses that make students and instructors work closely together and more socially connected compared to other disciplines.
Table 1. Cronbach's alpha levels of each dimension
|
Empathy |
Cronbach's Alpha |
Cronbach's Alpha Based on Standardised Items |
N of Items |
|||
|
0.920 |
0.921 |
6 |
||||
|
Scale Mean if Item Deleted |
Scale Variance if Item Deleted |
Corrected Item-Total Correlation |
Squared Multiple Correlation |
Cronbach's Alpha if Item Deleted |
||
|
Q1 |
18.6061 |
27.79 |
0.755 |
0.644 |
0.908 |
|
|
Q2 |
18.4015 |
28.39 |
0.724 |
0.609 |
0.912 |
|
|
Q3 |
18.3333 |
27.94 |
0.803 |
0.689 |
0.901 |
|
|
Q4 |
18.2348 |
29.46 |
0.736 |
0.628 |
0.910 |
|
|
Q5 |
18.3561 |
28.36 |
0.815 |
0.753 |
0.900 |
|
|
Q6 |
18.3333 |
27.90 |
0.802 |
0.735 |
0.901 |
|
|
Responsiveness |
Cronbach's Alpha |
Cronbach's Alpha Based on Standardised Items |
N of Items |
|||
|
0.929 |
0.929 |
5 |
||||
|
Scale Mean if Item Deleted |
Scale Variance if Item Deleted |
Corrected Item-Total Correlation |
Squared Multiple Correlation |
Cronbach's Alpha if Item Deleted |
||
|
Q7 |
14.1579 |
20.07 |
0.780 |
0.645 |
0.919 |
|
|
Q8 |
14.3158 |
19.56 |
0.821 |
0.719 |
0.911 |
|
|
Q9 |
14.4211 |
19.38 |
0.830 |
0.715 |
0.909 |
|
|
Q10 |
14.3383 |
19.58 |
0.845 |
0.730 |
0.906 |
|
|
Q11 |
14.2556 |
20.20 |
0.785 |
0.661 |
0.917 |
|
|
Assurance |
Cronbach's Alpha |
Cronbach's Alpha Based on Standardised Items |
N of Items |
|||
|
0.892 |
0.892 |
3 |
||||
|
Scale Mean if Item Deleted |
Scale Variance if Item Deleted |
Corrected Item-Total Correlation |
Squared Multiple Correlation |
Cronbach's Alpha if Item Deleted |
||
|
Q12 |
7.3209 |
6.039 |
0.731 |
0.535 |
0.895 |
|
|
Q13 |
7.1119 |
5.709 |
0.809 |
0.681 |
0.828 |
|
|
Q14 |
7.1791 |
5.336 |
0.828 |
0.702 |
0.811 |
|
|
Reliability |
Cronbach's Alpha |
Cronbach's Alpha Based on Standardised Items |
N of Items |
|||
|
0.911 |
0.911 |
4 |
||||
|
Scale Mean if Item Deleted |
Scale Variance if Item Deleted |
Corrected Item-Total Correlation |
Squared Multiple Correlation |
Cronbach's Alpha if Item Deleted |
||
|
Q15 |
10.5224 |
11.18 |
0.830 |
0.703 |
0.874 |
|
|
Q16 |
10.4478 |
11.66 |
0.794 |
0.646 |
0.887 |
|
|
Q17 |
10.2090 |
11.98 |
0.781 |
0.616 |
0.891 |
|
|
Q18 |
10.3507 |
11.83 |
0.791 |
0.648 |
0.888 |
|
|
Tangibles |
Cronbach's Alpha |
Cronbach's Alpha Based on Standardised Items |
N of Items |
|||
|
0.903 |
0.902 |
5 |
||||
|
Scale Mean if Item Deleted |
Scale Variance if Item Deleted |
Corrected Item-Total Correlation |
Squared Multiple Correlation |
Cronbach's Alpha if Item Deleted |
||
|
Q19 |
14.5191 |
19.59 |
0.752 |
0.640 |
0.882 |
|
|
Q20 |
14.5191 |
18.85 |
0.783 |
0.665 |
0.875 |
|
|
Q21 |
14.5344 |
18.75 |
0.798 |
0.684 |
0.872 |
|
|
Q22 |
14.2824 |
18.98 |
0.793 |
0.704 |
0.873 |
|
|
Q23 |
14.2672 |
20.38 |
0.660 |
0.544 |
0.901 |
|
|
Student Satisfaction |
Cronbach's Alpha |
Cronbach's Alpha Based on Standardised Items |
N of Items |
|||
|
0.934 |
0.935 |
4 |
||||
|
Scale Mean if Item Deleted |
Scale Variance if Item Deleted |
Corrected Item-Total Correlation |
Squared Multiple Correlation |
Cronbach's Alpha if Item Deleted |
||
|
Q24 |
10.8333 |
13.48 |
0.831 |
0.701 |
0.918 |
|
|
Q25 |
10.9561 |
13.54 |
0.845 |
0.735 |
0.914 |
|
|
Q26 |
10.9649 |
12.90 |
0.869 |
0.770 |
0.905 |
|
|
Q27 |
10.9825 |
12.56 |
0.837 |
0.720 |
0.917 |
Table 2. Regression analysis results
|
Model |
Unstandardised Coefficients |
Standardised Coefficients |
t |
Sig. |
|
|
B |
Std. Error |
Beta |
|||
|
(Constant) |
0.40 |
0.187 |
2.18 |
0.03 |
|
|
Empathy |
0.30 |
0.110 |
0.258 |
2.81 |
0.00 |
|
Responsiveness |
0.12 |
0.111 |
0.107 |
1.08 |
0.28 |
|
Assurance |
0.34 |
0.108 |
0.311 |
3.14 |
0.00 |
|
Reliability |
0.19 |
0.118 |
0.174 |
1.68 |
0.09 |
|
Tangibles |
0.36 |
0.088 |
0.316 |
4.14 |
0.00 |
|
a. Dependent Variable: Satisfaction |
|||||
Table 3. Normalised weights for benchmarking
|
Un-normalized Standard weights |
Normalized Standard weights |
|
|
Empathy |
0.258 |
0.221 |
|
Responsiveness |
0.107 |
0.091 |
|
Assurance |
0.311 |
0.267 |
|
Reliability |
0.174 |
0.149 |
|
Tangibles |
0.316 |
0.271 |
|
Total Weights |
1.166 |
1.000 |
Table 4. Anova descriptive results
|
N |
Mean |
Std. Deviation |
||
|
Empathy |
Business Management |
35 |
3.4095 |
1.00760 |
|
Civil Engineering |
31 |
3.3790 |
1.12543 |
|
|
Architectural Engineering |
68 |
3.9412 |
0.98654 |
|
|
Total |
134 |
3.6723 |
1.05390 |
|
|
Responsive-ness |
Business Management |
35 |
3.3657 |
1.00292 |
|
Civil Engineering |
30 |
3.0700 |
1.23320 |
|
|
Architectural Engineering |
68 |
3.8794 |
1.02514 |
|
|
Total |
133 |
3.5617 |
1.11523 |
|
|
Assurance |
Business Management |
35 |
3.2095 |
1.24482 |
|
Civil Engineering |
31 |
3.1290 |
1.23432 |
|
|
Architectural Engineering |
68 |
3.9804 |
0.99398 |
|
|
Total |
134 |
3.5821 |
1.18448 |
|
|
Reliability |
Business Management |
34 |
3.2588 |
1.08380 |
|
Civil Engineering |
31 |
2.7855 |
1.02625 |
|
|
Architectural Engineering |
68 |
3.8618 |
1.02054 |
|
|
Total |
133 |
3.4568 |
1.12342 |
|
|
Tangibles |
Business Management |
34 |
3.2735 |
1.05574 |
|
Civil Engineering |
30 |
3.4300 |
1.01341 |
|
|
Architectural Engineering |
68 |
3.8971 |
1.08861 |
|
|
Total |
132 |
3.6303 |
1.09242 |
|
This study aimed to compare architectural engineering service quality dimensions to investigate the department's strong and weak points. The results show that the architectural engineering department's empathy, responsiveness, assurance, reliability, and tangibles were better than the other departments. Based on these results, it can be revealed that the lecturers and the administration of the department show a good level of empathy to the problems of the students, behave responsive to solving the problems of the students, have good knowledge of lecturing and knowledge delivery, and using state of the art technologies inside the classes for lecturing.
The determinants of the service quality in this research contained only the ones of ServQual. Further research can include career opportunities, the employment rate in the field…etc. dimensions for more technical aspects of the department. Another topic for future study may be 'the character of architectural education,' to see how new pedagogical approaches and technology to suit this education to provide architecture students with greater satisfaction.
[1] Aydinli, C., Demir, A. (2015). Impact of non-technical dimensions of service quality on the satisfaction, loyalty, and the willingness to pay more: A cross-national research on GSM operators. International Journal of Economics, Commerce Management, 3(11): 1-16.
[2] Demir, A., Guven, S. (2017). The influence of ISO certificate on quality evaluation of students: A case study at Ishik University. Advances in Social Sciences Research Journal, 4(3).
[3] Torlak, N.G., Demir, A., Budur, T. (2019). Impact of operations management strategies on customer satisfaction and behavioral intentions at café-restaurants. International Journal of Productivity Performance Management, 69(9): 1903-1924. https://doi.org/10.1108/IJPPM-01-2019-0001
[4] Setiawan, E., Wati, S., Wardana, A., Ikhsan, R. (2020). Building trust through customer satisfaction in the airline industry in Indonesia: Service quality and price fairness contribution. Management Science Letters, 10(5): 1095-1102. http://dx.doi.org/10.5267/j.msl.2019.10.033
[5] Bitner, M.J. (1990). Evaluating service encounters: the effects of physical surroundings and employee responses. Journal of Marketing, 54(2): 69-82. http://dx.doi.org/10.2307/1251871
[6] Grönroos, C. (1984). A service quality model and its marketing implications. European Journal of Marketing, 18(4): 36-44. http://dx.doi.org/10.1108/EUM0000000004784
[7] Parasuraman, A., Zeithaml, V. (1988). SERVQUAL: A multiple-item scale for measuring consumer perc. Journal of Retailing, 64(1): 12.
[8] Teeroovengadum, V., Nunkoo, R., Gronroos, C., Kamalanabhan, T., Seebaluck, A.K. (2019). Higher education service quality, student satisfaction and loyalty: Validating the HESQUAL scale and testing an improved structural model. Quality Assurance in Education, 27(4): 427-445. http://dx.doi.org/10.1108/QAE-01-2019-0003
[9] Mulyono, H., Hadian, A., Purba, N., Pramono, R. (2020). Effect of service quality toward student satisfaction and loyalty in higher education. The Journal of Asian Finance, Economics, Business, 7(10): 929-938. http://dx.doi.org/10.13106/jafeb.2020.vol7.no10.929
[10] Darawong, C., Sandmaung, M. (2019). Service quality enhancing student satisfaction in international programs of higher education institutions: A local student perspective. Journal of Marketing for Higher Education, 29(2): 268-283. http://dx.doi.org/10.1080/08841241.2019.1647483
[11] Daugherty, P.J., Bolumole, Y., Grawe, S.J. (2018). The new age of customer impatience: An agenda for reawakening logistics customer service research. International Journal of Physical Distribution Logistics Management, 49(1): 4-32.
[12] Dagger, T.S., Sweeney, J.C., Johnson, L.W. (2007). A hierarchical model of health service quality: Scale development and investigation of an integrated model. Journal of Service Research, 10(2): 123-142. http://dx.doi.org/10.1177/1094670507309594
[13] Parasuraman, A., Zeithaml, V., Berry, L. (1985). A conceptual model of service quality and its implications for future research. Journal of marketing, 49(4): 41-50. http://dx.doi.org/10.1177/002224298504900403
[14] Stodnick, M., Rogers, P. (2008). Using SERVQUAL to measure the quality of the classroom experience. Decision Sciences Journal of Innovative Education, 6(1): 115-133. http://dx.doi.org/10.1111/j.1540-4609.2007.00162.x
[15] Yeo, R.K., Li, J. (2014). Beyond SERVQUAL: The competitive forces of higher education in Singapore. Total Quality Management Business Excellence, 25(1-2): 95-123. http://dx.doi.org/10.1080/14783363.2011.637802
[16] Brochado, A. (2009). Comparing alternative instruments to measure service quality in higher education. Quality Assurance in Education, 17(2): 174-190. http://dx.doi.org/10.1108/09684880910951381
[17] Gupta, P., Kaushik, N. (2018). Dimensions of service quality in higher education–critical review (students’ perspective). International Journal of Educational Management, 32(4): 580-605. https://doi.org/10.1108/IJEM-03-2017-0056
[18] Silva, D.S., de Moraes, G.H.S.M., Makiya, I.K., Cesar, F.I.G. (2017). Measurement of perceived service quality in higher education institutions: A review of HEdPERF scale use. Quality Assurance in Education, 25(4): 415-439. http://dx.doi.org/10.1108/QAE-10-2016-0058
[19] Demir, A., Talaat, K., Aydinli, C. (2015). The relations among dimensions of service quality, satisfaction, loyalty, and willingness to pay more: Case of GSM operators service at Northern-Iraq. International Journal of Academic Research in Accounting, Finance Management Sciences, 5(4): 146-154. http://dx.doi.org/10.6007/IJARAFMS/v5-i4/1910
[20] Bojanic, D.C., Drew Rosen, L. (1994). Measuring service quality in restaurants: An application of the SERVQUAL instrument. Hospitality Research Journal, 18(1): 3-14. http://dx.doi.org/10.1177/109634809401800102
[21] Demir, A., Budur, T., Heshmati, A. (2021). Antecedents of trust, corporate image, and switching costs: A case in telecommunication services in the Kurdistan region of Iraq. International Journal of Mobile Communications, 19(1): 53-74. http://dx.doi.org/10.1504/IJMC.2021.111892
[22] Ashraf, M.A., Osman, A.Z.R., Ratan, S.R.A. (2016). Determinants of quality education in private universities from student perspectives: A case study in Bangladesh. Quality Assurance in Education, 24(1): 123-138. http://dx.doi.org/10.1108/QAE-09-2013-0040
[23] Irmayani, H., Wardiah, D., Kristiawan, M. (2018). The strategy of SD Pusri in improving educational quality. International Journal of Scientific Technology Research, 7(7): 113-121.
[24] Matarranz, J.L., García-Madariaga, J. (2021). Marketing vision for higher education institutions from the perspective of quality and perceived value in the post-COVID-19 time. Journal of Higher Education Theory Practice, 21(8): 16-30. http://dx.doi.org/10.33423/jhetp.v21i8.4502
[25] Olowoye, O.A. (2020). Relationship between perceived funding level and service quality for employees in south-western Nigeria universities. Wilmington University (Delaware).
[26] Cronin Jr, J.J., Taylor, S.A. (1992). Measuring service quality: A reexamination and extension. Journal of Marketing, 56(3): 55-68. http://dx.doi.org/10.1177/002224299205600304
[27] Becker, C.U. (2018). Business Ethics: Methods and Application. Routledge. http://dx.doi.org/10.4324/9780429397707
[28] Demir, A. (2017). Importance of data analysis on achieving the organizational goals during the short term strategic plan: Case of service quality and students’ satisfaction level at Ishik University. International Journal of Social Sciences and Educational Studies, 3(3): 110-121. http://dx.doi.org/10.23918/ijsses.v3i3p110
[29] Armbrecht, J., Andersson, T.D. (2020). The event experience, hedonic and eudaimonic satisfaction and subjective well-being among sport event participants. Journal of Policy Research in Tourism, Leisure Events, 12(3): 457-477. http://dx.doi.org/10.1080/19407963.2019.1695346
[30] Ok, S., Suy, R., Chhay, L., Choun, C. (2018). Customer satisfaction and service quality in the marketing practice: Study on literature review. Asian Themes in Social Sciences Research, 1(1): 21-27. http://dx.doi.org/10.1155/2018/7194106
[31] Al-Sheeb, B., Hamouda, A.M., Abdella, G.M. (2018). Investigating determinants of student satisfaction in the first year of college in a public university in the state of Qatar. Education Research International, 2018: 7194106.
[32] Parasuraman, A., Berry, L., Zeithaml, V. (2002). Refinement and reassessment of the SERVQUAL scale. Journal of Retailing, 67(4): 114.
[33] Delice, A. (2010). The sampling issues in quantitative research. Educational Sciences: Theory Practice, 10(4): 2001-2018.
[34] Sandelowski, M. (1995). Sample size in qualitative research. Research in Nursing Health, 18(2): 179-183. http://dx.doi.org/10.1002/nur.4770180211