Ngo Thanh Mai | Dinh Duc Truong*
© 2022 IIETA. This article is published by IIETA and is licensed under the CC BY 4.0 license (http://creativecommons.org/licenses/by/4.0/).
OPEN ACCESS
Vietnam is one of the countries most affected by natural disasters in the Asia Pacific. In the context of climate change, natural disasters tend to increase in both frequency and intensity, negatively affecting the livelihoods of communities, especially poor farmers. In Vietnam, the central region is identified as the most vulnerable to natural disasters, especially for poor households with high exposure and low adaptive capacity. This study was conducted in 4 coastal provinces in Central Vietnam to evaluate farmers' perception of natural disaster impacts on livelihoods and their adaptation practices. We employed the analytical framework by DFID and IPCC for households’ capital and livelihood assessment in combination with perception evaluation approach from literature. The method used for analysis include quantitative and qualitative approaches. A survey of 444 farming households randomly selected to collect primary data. In addition, indepth interviews with key informants were also carried out to get more insight of the story. Research results show that local people are quite aware of the change in frequency and intensity of natural disasters. Despite fairly good perception of the impacts of natural disasters, the adaptive capacity of farmers is low due to the lack of adaptive capital, including physical, natural, human, financial, and social capital. Faced with natural disasters, people have taken many adaptation measures to maintain their livelihoods, including indigenous knowledge. The study also shows farmers need support to strengthen their disaster resilience through access to information, knowledge, technology, and financial capital. In addition, the link between livelihoods and climate change should also be further developed with different dimension so that a full picture is formed for proper management strategies.
disaster, disaster risk management, climate change, perception, livelihood, adaptation, Central Vietnam
Currently, storms, floods, drought, fires, and landslides are natural disasters occurring every year anywhere in the world, causing threats to the livelihoods of smallholder farmers. Disasters can cause loss of human and animal life, field crops, stored seeds, agricultural materials and the supply systems, thus destroying the immediate growing season and future seasons. Rural regions of the developing world can be isolated, with a high poverty level. Hence access to food and capital related to relief and recovery is a challenge after a disaster. In rural areas, farmers strongly rely on natural resources. They have no alternative source of income or job, making them more vulnerable to natural disasters [1, 2].
Climate change is becoming increasingly apparent in the country of Vietnam. Since 1971, Vietnam's average temperature has grown by around 0.26℃, twice the average for the last decade [3, 4]. The level of the sea along the shore of Vietnam has grown more than 20 cm in the previous 50 years, according to a biannual study published by UNFCCC in 2014. Annual precipitation in the North and South decreases, leading to increased drought in various climates (agro-ecological zones). The Mekong Delta's reliance on saltwater and the recent severe drought in the central highlands are significant examples of unfavorable effects on agriculture output caused by climate change. Projections of climate change until the end of the 21st century seem improbable. Based on the average emission scenario, the 2016 climate change and the sea-leveled increase scenario were presented. The average annual temperature in the North and South is predicted to rise from around 1.9℃ to 2.4℃ by the end of the 21st century. The average water content is predicted to rise to 76 cm by 2,100 by around 32 cm [5, 6].
For agricultural productivity, climate change is a big challenge. The 2016-2045 timeframe is expected to lower rice output by 4.3 percent, compared with production in the absence of climate change, due to rising temperatures, more pesticides, illnesses, and serious drought [7, 8]. Rice-producing regions are anticipated to change with sea level and salt intrusion. Climate change will likely modify rice-producing areas that are especially appropriate for polyculture cultivation. Continuous drought, high temperature, and heated waves rise, which also has an enormous influence on the production of coffee in the Central Highlands and raises the rate of water evaporation and pests. Great increases in temperature and the consequences of climate change connected to diseases are expected to affect livestock systems. Meanwhile, the fisheries industry might become a lucrative producing field if properly adapted types are employed and an improved management system implemented. Increased temperatures and floods in the rainy season might improve aquaculture output [9, 10].
According to FAO [11], while there are clear indications that natural disasters have a high impact on livelihood, major gaps exist in the data and information available worldwide. National and international disaster loss databases seldom report losses in the sector. As a result, little is known on the types of hazards that cause the greatest sector losses. While droughts affect many developing countries and appear to be increasing in frequency, there is little data on the losses they cause to the agriculture sector and sub-sectors and on the full extent of their impact on poverty [12-14]. Yet, quantifying and reporting such impacts and loss is fundamental to understanding the challenges and addressing them [15-17].
This study aims at assessing local farmers' perceptions of disaster impacts on livelihoods and their practices of adaptation solutions. The study area is 4 coastal provinces in Central Vietnam. In addition to the introduction, conclusions and methods parts, the study focuses on analyzing the community's perception of the impacts of natural disasters on livelihoods, focusing on the agricultural sector. The paper also provides an overview of the types of livelihood capital of households and the adaptation solutions that local farmers have taken to respond to natural disasters. Based on findings, the study discusses and provides implications for disaster risk management at the community level in the context of climate change in the study region and in Vietnam.
The studied area of this studies is the coastal region of Vietnam including 4 provinces Ha Tinh, Quang Binh, Quang Tri, and Thua Thien Hue (Figure 1). With a complex geographical location and characteristics, the central coastal region of Vietnam, especially the North Central region (from Ha Tinh to Hue province), is one of the places most affected by natural disasters. Statistics from MONRE in 2020 show that these provinces have been affected by at least seven types of natural disasters and hazards, including storms, floods, droughts, landslides, cyclones, saltwater intrusion, and riverbank erosion.
During 1998-2018, the region suffered 353 different large and small natural disasters. In this Central region, disasters have destroyed critical agricultural assets and infrastructure, and they cause losses in the production of crops, livestock, and legal products [6-9]. They can change agricultural trade flows and cause losses in agricultural–dependent manufacturing sub-sectors such as food processing industries. It is clear that natural disasters have had a significant impact on the livelihoods of households, and the best response for vulnerable communities is to increase disaster preparedness and promote resilient, sustainable livelihoods for them. In the context where agriculture and fishery are the two main production systems, mainly based on water (both quantity and quality), accumulated experience in dealing with natural disasters, including knowledge indigenous peoples have a decisive role in maintaining their lives and livelihoods [10].
Climate changes in the central coastal region is forecast to lower agricultural productivity by around 12 percent. Climate change impacts not just agriculture but also farm productivity. In the region, rice output will be reduced by 35.5 percent if sea level increases by 1 meter. The medium scenario for climate change forecasts the output of spring rice by 2050. However, summer rice production might fall by around 705 kg/hectare. The overall rice production will be reduced by 275,000 tons. The production of maize may be decreased by 579 kg/hectare, which is an output of 98,000 tons overall decline [8, 10].
Source: [2]
Figure 1. Study area - 4 central coastal provinces in Vietnam
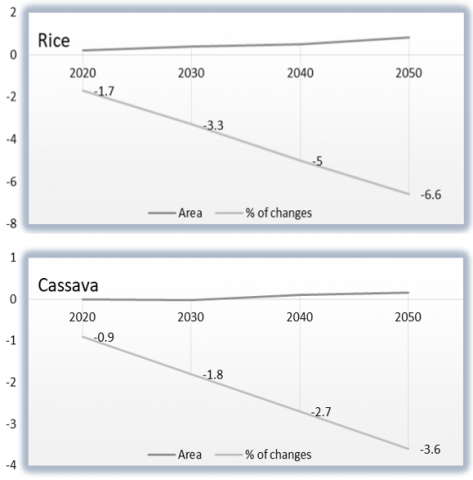
In addition, many of areas of the Central Vietnam will be plunged into the sea by 2070, with significant effects on the fisheries industry. The increase in the sea level may harm aquaculture in ponds and lakes. Climate change will also diminish fisheries' variety and impair the quality of the soil. The prediction of rice and cassava area and productivity changes in 2050 in this region due to climate change can be seen in Figure 2.
Source: [18]
(*Negative values represent the possibility of the area and productivity decline, expressed by % of changes between the scenario with and without climate change impact).
Figure 2. Changes in rice and cassava area and productivity due to climate change
In terms of productivity, it is forecasted that by the end of 2050, the productivity of most product groups will be negatively impacted by climate change. Although productivity is expected to increase both with and without climate change impacts, productivity growth will be lower under climate change conditions. For example, by 2050, maize yields are expected to decrease by 14% due to climate change. Other product groups are expected to have a yield gap of 3.2% (cassava) [18]. In general, changes in yield vary widely among these crops. The effects of climate change on livestock production are assumed to be adverse and varied for each type of livestock. The impact of climate change on pig farming is more pronounced than on other livestock (including cows, poultry, sheep, etc.). Pig farming is expected to decrease by 6.2% of the total amount of climate shocks that are not considered. Overall, climate change is expected to negatively affect the productivity of all production systems in the studed region [19, 20].
3.1 Analytical framework to assess climate change perception, livelihood and adaptive capacity
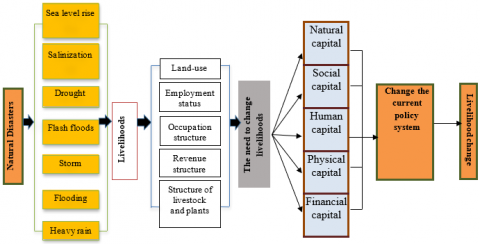
The study focuses on assessing the awareness of local farmers about the impacts of natural disasters and adaptation solutions at the household level with four main activities, including agriculture, livestock, aquaculture, and fishing during the period 2015-2020 (Figure 3). The specific research content is as follows:
First, we assess the impact of natural disasters through 6 leading indicators: Percentage of households with family members injured in the recent disaster, Percentage of households with family member death in the recent disaster, Percentage of households reporting livestock loss due to disaster, Percentage of households reporting assets loss due to disaster, Percentage of households reporting not received early warning information, Frequency of disasters occurrence and Degree of their impact on the four agricultural activities mentioned above.
The choice of impacts of disasters on agricultural production systems and livelihoods can be interpreted according to the following logic:
1. Climate change may increase natural disasters: Heavy rain causes floods, landslides on riverbanks and coasts; Droughts lead to water shortages for irrigation and domestic use, depleting rivers and streams, and can lead to increased saltwater intrusion [21, 22].
2. An increase in natural disasters will adversely affect agricultural production systems and livelihoods: Loss of land due to landslides, degradation, or land-use change due to saline intrusion [23].
3. The impacts of natural disasters may disrupt the balance of the existing livelihood system, upset the living activities of the community, and even cause the loss of some traditional livelihoods [24, 25].
4. Consequently, to survive, the community must know how to adapt to new living conditions by applying accumulated experiences to adapt or switch to a new, more suitable livelihood [11, 26].
Second, we assess the adaptive capacity of local farmers to the impacts of disasters through 5 sources of livelihood capital and the adaptation methods that households have used.
The study uses the [27] assessment framework for adaptive capacity and sustainable livelihoods to assess the disaster resilience capacity of households. According to this framework, local people in vulnerable contexts have to face shocks, risks, and anomalies that directly affect their livelihoods and lives. Therefore, to overcome and ensure life, each household must have a livelihood strategy based on resources in the socio-economic context and certain local policies [28].
Each household has five sources of livelihood capital: natural, social, human, physical, and financial capital. Each household will decide to change the family's livelihood based on this combination of capital in the context of disaster impacts.
The set of criteria representing each type of capital is determined as follows:
• Natural capital: includes land, forest resources, water, and biological systems. When faced with the risks of natural disasters leading to damage to agricultural and aquaculture production, households may have to sell or rent some of these assets for money. Or the household can change the form of land use or farming method to reduce investment in agricultural production and aquaculture [29]. Changes in the way households use natural capital can lead to different consequences for households; for example, the sale of arable land means that the household will not be able to farm in the future, which seriously affects their livelihood [30].
Source: [27]
Figure 3. The conceptual framework for disaster impact assessment and adaptive household practice
• Social capital: when facing difficulties due to the impact of disasters, households may have to ask for help from family, clans, friends, or groups. The forms of help are very diverse. It can be cash or in-kind such as clothes, food, medicine [31]. These supports can help households overcome their difficulties and improve their resilience instead of selling their land or assets to move elsewhere to earn a living. This can have unintended consequences such as an inability to pay off debt or fall into a poverty trap [32, 33].
• Human capital: in a difficult situation, household members can use their knowledge (through education, training, vocational training) to earn other livelihoods. Households may have to sell their labor to work for people in the village or elsewhere [34].
• Financial capital: when facing difficulties, households may have to use the available capital or borrow capital to invest in production and business and find alternative sources of income. Households may have to cut their expenses, affecting some aspects of their lives. For example, due to income difficulties, households may have to reduce investment in their children's education or even force their children to drop out of school; or the household may not have money to treat the illness of its members when they are sick [5, 35].
• Physical capital: refers to household items, equipment for production such as dryers for agricultural products, water pumps, infrastructure, livestock barns, have been damaged by natural disasters? Households may have to sell or rent out their house, means of production, and household items to earn income. The consequences of such actions are very large that the household may not have a good place to live in the future. The sale of means of production will lead to a significant reduction in the household's productive capacity [36, 37].
3.1.1 Approaches to assess adaptive capacity by IPCC
The study also uses the method to assess adaptive capacity of households by IPCC [38]. According to IPCCC, vulnerability to climate change is defined as “the degree to which a system is susceptible to or unable to cope with the effects of climate change, including climate change and extremes”. IPCC has also identified three variables needed to assess vulnerability: exposure, sensitivity and adaptive capacity. Exposure (E) is the nature and extent to which a system is exposed to significant changes in climate. Sensitivity (S) is the degree to which a system is affected either for good or bad by climate-related agents. Adaptive capacity (AC) reflects the ability of a system to adapt to climate change (including extreme events) or to mitigate its potential damage.
In this study, we have selected a combination of adaptive capacity indicators from the studies of Ardaya et al [39], Hahn et al. [40] and Urothody [41]. Then we interviewed experts on vulnerability, climate change and livelihoods to filter out 6 most suitable indicators for assessing the adaptive capacity of households at study site including: Household income per month (AC1), Dependency ratio (AC2); Rate of poor households (AC3); Percentage of households with head having no secondary school (AC4), Access to information (radio, television, internet) (AC5), Percentage of households who have burden of loan (AC6).
3.2 Data collection
3.2.1 Primary data
A survey was conducted in November and December 2020 in the four studied provinces. To ensure the communes' representativeness, we first randomly selected four coastal districts in 4 studied provinces. Then, 16 coastal communes in those four districts were selected (Table 1). The household samples were selected in two stages. First, we did a household spatial mapping in each sample commune. Then, in the second stage, we selected households in each village using simple random sampling based on a list of households provided by the communes' People Committee (local Government) [10].
The study chooses the research period from 2015-2020 because, during this period, many typical natural disasters have occurred that strongly affect the household's livelihoods. For example, in 2015, in Quang Binh, Quang Tri, and Hue provinces, a historic flood engulfed many districts and cities. By 2016, when the consequences of Typhoon No. 10 had not yet been overcome, the area was again subjected to Typhoon No. 11 and exceptionally large floods, exceeding the historic flood peaks in 2006 and 2010, causing many houses to be heavily flooded with great damage to people and property [18, 19]. In addition, research results from 2015-2020 show the changes in the frequency of occurrence and impact of natural disasters, so households might have to change their types of livelihood or apply inherent life experiences to self-adapt to disasters [2, 10, 20].
Table 1. Study area categorized by districts and communes
|
District |
Research communes, wards, and towns |
|
HA TINH |
|
|
Ky Anh |
Ky Khang, Ky Loi, Ky Ha, Ky An Town |
|
QUANG BINH |
|
|
Quang Ninh |
Hai Ninh, Vo Ninh, An Ninh, Van Ninh |
|
QUANG TRI |
|
|
Vinh Linh |
Vinh Thai, Vinh Kim, Vinh Thach, Vinh Quang |
|
THUA THIEN HUE |
|
|
Phong Dien |
Dien Huong, Dien Mon, Dien Loc, Dien Hoa |
According to PATA Vietnam [10], 58,910 people live in 16 studied communes with about 11,872 households (on average, each household has 5.0 people). The study uses the following formula [42] to estimate the number of survey samples:
$n=\frac{N}{1+N e^{2}}$
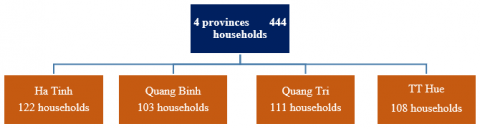
In it, n is the sample size, N is the total number of households in the population, e is accepted errors. With e=0.05 (the estimated error is 5%) and for a total population of 11,872 households, the estimated number of samples to ensure reliability is 444. Thus, 444 households were chosen (3.3% of total households) for interviews. To ensure the representation, in each commune, researchers selected 3.2% households for the survey. The number of research samples by province is allocated as in Figure 4.
Questionnaire is a crucial tool in collecting information and data for analysis. In this study, the research team designed a questionnaire according to the standard procedure of Creswell (2014) and information collected from indepth interviews with key informants (local authorities, livelihood management agencies, farmers, NGOs). After the questionnaire was developed and tested, the study surveyed 444 households in 4 provinces. The questionnaire consists of 4 main parts focusing on the following main aspects:
Part 1: Social-economic characteristics of households
Part 2: Perception and attitude of households toward natural disasters, climate change and their impacts to households’ livelihoods
Part 3: Adaptation practices to natural disasters of household
Part 4: Adaptive capacity to disasters of households.
As mention above, the study also conducted ten in-depth interviews with key informants) to better understand the livelihood activities, experiences, and perceptions of local farmers in coping with impacts of disasters, their challenges facing as well as status and proposed supporting activities of local state agencies for local villagers in disaster resilience.
3.2.2 Secondary data
It is not easy to find primary data on the impacts of disasters at the community level in Vietnam. Extrapolating which impacts and adaptation response are due to disasters on farmer's livelihoods is not a simple matter.
Thus, the methodology used in this study consist of reviewing documents, coupled with information collected from different interviews with local public officers. In the first step, analysis reports from experts having worked on the issue were studied. Limited in number, these reports come from World Bank [2], GIZ [9], FAOSTAT [4], Ministry of Environment and Natural Resource (MONRE) [21] and Give2Asia [22].
Secondly, critical reviews were done by comparing the result of desk studies with information collected from field surveys carried out in parallel. The authors have met with local stakeholders and public officers in these fields and discussed the impacts of natural disasters on local livelihoods.
Figure 4. Distribution of survey sample by provinces
4.1 Socio-economic characteristics and capitals of households
Table 2 summarizes the socio-economic characteristics of the sample. The rate of men and women in the sample is 64% male and 36% female. The average lifetime of households in the villages is 45.7 years. 100% of respondents are Kinh ethnic.
The education level of the respondents in study communes is relatively low. The number of people who finished secondary school accounted for a large proportion, 66,7%. Primary school students account for a relatively small percentage. The rate is similarly low for university/college level (only 3.6%). No one has a post-graduate degree. According to the survey, an average of 5.11 people lives in a household (this variable is quite similar in all communes). The largest family has eight people and at least two people. The average household income is 86.7 million VND/household/year. The lowest income level of the household is 48.2 million VND/household/year, and the highest income level is 300 million VND/household/year.
With the main occupation, the majority of the people in the villages are farmers, growing rice, husbandry, aquaculture, and fishing. Other occupations rate is very low—only 2.3% of households gathering firewood and hunting. About 3.1% does civil-related jobs such as security, or work in cooperatives, district, authority agencies.
Table 2. Socio-economic characteristics of the sample
|
Socio – Economic Variables |
|
|
Gender |
|
|
Female |
36% |
|
Male |
64% |
|
Age |
45.1 |
|
Ethnicity |
|
|
Kinh |
100% |
|
How long has household lived in the village (year) |
45.7 |
|
Education level of head of household (years of shooling) |
7.8 |
|
Total income of the household per year (million VND) |
86.7 |
|
Main occupation of the household |
|
|
Gathering firewood and hunting |
2.1% |
|
Hotels, services, tourism, restaurants, cafes |
3.5% |
|
Farmers |
91.3% |
|
Civil servants, office workers (or no job) |
3.1% |
|
Number of family members |
5.11 |
4.1.1 Human capital
The survey shows that, on average, each household has 4-5 members, including two main workers and 2-3 dependents. Thus, each main member is responsible for at least one other family member. Education level: over 65% of household members have an average level of education at the secondary level, 3.6% have college and university degrees, and 1.2% of respondents have graduate degrees. However, among 3.6% of people with college and university degrees, most are in school, so they are not the main source of labor in the family.
Thereby, it is shown that with an education level of only secondary level, plus the pressure on the number of dependents in the family, will cause many difficulties for households when they want to create sustainable livelihoods. This shows that although human capital is abundant, the number of dependent workers is still high, and the education level is low. So that livelihoods will be vulnerable to the harmful effects of natural disasters. Since jobs are limited, the income from the main workers is not enough to support the family.
4.1.2 Physical capital
Housing characteristics: according to the survey results, 71.9% of the 444 households interviewed have grade 4 houses with tile roofs; 14.1% of houses with solid flat roofs; 11.9% of houses are simple, and only 2.2% are solid multi-story houses. Since this is an area regularly affected by natural disasters, especially floods, every house has an elevated space to move people and furniture up there when there is an emergency. Moreover, after the historic flood in 2015, the local Government has also mobilized households to build houses higher than the peaks of the floods and actively strengthen their houses before the flood season.
Means of subsistence: poor households have fewer means of subsistence than those with good conditions. Most households have a television (4% do not have one) and a rice cooker (8% do not have one). While other household appliances such as refrigerators, washing machines, air conditioners, and water heaters are only under 10% of households, have new conditions.
Thus, poor households are the most vulnerable in terms of physical capital because they lack production means, especially those to serve in natural disasters such as floods, storms, and floods.
4.1.3 Financial capital
Income-generating activities: the income of people in the study area is mainly from agricultural production activities, including cultivation, animal husbandry, and aquaculture. Depending on whether the means of production are arable land or cultivated water surface, households have corresponding livelihoods.
In addition, some households have income from other activities such as small trade, knitting nets, going fishing, logging to the forest, and exporting labor, accounting for about 27% of the households surveyed. Some households have additional jobs such as fishing to improve their lives in the flood season, especially poor households lacking productive land and having no money to accumulate.
Household income: the lowest household income is 1,000,000 VND/month, and the highest is 50,000,000 VND/month. On average, households have an average monthly income ranging from 7 to 10,000,000 VND. Out of 444 interviewed households, 72 were poor households (16%) and 40 near-poor households (9%). Of that total, there are 82 households with family members working far away.
It can be said that related to financial capital, apart from 27% of the surveyed households whose main source of income is from non-agricultural occupations, the majority of households do not have a job. Therefore, they cannot stabilize in natural disasters, leading to low income, especially for the poor and near-poor households.
4.1.4 Natural capital
Area of arable land: this is considered an important source of capital for households and significantly determines the vulnerability of households' livelihoods. When a household has many productive lands, their income will be accumulated to reduce the vulnerability to disasters. According to survey data, on average, each household has about 2,000 m2 (equivalent to 0.2 hectares). The smallest arable land area of the household is 180 m2, and the largest is 32,800 m2. Cultivated land is mainly used for growing rice, vegetables, and freshwater aquaculture. However, in the period from 2015 to 2020, 82 households (21.1%) changed the purpose of land use for various reasons, of which the main ones were leasing land and switching from farmland to seafood farming.
Production model: rice cultivation is the most common type of production of households, accounting for nearly 80% of the total number of households surveyed, more dominant than growing vegetables and flowers (below 5%). The main livestock activities are pig raising (38.1%) and poultry (15.3%).
It can be assessed that the natural capital of households is low, as shown by the low average arable land area of each household, only 0.2 hectare.
4.1.5 Social capital
Participating in organizations: 22.2% of households have a member who joins the political party, 45.2% of households are members of Farmers' Union, 69.6% participating in Women's Union and Veterans' Association. This is considered an important source in disseminating, propagating, and mobilizing people to participate in the warning and preventing disasters in the locality.
Sources of help in times of difficulty: when facing economic difficulties, especially when suffering from disasters, an important source of help is from relatives and community, in addition, there is support from local authorities in the form of cash or in-kind (on average, one person receives a package of instant noodles or 1 kg of rice per household) or loans with low-interest rates to poor households.
Social capital is quite good due to its high community character, and local authorities have also provided active support. Still, that support is not enough to help households overcome difficulties when facing with negative effects of natural disasters.
4.2 Perception of farmers about natural disasters in the period 2015-2020 and their impacts
4.2.1 General perception of households on natural disasters and impacts to family
Table 3 presents the results of general awareness of local people about natural disasters and their impacts on households divided by 4 provinces in the study area. As a result, natural disasters over the past 5 years have caused relatively high injury rates in all 4 provinces. This rate is highest in Ha Tinh with 20.4% of households reporting injury after natural disasters, and lowest in Thua Thien Hue (15.4%).
Natural disasters also cause loss of life for communities with the percentage of households reporting death after the last disaster ranging from 0.6% to 1.2%. In particular, natural disasters have caused losses in poultry and property for the majority of households. Up to 65% of households in Quang Tri reported property damage after the latest natural disaster (the highest level) while this figure in Ha Tinh, Quang Binh and Thua Thien Hue was 55.5%, 60.3% and 59.7% respectively. The survey results also show that a large proportion of households do not receive early disaster warning information. Quang Tri is still the province with the highest rate (26.5%) and the lowest is Ha Tinh (20.2%). There is a certain correlation between receiving early warning information and damage caused by disasters.
4.2.2 Perception on frequency of occurrence of natural disasters
The frequency of natural disasters is assessed based on the proportion of households aware of the occurrence and trend of the disasters. The survey results show that, compared to 2015, disasters such as heavy rain, drought, and flooding are perceived by households to be more frequent than other phenomena (57.8%, 47.6%, and 42.6%, respectively). 47.2% of people think that the frequency of storms is less, but the intensity of each storm has increased significantly, including Typhoon Wutip, also known as typhoon No. 10, in October 2015. Quang Binh is considered the center of the storm with gusts above level 10. Table 4 below shows people's perception of the frequency of natural disasters compared to 2015.
Based on Table 3, two phenomena of sea-level rise and flash flood have the highest number of households choosing the "don't know/don't have" option. However, a small percentage of households still choose the "less or the same" and "more" options, which people's insufficient awareness can explain, or some may misinterpret or misunderstand phenomena. As for sea-level rise, it's happening more globally. But, at a slow rate, at a small scale like a commune, it's hard for people to notice the rise of seawater. Therefore, for 2015-2020, the frequency of occurrence of these phenomena is assessed at a low level (Figure 5).
Figure 5. People's perception of the frequency of natural disasters compared to 2015
Table 3. Farmer perception on natural disasters and impacts to family (%)
|
|
Provinces |
Ha Tinh |
Quang Binh |
Quang Tri |
Thua Thien Hue |
|
1 |
Percentage of households with family member injured in recent disaster |
20.4 |
18.3 |
21.8 |
15.4 |
|
2 |
Percentage of households with family member death in recent disaster |
0.8 |
1.2 |
1.5 |
0.6 |
|
3 |
Percentage of households reporting livestock loss due to disaster |
33.8 |
26.5 |
29.1 |
25.7 |
|
4 |
Percentage of households reporting assets loss due to disaster |
55.4 |
60.3 |
65.1 |
59.7 |
|
5 |
Percentage of households reporting not received early warning information |
20.2 |
23.7 |
26.5 |
22.1 |
Table 4. People's perception of the frequency of natural disasters compared to 2015 (%)
|
Frequency Events |
Less |
Same |
More |
No information/None |
|
Sea level rise |
4.2 |
3.9 |
6.1 |
85.8 |
|
Salinization |
8.4 |
12.6 |
28.7 |
50.3 |
|
Droughts |
18.2 |
31.5 |
47.6 |
2.7 |
|
Flash floods |
0.9 |
1.6 |
1.1 |
96.4 |
|
Storms |
47.2 |
14.1 |
31.7 |
7 |
|
Floodings |
34.2 |
13.7 |
42.6 |
9.5 |
|
Heavy rains |
12.1 |
21.7 |
57.8 |
8.4 |
For inundation, since the rate of choosing "more than previously" is 42.6%, the frequency of occurrence is assessed as high. Droughts and heavy rains have a high frequency based on a high percentage of selected households (57% and 47%, respectively).
4.2.3 Impact of natural disasters on farming
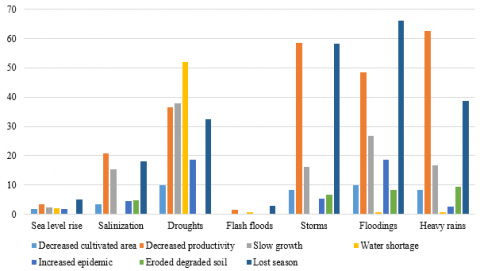
Table 5 shows people's perception of the impacts of natural disasters on household farming in the period 2015-2020. According to households, the disasters that significantly affect agricultural cultivation are storms, floods, heavy rains, and droughts. Saline intrusion has a low impact, mainly on yield reduction. Phenomena such as the sea-level rise and flash floods have little or no effect. Manifestations of the effects of these phenomena are reduced yield, slow plant growth, lack of irrigation water, and many diseases (Figure 6).
Figure 6. People's perception of the impact of disasters on household farming
4.2.4 Impact of natural disasters on livestock
The storm is the kind of disaster affecting the livestock production activities of farmers the most. Of the households surveyed, 62.1% said storms damaged barns, 14.9% said that storms reduce productivity. In addition, storms are also the reason that makes finding food sources for livestock difficult. Heavy rain also negatively affects livestock production, with 25.4% of the respondents saying that heavy rains make it difficult to find food sources and 15.4% saying that it damages livestock barns. Flooding is also a cause of damage to livestock production, washing away livestock and poultry. Among the causes of litter loss, flooding accounts for the highest rate, with 20.9% of the respondents. Besides, prolonged drought is also the cause of slow growth of livestock, reduced productivity, and an increase in disease outbreaks, with the percentage of respondents agreeing with 14.9%, 15.4%, and 13.4%, respectively, as shown in Table 6.
Other phenomena such as flash floods, saltwater intrusion, and sea-level rise have almost no impact on livestock production in the study area. Very few percent of the households' comments are noted.
4.2.5 Impact of natural disasters on aquaculture
In general, aquaculture depends a lot on natural conditions, and natural disasters greatly affect the productivity and efficiency of aquaculture. The most significant impacts come from flooding. Inundation can destroy an entire aquaculture crop. Up to 60% of respondents have the same opinion; 36%, 16%, and 20% of the households said that flooding reduces productivity, changes the water environment, and increases disease outbreaks. However, some households believe that small floods also positively affect when they bring more fish, especially in downstream areas. Details are shown in Table 7.
Table 5. People's perception of the impacts of natural disasters on household farming in the period 2015-2020 (%)
|
Decreased cultivated area |
Decreased productivity |
Slow growth |
Water shortage |
Increased epidemic |
Eroded degraded soil |
Lost season |
|
|
Sea level rise |
1.7 |
3.5 |
2.4 |
2.1 |
1.7 |
0 |
5.1 |
|
Salinization |
3.5 |
20.8 |
15.4 |
0 |
4.5 |
4.8 |
18 |
|
Droughts |
9.8 |
36.5 |
38 |
52 |
18.5 |
0 |
32.4 |
|
Flash floods |
0 |
1.4 |
0 |
0.8 |
0 |
0 |
2.8 |
|
Storms |
8.3 |
58.6 |
16.2 |
0 |
5.2 |
6.8 |
58.2 |
|
Floodings |
9.8 |
48.6 |
26.8 |
0.8 |
18.5 |
8.2 |
66.2 |
|
Heavy rains |
8.2 |
62.6 |
16.7 |
0.8 |
2.7 |
9.4 |
38.6 |
Note: Ms. Le Thi Nay (age 58), Quang Tri Province' Twenty years ago, farming was easy because the weather was predictable. Back then, the dry season was not so hot, and there was less flooding. Last year, my first rice crop was lost due to early flooding. My family can only get about 200 kg, but the rice is of poor quality and has to be fed to pigs. This year, it was so cold that all the seedlings died. Now I grow sweet potatoes in the rice fields, half for food, half for winter, and leaves to feed pigs. Sweet potatoes are better tolerant of the dry season than rice, but they cannot tolerate flooding. My house has a wooden loft that has been used as a flood-proof floor since 1990. We have to make sure we have enough food for ten days when the flood season comes. We are very worried about the weather. This year, there may be hunger because they cannot grow rice, so many people in the village now go to the forest to collect wood or find metal fragments or landmines leftover from the war. Sometimes earning 100,000 VND a day, but very dangerous. I haven't gone for a few years, but I've seen people say it's hard to find scraps now ".
Table 6. People's perception of the impact of natural disasters on livestock production of households in the period 2015-2020 (%)
|
Slow growth |
Decreased productivity |
Water shortage |
Increased epidemic |
Limited food sources |
Harvested lost |
Broken livestock barn |
|
|
Sea level rise |
0 |
0 |
1.5 |
0 |
1.5 |
0 |
3 |
|
Salinization |
1.5 |
0 |
1.5 |
0 |
3 |
3 |
0 |
|
Droughts |
14.9 |
15.4 |
25.4 |
13.4 |
14.9 |
3 |
3 |
|
Flash floods |
0 |
3 |
0 |
1.5 |
0 |
3 |
4.5 |
|
Storms |
9 |
14.9 |
4.5 |
6 |
15.4 |
6 |
62.1 |
|
Floodings |
15.4 |
17.9 |
9 |
19.4 |
19.4 |
20.9 |
25.4 |
|
Heavy rains |
6 |
13.4 |
6 |
10.4 |
25.4 |
3 |
15.4 |
Table 7. People's perception of the impacts of natural disasters on household aquaculture in the period 2015-2020
|
Slow growth |
Decreased productivity |
Changing water environment |
Increased epidemic |
Limited food sources |
Harvested lost |
|
|
Sea level rise |
0 |
4 |
4 |
0 |
0 |
4 |
|
Salinization |
24 |
16 |
24 |
12 |
0 |
0 |
|
Droughts |
40 |
32 |
36 |
8 |
0 |
16 |
|
Flash floods |
0 |
0 |
0 |
4 |
0 |
0 |
|
Storms |
4 |
40 |
12 |
4 |
8 |
48 |
|
Floodings |
4 |
36 |
16 |
20 |
0 |
60 |
|
Heavy rains |
0 |
48 |
20 |
12 |
4 |
52 |
Table 8. People's perception of the impacts of natural disasters on household fishing in the period 2015 – 2020 (%)
|
|
Slow growth |
Decreased output |
Changed fishing area |
|
Sea level rise |
0 |
5 |
5 |
|
Salinization |
5 |
30 |
0 |
|
Droughts |
0 |
40 |
15 |
|
Flash floods |
5 |
5 |
0 |
|
Storms |
0 |
35 |
10 |
|
Floodings |
0 |
30 |
15 |
|
Heavy rains |
0 |
35 |
0 |
Note: Mr. Vo Viet Gia, 39 years old, lives with his wife and five sons in the coastal village of My Thuy, Hai An commune (Quang Tri). His main occupation is fishing for hire. If he catches a lot of fish, he earns 50,000-70,000 VND/day. When he can't go fishing, he works as a hired hand or a porter and earns about 30,000 VND/day. "I'm very worried about the weather changes in the last three years. When there is a storm, the house is rickety, the strong wind may collapse or lose the roof, and I do not go fishing to earn money. The wind at sea is stronger, and there are more storms out there. Typhoons usually come in from September or October, but recently there have been storms in March and April. Due to adverse weather, we were at the beach less than three years ago. I remember this year's cold snap was the worst. It was too cold, that time took about 20 days. I couldn't go to the beach and didn't have a job. My son can't stand the cold. Relatives and relatives gave us more clothes, but all of them were thin. I have to work as a hired hand and a porter, but I earn less. Life is so difficult because my wife has had tuberculosis for three years now, although she has been treated for eight months now and is better now. I have kidney disease, so treatment is expensive. My family often has to borrow money from relatives. Now I'm in debt VND 4 millions.
Table 9. Adaptive capacity of households in the study area
|
|
Provinces |
Ha Tinh |
Quang Binh |
Quang Tri |
Thua Thien Hue |
|
1 |
Household income per year (million VND) |
90.4 |
100.3 |
88.5 |
94.4 |
|
2 |
Dependency ratio (%) |
24.2 |
30.6 |
35.4 |
29.8 |
|
3 |
Rate of poor and near poor households (%) |
18.6 |
22.7 |
20.4 |
23.1 |
|
4 |
Percentage of households with the head having no secondary school (%) |
32.1 |
27.5 |
29.8 |
24.3 |
|
5 |
Access to information (radio, television, internet) (%) |
75.7 |
69.7 |
68.5 |
70.1 |
|
6 |
Percentage of households who have the burden of loan (%) |
30.8 |
20.6 |
28.1 |
27.2 |
Heavy rain is also the main cause of loss of aquaculture productivity, with 52% of the surveyed households saying so. In addition, drought slows the development of aquatic products, reduces productivity, and further changes the aquatic environment. Sea level rise, saltwater intrusion, and flash floods hardly affect aquaculture activities.
4.2.6 Impact of natural disasters on fishing
Fishing activities are not popular because most households do not have fishing facilities such as large-capacity vessels that require a significant investment. Some households have boats, but only small boats for travel during the rainy season. Information and details are shown in Table 8.
According to the survey, most households believe that natural disasters are the main cause of decreasing fishing output. 40% attributed it to drought, 35% attributed it to storms, the rest due to flooding and heavy rain. Storms cause negative effects as above and risk losing fishing nets, possibly even capsizing boats. In addition, 15% of respondents said that drought changes fishing areas, leading people to change their fishing range and look for new fishing places.
4.3 Adaptation measures of farmers to the impact of natural disasters
Under the impact of disasters, local households have made changes in agricultural production to improve their resilience. The most frequently used method is spending more on labor (69.6%) and investing more in costs (58.3%). People have to put in more labor because they have to replant and spray pesticides many times.
Changing rice varieties is also widely applied by farmers to cope with disasters. People have chosen short-term rice varieties with high yield and tolerance to salinity and waterlogging to replace traditional rice varieties. Other options such as increasing or decreasing the scale of production, stopping production, or some workers switching to other occupations or moving to other places to work have also occurred in reality but at a lower rate. Even so, up to 7% of the total interviewed households still had to stop their production, which shows that the impacts of natural disasters are very great on agricultural production.
4.3.1 Adaptive solutions in agricultural farming
For agricultural activities, disasters have resulted in a decrease in cultivated area and productivity, slow growth of plants, an increase in diseases, soil erosion, degradation, and crop failure.
Under the impact of unusual natural disasters occurring in the locality, households have made changes in agricultural production to improve their resilience. The method most used is to spend more labor (69.6%) and invest more costs (58.3%). People have to put in more labor because they have to replant and spray pesticides many times.
The plan to change rice varieties is also widely applied by people to cope with disasters. People have chosen short-term rice varieties with high yield and tolerance to salinity and waterlogging to replace traditional rice varieties.
Other options such as increasing or decreasing the production scale, stopping production, or some workers switching to other occupations or moving to other places to work have also occurred at a lower rate. Even so, up to 7% of the total interviewed households still had to stop their production, which shows that the impacts of disasters are very great on agricultural production. The results of in-depth interviews with households with the main source of income from agriculture show some other ways of coping, such as:
• Changes in plant varieties, livestock, and cultivation time must also be recalculated accordingly.
• In farming, households have converted rice varieties from long-term to short-term varieties to harvest in July, before storms come in August and September.
• The system of in-field ditches, irrigation systems has been improved (concrete) and regulates the operation of opening and closing reasonably when there is a flood (opening the drain), when the water dries up (closed to avoid water intrusion).
4.3.2 Adaptive solutions in husbandry
For livestock production, disasters can cause livestock to grow slowly, reduce productivity. Like with agricultural cultivation, local farmers have also actively responded to the most unusual disasters in two forms of higher investment and more labor. The percentage of households polled was almost the same, 63.6% and 62.1%. 12.1% of the total interviewed households have to stop raising livestock. The rest are also done by people but only in the minority.
4.3.3 Adaptive solutions in aquaculture
Aquaculture activities under the impact of natural disasters are negatively affected in many aspects such as slow growth of aquatic products, reduced productivity, changes in water environment due to salinization and pollution, more diseases, and loss of all generations. The two responses that households apply the most are investing more costs (72%) and spending more labor (68%). Next, 12% of the surveyed households have chosen to stop farming due to the economic inability to compensate for the losses, and 8% of households have changed their farming methods. For example, they could grow 2-3 crops/year, but now they only focus on investing in 1 crop. However, this case also has a high risk of losing everything. Then they do not have enough financial resources to overcome the consequences and invest in the next cases. 4% of households choose to change aquatic species; they no longer raise shrimp but switch to fish farming.
In addition, through in-depth interviews, it was found that some new farming methods or farming techniques have been implemented to cope with storms, floods, or increased saline intrusion. Saltwater intrusion has increased compared to previous years but is not stable. In the dry season, the salinity increases; in the rainy season, the salinity decreases. Shrimp farming households must measure the salinity of the water with a meter. If the salinity exceeds 25%, you must buy more freshwater to pump into the lagoon or "add sugar".
Table 10. Adaptive solutions to natural disasters in agricultural activities
|
Response activities |
Agricultural farming |
Livestock |
Aquaculture |
Fishing |
|
Higher investment costs |
58.3 |
63.6 |
72.0 |
30.0 |
|
Higher labour |
69.6 |
62.1 |
68.0 |
45.0 |
|
Changing farming/breeding/fishing methods |
8.7 |
3.0 |
8.0 |
10.0 |
|
Changing plant/livestock varieties |
3.5 |
3.0 |
4.0 |
15.0 |
|
Increased scale of farming/fishing |
0.9 |
1.5 |
0 |
5.0 |
|
Decreased scale of farming/fishing |
7.0 |
12.1 |
4.0 |
20.0 |
|
Stop farming/fishing activities |
0.9 |
4.5 |
12.0 |
15.0 |
|
Household laborers move to other occupations |
1.7 |
0 |
0 |
0 |
|
Workers move to another locality |
1.2 |
1.8 |
0 |
0 |
|
No changing |
13.9 |
21.5 |
0 |
25.0 |
In aquaculture, people apply a new method - intensive farming, counting the main season as the rainy season and the off-season as the rainy and stormy season. They are mainly raised during the main season. Some households do not raise any more in the off-season. If aquaculture is off-season, it is necessary to take countermeasures such as spreading nets around ponds and lakes to avoid floods and storms washing away aquatic products.
4.3.4 Adaptive solutions in fishing
Only a small percentage of households in the study area have income from this activity and wage labor for fishing activities. However, natural disasters still cause such harms such as catches will be reduced, fishing areas will be changed. 45% of households have spent more on investing in offshore fishing tools or repairing and upgrading fishing boats. However, among the interviewed households, a large proportion (25%) have not changed or done anything to cope with more labor-intensive tasks such as long fishing time. And 30% of households have already experienced the impacts of natural disasters. Most of them desperately want change but do not know how to do it themselves due to a lack of financial resources and labor force.
4.3.5 Adaptability through the use of indigenous knowledge
In responding to natural disasters, people have applied their experiences and knowledge to help them less vulnerable to damage caused by storms, floods, or saltwater intrusion to survive or "live" with storms, floods, saltwater intrusion. Local farmers have experience in weather forecasting, agricultural cultivation, and aquaculture. Field survey indicates some findings as follows:
• In the weather forecast
People base on the signs of plant growth, the daily activities of animals to predict weather phenomena. Based on the signs of clouds, sky, moon, and stars, people judge whether the rain or wind is accompanied or followed to prepare for agricultural production and aquaculture jobs.
• In agricultural cultivation
In farming, they convert rice varieties from long-day to short-day varieties for harvesting in July, before storms come in August and September. This is the experience drawn from the production process over the years faced with storms and floods. New rice varieties with higher salinity tolerance have been used for cultivation to increase soil salinity intrusion. When salinity increased, rice plants grew slowly. The cropping schedule was adjusted in the direction of planting earlier than in other localities.
For vegetables, some households can afford to buy more ethylene nets to spread rain nets to prevent vegetables from being crushed. This is also known as the clean vegetable growing method. This method has only appeared locally in the last few years.
New livestock and plants suitable for changing conditions such as increased flooding and salinity have been studied and put into production: field crabs, stuffed snails, Centella Asiatica. People have imparted knowledge about farming from other localities (some areas of Thua Thien Hue province) and thought about the suitability of new livestock and plant varieties to the conditions of climate change
• In aquaculture
If having knowledge and experience, the farmers must measure the salinity of the water by measuring the salinity of the water in raising shrimp. If the salinity exceeds 25%, they will buy more freshwater to pump into the lagoon or "add sugar".
In aquaculture, a new method - intensive farming is applied, counting the main farming season as the rainy season and the off-season as the rainy and stormy season, mainly raised during the main season. Some households do not raise anymore in the off-season. If there are households, off-season aquaculture, it is necessary to take countermeasures such as spreading nets around ponds and lakes to prevent floods and storms from washing away aquatic products. Large-scale farming families have responded by renovating the infrastructure according to new experiences such as building walls, spreading high nets around ponds and lakes to avoid rainstorms, and washed away aquatic products.
In shrimp farming, shrimp are susceptible to diseases, so in a storm, people have to sprinkle lime powder to neutralize the water and avoid diseases for shrimp. They also use a fan to pump more air into the tank when it rains (called aeration). In addition, many households have a form of fish farming on the river tributaries. They were applying the method of fastening the fish rafts by driving piles above and below, fastening the rafts to avoid drifting during storms and floods.
• Share knowledge and experiences
Folk experiences are still transmitted orally. People have less experience in weather forecasting than in other provinces. They mainly listen to TV and radio speakers to know about the weather. Perhaps, aquaculture requires large capital investment and high risk, so people have been careful to only believe and update weather information from hydrometeorological forecasting agencies on television, radio, newspaper, but little use of local experience in weather as in agricultural production.
Thus, aquaculture is the production activity with the highest adaptive capacity because households have diverse forms of proactive response to adverse events of natural disasters. Income sources of households are also not affected by natural disasters. Agricultural farming has the second-highest adaptive capacity.
In summary, the analysis also shows that the occupational structure of surveyed households is changing. However, the proportion is not high. It is a sign that natural disasters are gradually affecting the occupation of households and oblige them to change for adaptation.
Vietnam is one of the countries most heavily affected by natural disasters and climate change in Asia Pacific region. Of all natural disasters, storms and floods are the most frequent and dangerous. Especially in recent years, extreme natural disasters have occurred more often, causing more loss of life and a significant impact on the national economy.
With a strong institutional structure and a well-defined legislative and regulatory framework for disaster risk management, Vietnam has achieved great progress in reducing the country's vulnerability to catastrophe. Local governments play an important role in emergency preparedness and response. However, damage assessment and disaster response plans implementation are hampered by a lack of capacity, tools, and funds.
As a result of this study, low-income and vulnerable farming households have fairly high perception on the impacts of disasters to their livelihoods but having low capacity of adaptation due to lack of relating capital (e.g. financial capital and human capital). The ongoing natural disasters are increasingly severe and erratic in the central coastal provinces. Compared to before 2015, natural disasters such as heavy rain, drought, and flooding are perceived by households as occurs more often than other phenomena, especially heavy rain and drought. The frequency of storms is less, but the intensity of each storm increases significantly, causing serious damage to community life and livelihood.
Natural disasters affect people's production activities to different degrees. According to surveyed households, disasters have caused many adverse impacts on livelihood activities at different levels, from low, moderate, to high. Floods cause the most impact and damage, followed by drought and heavy rain. Agriculture and livestock farming are most affected by floods, followed by aquaculture and fishing.
At the grass-root level, the research shows that limits and barriers to local adaptation generally fall into three related categories. Lack of access to information by local people has restricted improvements in knowledge, understanding, and skills. Lack of capacities and skills also has been identified as a limiting factor for effective local adaptation actions. In financial terms, microfinance services typically do not reach the poorest and most vulnerable groups at local levels who have urgent and immediate needs to be addressed. At the same time, the ability of a community to ensure equitable access and entitlement to key resources and assets is a key factor in building local adaptive capacity. As a result, they have to suffer agricultural output and assets losses. When calamities strike, those in low-income groups are more likely to be pushed back into poverty. The emphasis on catastrophe emergency management implies that long-term recovery and resilience development are still lacking.
Local people have made changes to adapt to the impacts of the disaster. Natural disasters have changed the income structure of households, and they have to self-regulate with adaptive measures. Aquaculture households have the most diverse and proactive responses, followed by agricultural farming, animal husbandry, and fishing. People have also applied indigenous knowledge in weather forecasting as well as in daily agricultural activities. However, for high-risk production areas that require large investment capital, people trust the mass media and official information channels with higher reliability and accuracy.
The main challenge for local adaptation to natural disasters is to find a good balance of measures. These measures must simultaneously address fundamental issues related to enhancing local collective actions and creating subsidiary structures at national and provincial scales that complement such local actions.
Based on the above findings, some recommendations are raised as following:
Firstly, adaptation solutions include both the Government's macro-level solutions (such as plans and policies adjusted annually to match the evolution of natural disasters) and specific solutions of households and communities (converting crop structure, adjusting seasons, hoarding animal feed, raising animals in captivity, reinforcing barns). Preparing disaster risk management strategies to reduce exposure, promoting climate change adaptation strategies, and strengthening adaptive capacity of farm households should be top priority.
Secondly, this study has shown that the lack of adaptive capacity of local people (socio-economic, social networks, livelihood strategies) is a main cause of climate change vulnerability. Thus, their capacity needs to be improved so that they can make choices and turn these choices into actions to respond to climate change/disaster to ensure more stable current and future livelihoods. It would be good if local governments encourage increasing investments in education and income diversification. Moreover, we should develop micro-finance mechanism for local farmers, providing basic infrastructure, sanitation equipment, clean water, electricity. At the same time, commune authorities need to support jobs and sustainable livelihood transformation solutions (e.g. agricultural and fishery extension services).
Thirdly, this study found that lack of early warning systems and climate information are also major indicators for disasters vulnerability of households to natural hazards. Therefore, an early warning climate information system should be established in the communes to reduce the potential for losses of property through natural disasters. The district/provincial government plays a central role in funding support for private entities to operate continuously and regularly, a central role to synthesize warning information and broadcast it on the mass media. In addition, provincial governments need to implement a detail assessment of the impacts of disasters to local livelihoods, so that they can design suitable preventive measures aimed at promoting adaptive capacity and reducing vulnerability to disasters.
Fourthly, it is necessary to continue raising public awareness of disaster risk management, specifically, the awareness of local authorities and people working in disaster prevention, businesses and residents with the motto "prevention is key". This is an important solution to limit risks from natural disasters. Also, it would be good to diversify forms of training activities, training and drills on natural disaster prevention and control, information, propaganda, communication and knowledge dissemination activities, organize seminars, conferences, to share lessons learned in disaster prevention.
The authors would acknowledge National Economics University, Hanoi, Vietnam, for supporting this research.
[1] United Nation Disaster Management Team. (2015). UN system response to the Gujarat earthquake immediate needs and action plan. India. http://reliefweb.int/report/india/un-system-response-gujarat-earthquake-immediate-needs-and-action-plan, accessed on Aug. 30, 2021.
[2] World Bank. (2013). Vietnam: Disaster Risk Management Project. Retrieved May 2nd, 2017. http://www.worldbank.org/en/results/2013/04/09/vietnam-disaster-risk-management-project, accessed on Non. 20, 2021.
[3] De Boer, J., Wouter Botzen, W.J., Terpstra, T. (2015). More than fear induction: Toward an understanding of people's motivation to be well‐prepared for emergencies in flood‐prone areas. Risk Analysis, 35(3): 518-535. https://doi.org/10.1111/risa.12289
[4] FAOSTAT. (2015). Global population dynamics. http://faostat3.fao.org/browse/O/*/E, accessed on May 12th, 2015.
[5] Nguyen, V.N., Ginige, K., Greenwood, D. (2018). Challenges in integrating disaster risk reduction into the built environment–The Vietnam context. Procedia Engineering, 212: 316-323. https://doi.org/10.1016/j.proeng.2018.01.041
[6] Gasperini, L. (2000). From agricultural education to education for rural development and food security: All for education and food for all. In Fifth European Conference on Higher Agricultural Education: From Production Agriculture to Rural Development: Challenges for Higher Education in the New Millennium, University of Plymouth, UK. http://www.fao. org/sd/exdirect/exre0028.htm, accessed on Oct. 1, 2001.
[7] FAO. (2010). FAO and emergencies, from prevention to building back better: Haiti earthquake 2010. http://www.fao.org/emergencies/crisis/haiti-earthquake-2010/en/, accessed on Sep. 28, 2021.
[8] FAO. (2015). FAO and emergencies, from prevention to building back better: Tsunami. http://www.fao.org/emergencies/emergency-types/tsunami/en/, accessed on Nov. 11, 2021.
[9] Peters, K. (2019). Disaster Risk Reduction in Conflict Contexts: A Briefing for Policy-makers, s.l.: ODI & GIZ. https://cdn.odi.org/media/documents/12913.pdf.
[10] Vietnam, P.A.T.A. (2020). Tourism Risk Management for the Asia Pacific Region: An Authoritative Guide for Managing Crises and Disasters. https://www.apec.org/docs/default-source/Publications/2004/12/Tourism-Risk-Management-for-the-Asia-Pacific-Region-An-Authoritative-Guide-for-Managing-Crisis-and-D/04_twg_risk__management_report.pdf.
[11] FAO. (2014). The state of food insecurity in the world. Rome: Food and Agriculture Organization of the United Nations. https://www.fao.org/3/i4030e/i4030e.pdf.
[12] Risler, E., Kintzle, S., Nackerud, L. (2015). Haiti and the earthquake: Examining the experience of psychological stress and trauma. Research on Social Work Practice, 25(2): 251-256. https://doi.org/10.1177/1049731514530002
[13] Dueck, A., Byron, K. (2011). Community, spiritual traditions, and disasters in collective societies. Journal of Psychology and Theology, 39(3): 244-254. https://doi.org/10.1177/009164711103900307
[14] Kunreuther, H., Michel-Kerjan, E. (2011). People get ready: Disaster preparedness. Issues in Science and Technology, 28(1): 39-50.
[15] Wang, Z., Wang, H., Huang, J., Kang, J., Han, D. (2018). Analysis of the public flood risk perception in a flood-prone city: The case of Jingdezhen city in China. Water, 10(11): 1577. https://doi.org/10.3390/w10111577
[16] Ashraf, S., Iftikhar, M., Shahbaz, B., Khan, G.A., Luqman, M. (2013). Impacts of flood on livelihoods and food security of rural communities: A case study of southern Punjab, Pakistan. Pakistan Journal of Agricultural Sciences, 50(4): 751-758.
[17] Raizada, M., Chapagain, T., Khadka, K. (2015). Top 10 inexpensive interventions to help farmers in Nepal after the 2015 earthquake: brief report for the Canadian Department of Foreign Affairs, Trade and Development (DFATD). Guelph: University of Guelph. http://hdl.handle.net/10625/57140.
[18] Chapagain, T., Raizada, M.N. (2017). Agronomic challenges and opportunities for smallholder terrace agriculture in developing countries. Frontiers in Plant Science, 8: 331. https://doi.org/10.3389/fpls.2017.00331
[19] Takagi, H., Thao, N.D., Esteban, M. (2014). Tropical cyclones and storm surges in southern Vietnam. In Coastal Disasters and Climate Change in Vietnam, 3-16. https://doi.org/10.1016/B978-0-12-800007-6.00001-0
[20] Tri Thuc Tre. (2015). Vietnam's economy suffers a loss of 5.2 billion USD per annum as a consequence of disasters. http://vietq.vn/kinh-te-viet-nam-thiet-hai-52-ty-usd-moi-nam-do-thien-tai-d57350.html, accessed on Oct. 20, 2021.
[21] MONRE. (2020). Disaster Risk Reduction in Viet Nam: Status Report 2020. https://reliefweb.int/report/viet-nam/disaster-risk-reduction-viet-nam-status-report-2020, accessed on Sep. 27, 2021.
[22] Give2Asia. (2015). Disaster Preparedness and Resilience: Vietnam. Retrieved May 2nd, 2017. http://www.give2asia.org/disaster-preparedness-and-resilience-myanmar-1-1/#Introduction, accessed on Dec. 17, 2021.
[23] Chapagain, T., Super, L., Riseman, A. (2014). Root architecture variation in wheat and barley cultivars. American Journal of Experimental Agriculture, 4(7): 849. https://doi.org/10.9734/AJEA/2014/9462
[24] Glago, F.J. (2019). Household disaster awareness and preparedness: A case study of flood hazards in Asamankese in the West Akim Municipality of Ghana. Jamba: Journal of Disaster Risk Studies, 11(1): 1-11. https://doi.org/10.4102/jamba.v11i1.789
[25] Hossain, S.M., Talat, M., Boyd, E., Chowdhury, S.R., Soofi, S.B., Hussain, I., Bhutta, Z.A. (2013). Evaluation of Nutrition Surveys in Flood‐affected Areas of Pakistan: Seeing the Unseen! IDS Bulletin, 44(3): 10-20. https://doi.org/10.1111/1759-5436.12026.
[26] Kirsch, T.D., Wadhwani, C., Sauer, L., Doocy, S., Catlett, C. (2012). Impact of the 2010 Pakistan floods on rural and urban populations at six months. PLoS Currents, 4. https://doi.org/10.1371/4fdfb212d2432
[27] DeYoung, S.E., Peters, M. (2016). My community, my preparedness: The role of sense of place, community, and confidence in government in disaster readiness. International Journal of Mass Emergencies & Disasters, 34(2).
[28] McGuire, S., Sperling, L. (2013). Making seed systems more resilient to stress. Global Environmental Change, 23(3): 644-653. https://doi.org/10.1016/j.gloenvcha.2013.02.001
[29] DFID. (2011). Operational Plan 2011-2016. Department for International Development. https://reliefweb.int/sites/reliefweb.int/files/resources/Vietnam.pdf/ accessed on Nov. 15, 2021.
[30] United States Geological Survey. (2015). Post-earthquake USG Haiti strategy toward renewal and economic opportunity. http://www.state.gov/documents/organization/156448.pdf, accessed on May 12th, 2015.
[31] Zulqarnain, Z. (2013). Economic Impacts of floods on small scale farmers of Pakistan-a case study from the district Nowshera. Khyber Pukhtunkhwa Province, Department of Urbanand Rural Development, Swedish University of Agricultural Sciences (thesis).
[32] GoN/NPC. (2015). Nepal earthquake 2015: Post disaster needs assessment. Vol A: key findings. Kathmandu: Government of Nepal, National Planning Commission; 2015. 21-2. https://reliefweb.int/report/nepal/nepal-earthquake-2015-post-disaster-needs-assessment-vol-key-findings, accessed on Aug. 23, 2021.
[33] World Food Programme. (2015). Who are the hungry? https://www.wfp.org/hunger/who-are, accessed on May 12th, 2015.
[34] da Costa, S.R.A., Bandeira, R.A.M., Mello, L.C.B.B., Campos, V.B.G. (2014). Humanitarian supply chain: an analysis of response operations to natural disasters. European Journal of Transport and Infrastructure Research, 14(3): 290-310. https://doi.org/10.18757/ejtir.2014.14.3.3035
[35] Tukker, H., Ngo, C.C., Nam, V. (2014). Country case study report on how law and regulation support disaster risk reduction. International Federation of Red Cross and Red Crescent Societies, New York.
[36] Ky, N. (2016). Improving disaster prevention and response measures in the transportation sector. Retrieved May 6th, 2017, http://www.baogiaothong.vn/nganh-gtvt-day-manh-phong-chong-thien-tai-d161163.html, accessed on Sep. 24, 2021.
[37] Poortinga, W., Bronstering, K., Lannon, S. (2011). Awareness and perceptions of the risks of exposure to indoor radon: A population‐based approach to evaluate a radon awareness and testing campaign in England and Wales. Risk Analysis: An International Journal, 31(11): 1800-1812. https://doi.org/10.1111/j.1539-6924.2011.01613.x
[38] Intergovernmental Panel on Climate Change (IPCC). (2012). Managing the Risks of Extreme Events and Disasters to Advance Climate Change Adaptation. A Special Report of Working Groups I and II of the Intergovernmental Panel on Climate Change, Cambridge University Press, Cambridge, UK. https://www.ipcc.ch/report/managing-the-risks-of-extreme-events-and-disasters-to-advance-climate-change-adaptation/, accessed on Oct. 29, 2021.
[39] Ardaya, A.B., Evers, M., Ribbe, L. (2017). What influences disaster risk perception? Intervention measures, flood and landslide risk perception of the population living in flood risk areas in Rio de Janeiro state, Brazil. International Journal of Disaster Risk Reduction, 25: 227-237. https://doi.org/10.1016/j.ijdrr.2017.09.006
[40] Hahn, M.B., Riederer, A.M., Foster, S.O. (2009). The Livelihood Vulnerability Index: A pragmatic approach to assessing risks from climate variability and change—A case study in Mozambique. Global Environmental Change, 19(1): 74-88. https://doi.org/10.1016/j.gloenvcha.2008.11.002
[41] Urothody, A.A., Larsen, H.O. (2010). Measuring climate change vulnerability: A comparison of two indexes. Banko Janakari, 20(1): 9-16. https://doi.org/10.3126/banko.v20i1.3503.
[42] van Beukering, P., Brander, L., Tompkins, E., Mackenzie, E. (2007). Valuing the environment in small islands: An environmental economics toolkit. University of Southampton Institutional Repository.