Natalia V. Starodubets* | Irina S. Belik | Tamila T. Alikberova
© 2022 IIETA. This article is published by IIETA and is licensed under the CC BY 4.0 license (http://creativecommons.org/licenses/by/4.0/).
OPEN ACCESS
The annual growth of the municipal solid waste (MSW) generated and the exhaustion of existing landfills capacity have led to the processes of reforming the waste sector in Russia. But the question remains open: what is the optimal ratio between waste management practices for building a sustainable MSW management system? The purpose of this article is to evaluate the sustainability of the MSW management system in Russia according to various scenarios of its development using the decoupling index. Based on the strategic documents, authors constructed three scenarios for the MSW industry development in Russia until 2024: scenario 1 (basic), scenario 2 (MSW utilization via recycling), scenario 3 (MSW utilization via recycling and MSW incineration at WTE plants). After that, the decoupling index for all scenarios was calculated. In general, calculations of the decoupling index for 2022-2024 showed that for all scenarios (except for scenario 3 in 2022), the industry is moving into the zone of absolute sustainability. The greatest sustainability is achieved in scenario 2 – for this scenario the absolute value of the decoupling index is maximum in 2023 and 2024, thereby confirming the role of recycling in increasing the sustainability of the MSW management system. The results can be used by decision makers when reforming the MSW management system to choose the optimal ratio between the MSW management practices and the appropriate regulatory tools.
MSW, MSW management practices, sustainability, decoupling index, recycling, incineration, circular economy
Waste is a universal category that every person's life relates to. About 2 billion tons of municipal solid waste (MSW) are generated annually in the world, while the specific waste generation per capita varies significantly and depends on the country’s standard of living. So, for residents of the United States, this indicator is more than 1.5 kg/person per day, while for the least economically developed countries of Africa – 0.5 kg/person per day on average.
The dependence of the MSW per capita on the socio-economic development is shown in Figure 1 [1] and confirms a well-known pattern – the higher the level of socio-economic development of the country, the greater the resources consumption and the impact on the environment.
The problem of waste growth requires the creation of an effective, sustainable waste management system and there are different approaches to its definition. Thus, Wilson et al. [2] define integrated sustainable waste management as a system, which includes both the physical components (collection, disposal and recycling) and the governance aspects (inclusivity of users and service providers; financial sustainability; coherent, sound institutions underpinned by proactive policies).
In publication “Putting Integrated Sustainable Waste Management into Practice” [3] Anschütz et al. indicate that integrated sustainable waste management takes in three dimensions: The stakeholders involved in and affected by waste management; the elements of the waste system (generation, separation, collection, re-use, recycling etc.) and the sustainability aspects of the local context that should be taken into account when assessing and planning a waste management system (technical, environmental, financial etc.). Joseph [4] also highlights the importance of all stakeholders’ involvement.
Figure 1. Dependence between waste per capita generation (kg\person per year) and socio-economic development of the country (GDP per capita, US dollars by PPP) [1]
In the paper by Sin et al. [5] sustainable waste management is defined as a management that can maintain the balance between the environment, social and economic aspects through regulation tools, and techniques in managing waste. Agamuthu et al. [6] add to these institutional aspects (legislation, business image and profitability, scientific research).
As for MSW system sustainability assessment, Wilson et al. suggest measuring waste management performance in cities using the set of indicators divided into two overlapping ‘triangles’. The first triangle comprises three physical components of waste (collection, recycling, and disposal), and the other comprises three governance aspects (inclusivity, financial sustainability, and sound institutions and proactive policies) [7].
Several papers use life-cycle approach (LCA) for measuring waste management sustainability [8-10], also, carbon footprint assessment is applicable [11, 12].
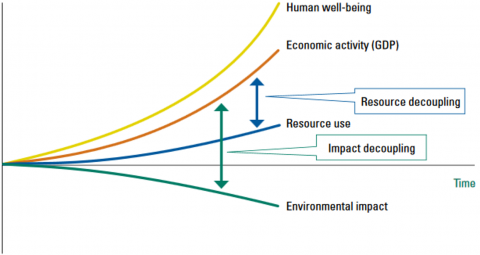
At the same time, to assess the stability of socio-economic systems since the research of Meadows et al. [13] in 70s, a well-known approach is used, which correlates the rates of economic growth, non-renewable resources consumption and human impact on the environment. Subsequently, this approach was reflected in the decoupling concept framework (see, for e.g., UNEP [14]). According to it, it is necessary to mismatch the rates of economic growth with the rates of negative impact on the environment, on the one hand (impact decoupling), and resource consumption (resource decoupling), on the other hand. Graphically, this concept is presented in Figure 2.
To assess decoupling, UNEP [14] suggests using the decoupling index (DI). DI is calculated as the ratio of changes in the natural resources consumption (or in environmental pollution) to changes in economic growth (GDP) over a certain period of time (usually one year). DI is used for sustainability assessment in various areas, including waste management [15, 16]. For example, one of the goals in the field of waste management in the EU is to decouple the volume of waste generation and the speed of economic development [17].
Few studies are available on MSW management sustainability in Russia. Some authors consider a sustainable waste management system as a combination of waste management practices and appropriate economic and administrative tools and incentives that lead to a slowdown in waste generation [18, 19]. Many authors consider waste management sustainability from circular economy principals’ point of view [19, 20]. At the same time, in Russian sources there is often a description of the current situation in the field of waste management with insufficient comprehension of its sustainability [21].
There are also papers that describe how to assess the sustainability of the waste management system using various methods for the conditions of Russia [22-24].
Undoubtedly, the use of an indicative approach, LCA approach, carbon footprint approach allows to evaluate the sustainability of the waste management system more fully. At the same time, the disadvantages of these methods may be their subjectivity (in the case of an indicative approach), the complexity of initial data collecting, and carrying out the assessment. As for the decoupling index, it allows making a quick assessment of the MSW management system sustainability and its dynamics. It should be noted, that there are no studies on Russia specific MSW management sustainability assessment based on the decoupling index. So, to bridge this gap, in this paper authors suggest using ratio between the rates of economic growth and the volume of generated waste, and calculate Russia specific decoupling index, which allows to carry out rapid monitoring of the current and future waste management system sustainability.
The volume of generated waste to a large extent depends on the chosen waste management practices. Traditional waste management practices are: Processing (preparation to recycling), recycling, energy utilization, neutralization, waste disposal at landfills [25]. The circular economy adds to these traditional waste management practices such as the maximum use of raw materials and waste prevention. Authors believe that only the complex use of all waste management practices may lead to a slowdown in the waste generation followed by its reduction [26, 27].
Figure 2. General concept of resource decoupling and environmental impact decoupling [14]
As to a circular economy principals, the MSW management methods should be arranged according to the waste hierarchy, known as the "Lansink's Ladder" [28]. This is exactly how the waste management system is built in developed countries (EU, USA, Japan, etc.) [29]. To build the sustainable MSW management system, regulatory waste management tools should primarily stimulate MSW management practices related to the upper levels of the waste hierarchy (maximum use of raw materials, waste prevention, recycling) and minimize landfill disposal and energy utilization (in the paper we consider these waste practices as least sustainable). Thus, building the sustainable MSW management system depends on the chosen waste management strategy, which includes both the ratio between waste management practices [30, 31], and the corresponding administrative and economic tools [16].
The purpose of this article is to assess the sustainability of MSW management system in Russia using the decoupling index for various scenarios of its development.
2.1 Decoupling Index for the MSW management system
Using the methodological approach of the UNEP [14], authors propose to assess the sustainability of the MSW management system with the help of decoupling index using the formula:
$D I(M S W)_{t}=\frac{\left(M S W_{t}-M S W_{t-1}\right) / M S W_{t-1}}{\left(G D P_{t}-G D P_{t-1}\right)_{G D P_{t-1}}}$ (1)
DI (MSW)t – is the decoupling index calculated for the MSW management system for the year t, which characterizes the sustainability of the MSW management system in the year t;
(MSW)t – the volume of MSW sent to the landfill and / or energy utilization in the year t, million tons;
MSWt-1 – the volume of MSW sent to the landfill and / or energy utilization in t-1 year, million tons;
GDPt – GDP in year t, in US dollars by PPP;
GDPt-1 – GDP in t-1 year, in US dollars by PPP.
If DI (MSW)t > 1, it means that the rate of growth of MSW sent to the landfill and/or energy utilization exceeds the rate of GDP growth, decoupling does not occur, the MSW management system is not sustainable;
if DI (MSW)t = 1, it means that the rate of growth of MSW sent to the landfill and/or energy utilization is approximately equal to the rate of GDP growth, there is a turning point between the absence of decoupling and relative decoupling;
if 0 < DI (MSW)t < 1, it means that the rate of growth of MSW sent to the landfill and/or energy utilization is lower than the rate of GDP growth, there is a relative decoupling or relative sustainability of the MSW management system;
if DI (MSW)t = 0, it means that the rate of growth of MSW sent to the landfill and/or energy utilization is equal to the rate of GDP growth, there is a relative decoupling or relative sustainability of the MSW management system, a turning point to absolute decoupling;
if DI (MSW)t < 0, it means that the amount of MSW sent to the landfill and/or energy utilization is decreasing against the GDP growth, there is an absolute decoupling or absolute sustainability of the MSW management system. The higher the absolute value of the index – the more sustainable the MSW management system is.
To assess the sustainability of the MSW management system in Russia using the decoupling index for various scenarios, it is necessary to describe the current situation with MSW and set scenarios conditions.
2.2 The description of the current situation and scenarios conditions
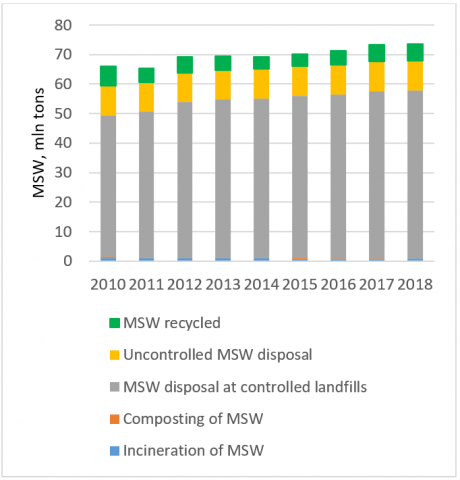
Summary data on the volumes of waste and management practices from 2010 to 2018 are given in Table 1.
The analysis of MSW management practices in Russia demonstrates the predominance of the so-called "landfill" model. During the period under review, most of the MSW (about 80%) were disposed at controlled landfills. The second most common MSW management practice (about 13%) is burial by the population in shallow, uncontrolled landfills in settlements where there is still no centralized MSW collection. The share of MSW recycling is only about 7%. Such methods as incineration and composting of organic waste have not yet been widely used in Russia, due to the lack of appropriate capacities, the share of waste treated by these methods is extremely small. Graphically, the MSW management practices in Russia for 2010-2018 are presented on Figure 3.
Since 2014, Russia has been undergoing a global reform of the MSW management system. The main idea of the changes is to reduce landfill disposal and to increase the share of MSW sent for the recycling. The logic of the reform is explained by the fact that the traditional model of MSW management has exhausted itself: according to Greenpeace, by 2024, in a third of Russian regions, MSW landfills will be filled. The target indicators of the reform are fixed in the federal project "Formation of an integrated MSW management system" of the national project "Ecology" (Table 2).
Figure 3. MSW management practices in Russia for 2010-2018, mln. tons
Table 1. MSW management practices in Russia, mln tons
|
MSW management practice |
Incineration of MSW |
Composting of MSW |
MSW disposal at controlled landfills |
Uncontrolled MSW disposal |
MSW recycled |
Total |
|
2010 |
1.01 |
0.41 |
48.02 |
10.1 |
6.42 |
65.96 |
|
2011 |
1.02 |
0.37 |
49.25 |
9.9 |
4.86 |
65.40 |
|
2012 |
0.97 |
0.39 |
52.60 |
9.9 |
5.38 |
69.24 |
|
2013 |
0.96 |
0.28 |
53.55 |
9.9 |
4.92 |
69.61 |
|
2014 |
0.95 |
0.33 |
53.91 |
9.9 |
4.26 |
69.35 |
|
2015 |
0.63 |
0.38 |
54.96 |
10.1 |
4.16 |
70.23 |
|
2016 |
0.66 |
0.24 |
55.54 |
10.1 |
4.78 |
71.32 |
|
2017 |
0.67 |
0.18 |
56.78 |
10.1 |
5.58 |
73.31 |
|
2018 |
0.74 |
0.07 |
57.04 |
10.1 |
5.62 |
73.57 |
Source: The State Report on the state and environmental protection of the Russian Federation in 2019 https://www.mnr.gov.ru/docs/proekty_pravovykh_aktov/proekt_gosudarstvennogo_doklada_o_sostoyaniy_i_ob_okhrane_okruzhayushchey_sredy_rossiyskoy_federatsi/ and the National Report on the inventory of anthropogenic emissions by sources and removals by sinks of GHGs not regulated by the Montreal Protocol http://www.igce.ru/performance/publishing/reports/
Table 2. Target indicators of the MSW management reform in Russia
|
|
The share of MSW utilization in the total volume of MSW generated, % |
The share of MSW processed in the total volume of MSW generated, % |
|
2018 |
3 |
7 |
|
2019 |
7 |
12 |
|
2020 |
16.2 |
27 |
|
2021 |
22.8 |
38 |
|
2022 |
24 |
40 |
|
2023 |
33 |
55 |
|
2024 |
36 |
60 |
Since 2020, the use of MSW as an energy source, including incineration at WTE plants after the extraction of useful components at processing facilities, has also been legally considered as utilization, together with the recycling.
Based on the above, the authors propose the following scenarios for the decoupling index calculation:
- scenario 1 – the basic scenario ("as it is"). All the trends identified in the MSW management system from 2010 to 2018 will continue until 2024. The regression equations are received from the Excel package based on the data analysis for 2010 – 2018 and used for the forecast;
-- scenario 2 - the targets for MSW management specified in the federal project (Table 2) will be met exclusively through utilization at waste recycling plants, and the volume of MSW sent to landfills will be reduced by this amount. Uncontrolled landfills will be eliminated (within the framework of the federal Clean Country project), and the volume of waste will be sent to controlled landfills. Incineration at WTE plants and composting will remain at the level of 2018 (no new capacities are being implemented);
--- scenario 3 – the targets for MSW management specified in the federal project (Table 2) will be met both through utilization at waste recycling plants and through "energy utilization" (incineration at WTE plants). The calculation of all MSW sent for the utilization is based on the target indicators of the federal project (Table 2). The volume of MSW sent to the WTE plants is based on the information about their construction in Russia and their proposed capacity. RT-Invest, a subsidiary of Rostekh State Corporation, is already building five WTE plants with a total capacity of 355 MW in the Voskresensky, Bogorodsky, Noginsky and Solnechnogorsky districts of the Moscow Region, as well as in Kazan (Tatarstan). Together, they will be able to process about 3.35 million tons of waste per year by 2024.
It should be noted that for all scenarios, the dynamics of the total volume of MSW for the period under review remains unchanged and it is determined according to the basic scenario. The difference between the scenarios lies in the correlation between different MSW management practices.
The authors made the forecast of MSW volume for different MSW management practices for three scenarios (Table 3), based on the data given in Tables 1, 2.
The Russian Federation GDP forecast for 2021-2024 is presented in Table 4.
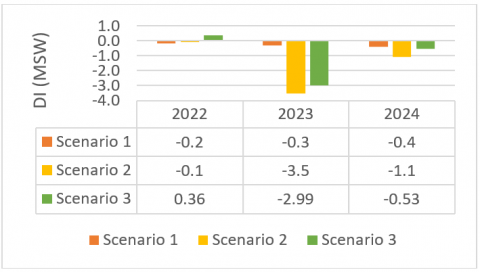
Further, the decoupling index is calculated using the formula (1), which characterizes the sustainability of MSW management system in three scenarios, the results are presented in Figure 4.
The calculations showed that for all scenarios (except for scenario 3 in 2022), the volume of MSW sent to the landfill and WTE plants decreased against the GDP growth, which is in the zone of absolute sustainability of the MSW management system. At the same time, since the index values for all scenarios are close to 0, the system has just started to move from relative to absolute sustainability. This trend is based on the logic of the ongoing reform aimed at increasing the share of utilized waste (scenario 2 and 3), and the gradual development of the utilization industry in the basic scenario 1.
Figure 4. Forecast values of DI (MSW) for the Russian Federation for 2022-2024
Table 3. MSW management practices according to scenarios
|
MSW management practice, mln tons |
2021 |
2022 |
2023 |
2024 |
The basis for the forecast |
|
Scenario 1 |
|||||
|
Incineration of MSW |
0.7 |
0.7 |
0.7 |
0.7 |
The value of 2018 is taken as a basis, new incineration plants are not being put into operation |
|
Composting of MSW |
0.1 |
0.1 |
0.1 |
0.1 |
The value of 2018 is taken as a basis, new composting facilities are not being put into operation |
|
MSW disposal at controlled landfills |
56.4 |
56.0 |
55.4 |
54.6 |
The remaining part of the total volume of MSW |
|
Uncontrolled MSW disposal |
10.0 |
10.0 |
10.0 |
10.0 |
Taken as 9-year average |
|
MSW recycled |
9.4 |
10.8 |
12.4 |
14.2 |
Regression equation y = 0.0967x2 – 1.0171x + 7.7132; R2 = 0.74 |
|
Total |
76.6 |
77.6 |
78.6 |
79.6 |
Regression equation y=0.98x + 64.864; R2 = 0.9 |
|
Scenario 2 |
|||||
|
MSW disposal at controlled landfills |
59.2 |
59.0 |
52.7 |
50.9 |
The remaining part of the total MSW volume |
|
Uncontrolled MSW disposal |
0 |
0 |
0 |
0 |
Eliminated |
|
Utilization Rate, % |
22.8 |
24 |
33 |
36 |
From the federal project, from the total MSW volume |
|
MSW utilized in all ways |
17.5 |
18.6 |
25.9 |
28.6 |
The share of MSW recycled in the total volume of MSW generated |
|
incl. incineration at WTE plants |
0.7 |
0.7 |
0.7 |
0.7 |
The value of 2018 is taken as a basis, new WTE plants are not being put into operation |
|
utilization at waste recycling plants |
16.7 |
17.8 |
25.1 |
27.8 |
The remaining part of the total volume of MSW recycled |
|
composting of MSW |
0.1 |
0.1 |
0.1 |
0.1 |
The value of 2018 is taken as a basis, new composting facilities are not being put into operation |
|
Total |
76.6 |
77.6 |
78.6 |
79.6 |
As it is in scenario 1 |
|
Scenario 3 |
|||||
|
MSW disposal at controlled landfills |
59.2 |
59.0 |
52.7 |
50.9 |
The remaining part of the total MSW volume |
|
Uncontrolled MSW disposal |
0 |
0 |
0 |
0 |
Eliminated |
|
Utilization Rate, % |
22.8 |
24 |
33 |
36 |
From the federal project, from the total MSW volume |
|
MSW utilized in all ways |
17.5 |
18.6 |
25.9 |
28.6 |
The share of MSW recycled in the total volume of MSW generated |
|
incl. incineration at WTE plants |
0.7 |
1.6 |
2.5 |
3.35 |
According to RT-Invest plans for 5 WTE plats construction by 2024, consistent capacities commissioning |
|
utilization at waste recycling plants |
16.7 |
16.9 |
23.3 |
25.2 |
The remaining part of the total volume of MSW recycled |
|
composting of MSW |
0.1 |
0.1 |
0.1 |
0.1 |
The value of 2018 is taken as a basis, new composting facilities are not being put into operation |
|
Total |
76.6 |
77.6 |
78.6 |
79.6 |
As it is in scenario 1 |
Table 4. GDP for 20201- 2024
|
|
GDP, billion US dollars by PPP |
Growth rate |
|
2021 |
4232.2 |
1.033 |
|
2022 |
4376.1 |
1.034 |
|
2023 |
4507.4 |
1.030 |
|
2024 |
4642.6 |
1.030 |
Source: Unified plan for achieving the national development goals of the Russian Federation for the period up to 2024 https://storage.strategy24.ru/files/news/202103/dc6fc463a6b2015d8c8435f11dbe2667.pdf
The greatest sustainability of the MSW management system is achieved in scenario 2. According to this scenario the absolute value of the index is maximum in 2023 and 2024. This is because in scenario 2 maximum share of MSW, compared with other scenarios, is utilized at waste recycling plants and composting plants. And in scenario 3, there is an increased unsustainable utilization at new WTE plants compared with the scenario 2. The maximum values of the index in 2023 in scenarios 2 and 3 are due to a sharp "jump" in the utilization rate laid down in the reform targets, from 24% in 2022 to 33% in 2023.
The decoupling index calculations showed that despite the reform of the sector and the gradual transition of the MSW management system to the zone of absolute stability, there is no fast decrease in the MSW volume disposed at landfills and sent to WTE. Authors believe, this is due to the insufficient development of tools supporting the waste recycling industry. Such tools, as extended producer responsibility (EPR), the financial support of households involved in separate waste collection are just beginning to take legislative forms in Russia [20].
There is a certain concern that MSW incineration has also been legally considered as utilization, together with the recycling. In addition to climate and environmental concerns of MSW incineration at WTE plants (emission of heavy metal compounds, dioxins, toxic furans that can have a negative impact on the people health and lifespan [32]), there is a possibility that this will hinder the recycling industry development, since investments will be directed to the construction of additional incineration plants, and not to waste recycling infrastructure. Also, MSW incineration can prevent the formation of a full-fledged MSW separate collection, since a two-stream waste sorting is suitable enough for it. There is no need in non-recyclable packaging prohibition and waste prevention for MSW incineration. All mentioned can subsequently lead to a decoupling index increase. Another important aspect of waste incineration support is the possible change in households’ attitude to the consumption and MSW generation. Authors analyzed data on the yearly MSW per capita generation and the share of MSW sent to WTE in the EU countries for 2018 (Figure 5). It was revealed, that for all countries under consideration (except Sweden), in which energy recovery rate is higher than the average for the EU countries (14%), the yearly MSW per capita generation is also higher than the average (476 kg/person per year), this area is highlighted in Figure 5. The revealed pattern may mean that the incineration practices may not encourage households (the main source of MSW generation) to change consumer habits, consume more rationally and prevent the amount of waste. Authors believe, to build a sustainable MSW management system, it is necessary to reduce the MSW incineration.
In this paper, the sustainability of MSW management system was assessed from impact decoupling point of view (see Figure 2): Possible waste reduction was not considered when making the forecast. For all scenarios, the annual MSW generation for 2021-2024 is growing and fixed at the level of the base scenario. This can partly be explained by the research object choice and the fact that MSW management reform in Russia does not include measures aimed at maximum use of raw materials, waste prevention, etc., that may lead to waste reduction. However, for such research objects as a municipality or a region (see, for example [16]), it is possible to set the potential MSW reduction and to assess the sustainability of MSW management system from resource decoupling point of view, and this may determine further direction of the study.
Source: https://ec.europa.eu/eurostat/web/waste/data/indicators
Figure 5. The ratio between MSW per capita and the share of MSW sent to WTE (energy recovery) in the EU countries, 2018
[1] Kaza, S., Yao, L., Bhada-Tata, P., Van Woerden, F. (2018). What a Waste 2.0: A Global Snapshot of Solid Waste Management to 2050. Urban Development Series. Washington, DC: World Bank. https://doi.org/10.1596/978-1-4648-1329-0
[2] Wilson, D.C., Velis, C.A., Rodic, L. (2013). Integrated sustainable waste management in developing countries. In Proceedings of the Institution of Civil Engineers-Waste and Resource Management, 166(2): 52-68. https://doi.org/10.1680/warm.12.00005
[3] Anschütz, J., IJgosse, J., Scheinberg, A. (2004). Putting integrated sustainable waste management into practice. Waste Netherland. https://www.eawag.ch/fileadmin/Domain1/Abteilungen/sandec/schwerpunkte/sesp/CLUES/Toolbox/t12/D12_1_Anschuetz_et_al_2004.pdf.
[4] Joseph, K. (2006). Stakeholder participation for sustainable waste management. Habitat International, 30(4): 863-871. https://doi.org/10.1016/j.habitatint.2005.09.009
[5] Sin, T.J., Chen, G.K., Long, K.S., Goh, I., Hwang, H. (2013). Current practice of waste management system in Malaysia: Towards sustainable waste management. 1st FPTP Postgrad. Semin. Towards Sustain. Manag, 1106: 1-19. https://citeseerx.ist.psu.edu/viewdoc/download?doi=10.1.1.1058.7512&rep=rep1&type=pdf.
[6] Agamuthu, P., Khidzir, K.M., Hamid, F.S. (2009). Drivers of sustainable waste management in Asia. Waste Management & Research, 27(7): 625-633. https://doi.org/10.1177/0734242X09103191
[7] Wilson, D.C., Rodic, L., Cowing, M.J., Velis, C.A., Whiteman, A.D., Scheinberg, A., Vilches, R., Masterson, D., Stretz, J., Oelz, B. (2015). ‘Wasteaware’ benchmark indicators for integrated sustainable waste management in cities. Waste Management, 35: 329-342. https://doi.org/10.1016/j.wasman.2014.10.006
[8] Coelho, L.M.G., Lange, L.C. (2018). Applying life cycle assessment to support environmentally sustainable waste management strategies in Brazil. Resources, Conservation and Recycling, 128: 438-450. https://doi.org/10.1016/j.resconrec.2016.09.026
[9] Liikanen, M., Havukainen, J., Viana, E., Horttanainen, M. (2018). Steps towards more environmentally sustainable municipal solid waste management–A life cycle assessment study of São Paulo, Brazil. Journal of Cleaner Production, 196: 150-162. https://doi.org/10.1016/j.jclepro.2018.06.005
[10] Zhou, Z., Tang, Y., Dong, J., Chi, Y., Ni, M., Li, N., Zhang, Y. (2018). Environmental performance evolution of municipal solid waste management by life cycle assessment in Hangzhou, China. Journal of Environmental Management, 227: 23-33. https://doi.org/10.1016/j.jenvman.2018.08.083
[11] Kristanto, G.A., Koven, W. (2019). Estimating greenhouse gas emissions from municipal solid waste management in Depok, Indonesia. City and Environment Interactions, 4: 100027. https://doi.org/10.1016/j.cacint.2020.100027
[12] Gautam, M., Agrawal, M. (2021). Greenhouse gas emissions from municipal solid waste management: A review of global scenario. Carbon Footprint Case Studies, 123-160. https://doi.org/10.1007/978-981-15-9577-6_5
[13] Meadows, D.H., Randers, J., Meadows, D.L. (2013). Limits to growth: The 30-year update. Foresight, 7(4): 51-53. https://doi.org/10.1108/14636680510611831
[14] UNEP. (2011). Decoupling natural resource use and environmental impacts from economic growth. A Report of the Working Group on Decoupling to the International Resource Panel. Fischer-Kowalski, M., Swilling, M., von Weizsäcker, E.U., Ren, Y., Moriguchi, Y., Crane, W., Krausmann, F., Eisenmenger, N., Giljum, S., Hennicke, P., Romero Lankao, P., Siriban Manalang.
[15] Sjöström, M., Östblom, G. (2010). Decoupling waste generation from economic growth - A CGE analysis of the Swedish case. Ecological Economics, 69(7): 1545-1552. https://doi.org/10.1016/j.ecolecon.2010.02.014
[16] Montevecchi, F. (2016). Policy mixes to achieve absolute decoupling: A case study of municipal waste management. Sustainability, 8(5): 442. https://doi.org/10.3390/su8050442
[17] Circular Economy Action Plan. For a cleaner and more competitive Europe. https://ec.europa.eu/environment/pdf/circular-economy/new_circular_economy_action_plan.pdf, accessed on Sep. 2, 2021.
[18] Fedotkina, O., Gorbashko, E., Vatolkina, N. (2019). Circular economy in Russia: Drivers and barriers for waste management development. Sustainability, 11(20): 5837. https://doi.org/10.3390/su11205837
[19] Vedysheva, N., Mukhlynina, M., Vinogradova, E., Nikiforov, A., Efimova, O. (2020). Sustainable management of municipal solid waste: A systematic approach and legal challenges. In E3S Web of Conferences, 208: 06007. https://doi.org/10.1051/e3sconf/202020806007
[20] Wiesmeth, H., Starodubets, N.V. (2020). The management of Municipal solid waste in compliance with circular economy criteria. Economy of Region, 16(3): 725-738. https://doi.org/10.17059/ekon.reg.2020-3-4
[21] Khudyakova, T., Lyaskovskaya, E. (2021). Improving the sustainability of regional development in the context of waste management. Sustainability, 13: 1755. https://doi.org/10.3390/su13041755
[22] Plastinina, I., Teslyuk, L., Dukmasova, N., Pikalova, E. (2019). Implementation of circular economy principles in regional solid municipal waste management: The case of Sverdlovskaya Oblast (Russian Federation). Resources, 8(2): 90. https://doi.org/10.3390/resources8020090
[23] Tulokhonova, A., Ulanova, O. (2013). Assessment of municipal solid waste management scenarios in Irkutsk (Russia) using a life cycle assessment-integrated waste management model. Waste Management & Research, 31(5): 475-484. https://doi.org/10.1177/0734242X13476745
[24] Rodionov, M., Nakata, T. (2011). Design of an optimal waste utilization system: A case study in St. Petersburg, Russia. Sustainability, 3(9): 1486-1509. https://doi.org/10.3390/su3091486
[25] Cheremisinoff, N.P. (2003). Handbook of Solid Waste Management and Waste Minimization Technologies. Butterworth-Heinemann. https://doi.org/10.1016/b978-0-7506-7507-9.x5000-1
[26] Dumlao-Tan, M.I., Halog, A. (2017). Moving Towards a Circular Economy in Solid Waste Management: Concepts and Practices. In: Goel S. (eds) Advances in Solid and Hazardous Waste Management. Springer. https://doi.org/10.1007/978-3-319-57076-1_2
[27] Iacovidou, E., Millward-Hopkins, J., Busch, J., et al. (2017). A pathway to circular economy: Developing a conceptual framework for complex value assessment of resources recovered from waste. Journal of Cleaner Production, 168: 1279-1288. https://doi.org/10.1016/j.jclepro.2017.09.002
[28] European Parliament. (2017). Circular economy package. Four legislative proposals on waste, report for European Parliamentary Research Service. Brussels: European Parliamentary Research Service. http://www.europarl.europa.eu/RegData/etudes/BRIE/2017/599288/EPRS_BRI(2017)599288_EN.pdf.
[29] Sakai, S.I., Yoshida, H., Hirai, Y., et al. (2011). International comparative study of 3R and waste management policy developments. Journal of Material Cycles and Waste Management, 13(2): 86-102. https://doi.org/10.1007/s10163-011-0009-x
[30] Fell, D., Cox, J., Wilson, D.C. (2010). future waste growth, modelling and decoupling. Waste Manag. Res., 28(3): 281-286. https://doi.org/10.1177/0734242X10361512
[31] Mazzanti, M., Nicolli, A.M.F. (2012). Waste dynamics in economic and policy transitions: Decoupling, convergence and spatial effects. J. Environ. Plan. Manag., 55(5): 563-581 http://dx.doi.org/10.1080/09640568.2011.616582
[32] García-Pérez, J., Fernández-Navarro, P., Castelló, A. et al. (2013). Cancer mortality in towns in the vicinity of incinerators and installations for the recovery or disposal of hazardous waste. Environment International, 51: 31-44. http://dx.doi.org/10.1016/j.envint.2012.10.003