Yanuar Wijayanto* | Akhmad Fauzi | Ernan Rustiadi | Syartinilia
© 2022 IIETA. This article is published by IIETA and is licensed under the CC BY 4.0 license (http://creativecommons.org/licenses/by/4.0/).
OPEN ACCESS
Electric trains (KRL) provide services to residents living in Jabodetabek, one of the world's most significant regions. Although KRL is used daily by about 973,366 residents to carry out their activities, some factors influence its usage. Therefore, this study aims to identify the critical elements that affect train services and the patterns of relationships amongst actors to construct a model for long-term sustainability. This study was carried out using the Micmac and Mactor methods. Micmac is a causal structural matrix that can investigate the relationship between parameters in a system. The Mactor technique, on the other hand, is applied to a variety of tactics involving many actors and a set of related interests and goals. The results showed five critical variables for sustainable urban rail service, namely Safety, Capital, Eco monitoring and evaluation, Eco plan, and COVID control are needed. Meanwhile, The General Administration of Railways, Ministry of Transport, and Indonesian commuter train company are two institutions or actors that are very influential in mobilizing the safety of KRL users amid a pandemic to ensure the continuity of train services. This study also finds that critical variables, key actors, and rail destinations strongly influence the sustainability of social, economic, and environmental aspects of urban rail transportation services. In conclusion, this study provides new insight into developing a sustainable urban rail service model in Jabodetabek KRL.
railway transportation, sustainable service, structural analysis
According to preliminary studies, out of the 30 million residents of Jakarta, Bogor, Depok, Tangerang, and Bekasi (Jabodetabek) aged five years and above, 13% are commuters. BPS (2014) defined commuters as those who carry out their daily activities outside their district or city of residence. Of the 1.38 million Bodetabek commuters who carry out daily activities in DKI Jakarta Province, 69% are male, while 31% are female. The main modes of transportation widely used by these commuters are motorbikes, public transit, and cars. The study indicates that 58%. 14% and 13% of the residents use motorbikes, public transportation, and vehicles while leaving their homes, and 57%, 16%, and 12% use these vehicles to return [1]. Meanwhile, the Electric Rail Train (KRL) only serves 3.38% of the total mobility in Jabodetabek [2]. DKI Jakarta, as the nation's capital city and the economic centre, has a population of 10,374,235 people [3], thereby making it overcrowded. In addition, the movement of 1.38 million Bodetabek commuters in and out of this city daily increases the rate of traffic jams.
In 2020, TomTom, one of the innovative companies globally, highlighted the presence of clogs in 416 cities and 57 nations. It tagged Jakarta 31st after Cairo, Egypt, with an additional trip time rate of 53% [4]. This has further strengthened the vicious cycle of Jakarta's traffic jams; therefore, the Jabodetabek Commuter line KRL became the mainstay for approximately 973,366 residents [5]. Electric rail service is part of the public service. Open welfare is used to satisfy each citizen's legal and controlled welfare needs through regulatory management (Law no. 25 of 2009 concerning Public Services). A good policy is needed in public service to provide essential service to the community. The policy is a principle used to direct decision-making by political actors or groups concerning the choice of goals [6].
Furthermore, several studies have been carried out on urban or KRL railways abroad on passenger train service policies. For instance, Yagi and Shiraishi [7] explained a wide variety of variables that contributed significantly to the model, such as essential travel (cost, time, and distance), household (income, house type, car ownership), and individual characteristics. Król et al. [8] stated no evidence of responsive price cuts in regular rates. The incumbent's strategic behavior did contribute to the withdrawal of challengers from the market in 2015. Therefore, its failure was mainly due to departure from the primary source of competitive advantage. Zhang et al. [9] stated that rail transit's carbon emission reduction potential is directly proportional to traffic demand in China. In addition, Pyrialakou et al. [10] noted that Stakeholder involvement with helpful information on various topics would help them make better policy and financial decisions in the future. Khan M.Z. and Khan F.N. [11] reported that different market shocks, such as terrorist attacks, fuel, and rolling stock shortages, have affected train travel demand.
Limited studies have been carried out on railways in Indonesia, such as the organized administration in quickening the usage of Transit-Oriented Development in Jakarta MRT. This Dirgahayani study [12], conducted using qualitative methods, found gaps in operational guidelines that cause differences in perceptions. However, joint and collaborative action has not occurred [12]. The drawback of these preliminary studies is that they do not examine how the sustainable service model in urban electric railways in developing countries is conducted. Therefore, this study aims to determine the critical factors affecting train services and the pattern of relationships between actors interested in rail services for proper development. Additionally, the difference in this study lies in the combinatory use of the mic-mac and mactor methods to develop a sustainable urban electric rail service model in KRL Jabodetabek.
Chowdhury and Quaddus [13], Wolfson et al. [14], and Liu et al. [15] analysed sustainable services in terms of management and economics, which have socio-cultural differences from the dynamics of the Jabodetabek KRL service system. In Bangladesh, Chowdhury and Quaddus [13] use the fuzzy AHP-QFD approach to overcome barriers in sustainable services. Wolfson et al. [14] employed a life cycle analysis method to design a sustainable service model with a case study in Israel. The Literature Review approach is used by Liu et al. [15] to establish a sustainable service framework in supply chain management. However, studies on sustainable services in developing urban rail services in Indonesia using a multicriteria decision-making approach, namely Micmac and Mactor, have never been carried out. When the future is uncertain, a multicriteria selection method is proper. The real benefit of this multicriteria analysis was that it forced a systematic gathering of data and a collaborative thinking process that was significantly more rigorous than what could have been done without this logical framework. Multicriteria techniques seek to grasp the reality of situations by considering both the quantitative and qualitative aspects of the consequences of various actions from which a decision must be made. Micmac effectively defines the system's boundaries and identifies the critical variables. Mactor has a primary interface and is very approachable, and it can accommodate a large number of actors and objectives [16-18].
Furthermore, there is no study on how KRL services can be improved in the Megaregions area in developing nations with unique socio-cultural characteristics, such as Indonesia. There are a few theories of sustainable urban rail transportation service policies. Based on the bibliometric analysis conducted by researchers, research on sustainable urban rail transportation service policies is still very little done before, so this opens up opportunities to fill research gaps related to the theory of sustainable rail service policies (For further explanation regarding this matter, see the methodology section in Figure 1). The rarity and advantage of this consultation lie in the coordinated perspective of social, natural, and transportation sustainability that creates economic benefits for the urban railway in the Indonesian social and cultural environment. This location was chosen to develop a sustainable service model of electric railway due to the help of the government and PT KCI in selecting the train service variables using the KRL system. In addition, this study also benefits practitioners' readers in the form of valuable empirical lessons and models in rail services in other places.
2.1 Collection of data
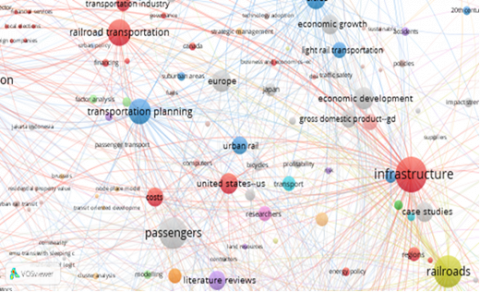
This study identified the variables relevant to the research topic through literature studies from many international journals. The literature review above was carried out with international journals indexed by Scopus through providers of electronic journal databases subscribed to by IPB University, namely Science Direct and Proquest. Based on the literature selection criteria using keywords sustainability, rail, railways, services, and policies used in the search process, the relevant journals were found, namely 127 journals from Science Direct and 415 from Proquest. Then 127 journals from Science Direct and 415 from Proquest were converted from PDF to Research Information System (RIS) file format. Then performed a Bibliometric analysis using the Vosviewer software from Leiden University. From the results of the bibliometric study, there are 2493 items, 34 clusters, 81250 links. The total link strength is 815778. Based on a prior investigation of the network visualization of relevant research topics, it was discovered that research with the keywords sustainable development of railroads, enhancement of railway services, railways, or transportation policy is still quite limited, as shown in Figure 1 below. The relevant railway service theory was found after a bibliometric analysis, and the previous research on sustainable service by Chowdhury and Quaddus [13], Wolfson et al. [14], and Liu et al. [15] became the theoretical basis in selecting the object to be investigated in this data collection. Moreover, it also uses the regulation of the Indonesian Minister of Transportation PM No. 63 of 2019 concerning minimum service standards on the transportation of people by train as the basis for guidance. Further details regarding this matter can be seen in Table 2, section 3.1., 3.2. and 3.3.
Figure 1. The pattern of relationships between variables in the Vosviewer network visualization shows how dense the variable has been previously studied by the results of the researcher's analysis
Then, these variables are confirmed and sorted based on the opinion of transportation experts in Indonesia. Due to the COVID-19 pandemic, this confirmation process was carried out via telephone, WhatsApp chat application, e-mail, and interviews with several limited experts met with strict health protocols. Subsequently, the verified variables were then transformed into a questionnaire. Furthermore, Micmac-Mactor questionnaires were used to determine the online Expert Survey using google form due to the pandemic. Finally, the Micmac and Mactor data are calibrated by expert judgment [16-18].
The expert survey used eleven experts with expert selection criteria based on their expertise closely related to the topic being researched, namely the social dimensions of transportation, transportation economy, transportation environment, and transportation services (railway service sustainability). Godet [16-18] explained that Micmac and Mactor's analysis requires collaborative thinking and input from several experts who have competence on the topic being studied. The number of experts needed depends on the needs and complexity of the object under study. Selection of experts based on expertise, experience, and how to solve the problem under investigation quickly. These experts can be selected from both internal and external expertise.
Expert Survey was collected from Transportation Social Specialist from the Indonesian Ministry of Transportation, Environmental expert of the Ministry of Environment and Forestry, Transport Economist of the Ministry of Transport of Indonesia, Public Service Expert from the Indonesian Consumers Foundation (YLKI), and Regional transportation expert from the Jabodetabek Transportation Management Agency (BPTJ). This is in addition to Railway experts from the Government, namely the General Administration of Railways, Ministry of Transport, and Study and Development Centre for Roads and Railways (Balitbanghub). Furthermore, data were collected from University academics in the field of rail transportation from the Indonesian Land Transportation Polytechnic (PTDI), Train experts, elements of KRL operators, namely the government-owned company (PT KCI), and an expert observer of private transportation, such as the Indonesian Transportation Society (MTI), Transportation safety experts, and National Transportation Safety Commission (KNKT). These data were also analysed using Micmac and Mactor Software.
2.2 Location
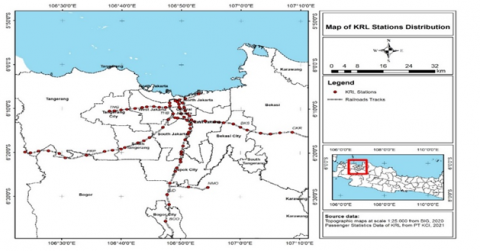
This study was conducted within the Jabodetabek Commuter line electric rail train network, as shown in Figure 2, from January 2021 to July 2021. The Jabodetabek KRL network operates in a megaregion in Indonesia, precisely on the island of Java. In general, what is meant by Jabodetabek is an area that includes 14 district or city administration areas originating from 3 provinces, namely the entire DKI Jakarta Province and parts of West Java Province and Banten Province. Jabodetabek is an Indonesian megaregion with a total area of 6,437.89 km2 or around 0.34% of Indonesia's total area of 1,916,906.77 km2. However, approximately 11% of Indonesia's population lives in the Greater Jakarta area, and it is the most densely populated area in Indonesia. Jakarta is located in the lowlands at an average altitude of 8 meters above sea level. Bogor regency is diverse, ranging from lowlands in the north to mountains in the south. Depok City is directly adjacent to Jakarta City, where the landscape of Depok City from South to North is a lowland area with an elevation between 50-140 meters above sea level, and the slope is less than 15%. Topographically, Tangerang is mainly located at an altitude of 10-30 meters above sea level with the entire area in the lowlands. Bekasi city has a slope between 0-2% and is located at an altitude between 11-81 meters above sea level. Bekasi is located in the west of the DKI Jakarta Province and is part of the province of West Java [1-5].
Figure 2. Study locations in the Jabodetabek electric railway network, one of the mega-regions in the world.
Source: created by the author based on ref. [1-3]
2.3 Data analysis
2.3.1 Micmac
The matrix of cross-impact multiplications applied to a classification (Micmac) is a causal structural matrix used to analyse the relationship between parameters in the system under study. Furthermore, it provides a precise position of the parameters, which are compiled hierarchically. System parameter analysis is carried out based on direct or indirect classification. The relationship between parameters is obtained from the identification results based on expert opinion in unreserved categories. The Micmac run the show is based on the Boolean systems, abridged in a circular form. For instance, component i particularly impacts k, which affects j down to I and back to i [16-19].
Table 1. The relationship between variables in Micmac
|
|
Var 1 |
Var 2 |
Var n |
Influence (Y-Axis) |
|
Var 1 Var 2 Var n |
0 (V2,1) (Vn,1) |
(V1,2) 0
|
(V1,n)
0 |
$\sum_{j=1}^{n}(\operatorname{Var} 1, j)$ |
|
Dependence (X-Axis) |
$\sum_{i=1}^{n}(\operatorname{Var} i, 1)$ |
|
|
|
Table 1 above shows that the relationship between variables in Micmac can be written in general through a cross matrix. This method is used to identify the main influential and dependent variables, in the coordinates of influence (Y) and dependence (X), between variables through the degree of relationship, and determines the ranking of variables. These variables are essential for system evolution [19].
2.3.2 Mactor
The Matrix of Alliances and Conflicts consists of Tactics, Objectives, and Recommendations (Mactor), used by actors seeking to measure power stability among participants. It is also used to investigate their convergence and divergence in the face of various related challenges and goals. Therefore, Mactor's method aims to determine the alliance of actors associated with policies and conflicts through this analysis. One advantage of the Mactor method applies to various strategies involving multiple actors using a series of related interests and goals. It has 6 critical elements, namely theme: topics of common interest, participants: entities that are interested in and play a role in mobilizing resources to influence the results, location: participants' preferences for the topic of results, significance: the personal interest of the actor in the middle, clout: the power of the actor to influence the outcome, and Influence: the strength of the actor's Influence on other actors [19].
The Mactor method uses 2 main inputs, namely the influence and the position of actors. Data on the influence of actors on each other is stored in the Indirect-Direct Influence (MIDI) Matrix using a measurement scale of 0 (no influence), 1 (affects procedural), 2 (affects work or activities), 3 (affects mission), and 4 (affects existence). The second input is the actor's position against an objective, and the data is stored in the Matrix Actor and Objective (MAO) as follows:
0: The objective has a negative result.
1: The actor's operating procedures (management) are jeopardized by the objective, which is critical to the operational procedures
2: Objective jeopardizes the actor's project's success, which is critical to the project's success
3: The actor's mission is jeopardized by the objective, which is unavoidable for the missions
4: Objective puts the actor's existence in jeopardy, which is necessary for existence [19].
This study was carried out using actor and objective variables to determine the existence of sustainable KRL service policies. Fauzi [19] explained that the Mactor model calculates a direct and indirect influence matrix (MIDI) that contains the direct influence and all the indirect effects for each pair of actors.
MIDIa,$=$ MID $a, b+\Sigma(\min (M I D a, c, M I D c, b)) c$ (1)
where, MIDIa,b: Direct and indirect relationship between 2 actors; MIDa,c: Weak coordinate relationship between performing artists a and c; MIDc,b: Weak coordinate relationship between performing artists c and b; $\Sigma c$: Number of direct relationships (indirect relationships).
In this model, the determination of the indirect effect is obtained from a minimum of 2 direct impacts from the total value of the unweighted immediate effect. This matrix enables the impact and correlation coefficient to be easily determined. This is obtained by adding the corresponding rows and columns of the MIDI matrix, as shown in the following formula:
$I a=\Sigma(M I D I a, b)-b M I D I a, a$ (2)
$D a=\Sigma(M I D I b, a)-b M I D I a, a$ (3)
where, Ia: Indirect influence of actor a; Da: Direct influence of actor a; $\Sigma b$: The sum of the results of actors a and b; MIDIa,b: Direct and indirect relationship between actors a and b; MIDIa,a: Direct and indirect relationship of actor.
Therefore, using these values and comparing them with the influence and dependence of other actors, the standard coefficient of the relative strength is calculated as shown in formula (4):
$r a=((I a-M I D I a, a) \Sigma(I a) b)(I a(I a+D a))$ (4)
where, ra: Coefficient of actor a; Ia: Indirect influence of actor a; Da: Direct influence of actor a; $\sum b$: The number of measurement results of actors a and b; MIDIa,a: Direct and indirect relationship of actor.
Formula (5) is used to determine the relative intensity coefficient of the 2MAO matrix to obtain a new one called 3MAO, containing aggregate factors including position, meaning, and strength.
$3 M A O a, i=2 M A O a, i \cdot r a$ (5)
where, 3MAOa,i: The relationship between actor a and issue i; 2MAOa,i: The result of actor a's position on the importance of issue i; ra: Coefficient of actor a Where MAO is the matrix actor objective.
The 3MAO matrix is the basis for most analyses proposed by MACTOR and is used to extract several essential values directly. This is the case with the mobilization coefficient (6), involving different participants with the agreement (7) and disagree (8) coefficients used to determine the degree of separation of disputed issues.
Moba $=\sum i|3 M A O a, i|$ (6)
$A g i=\Sigma a(3 M A O a, i(3 M A O a, i>0))$ (7)
Disagi $=\Sigma a(3 M A O a, i(3 M A O a, i<0))$ (8)
where, Moba: The results of the actors involved in issue i; Agi: The effects of actors that support the issue i; Disagi: The results of actors that oppose the issue i; Σi: Number of relationships between actor a and issue i; Σa: Number of relationships between actors a that support issue i; 3MAOa,i: The relationship between actor a and issue i.
3.1 Micmac analysis
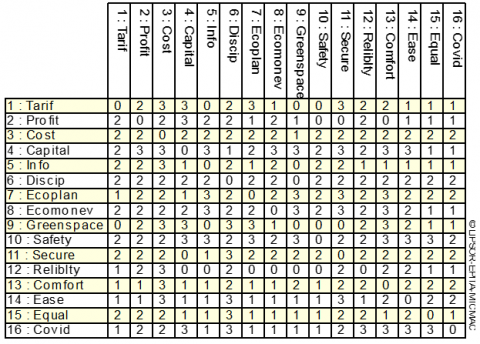
In Micmac, all variables are scored through the Direct Influence Matrix (MDI), which is used to describe their relationships in the system. The impact ranges from 0 to 3, where 0 means no relationship; 1 means weak relationship; 2 means moderate relationship; and 3 means strong relationship. While the symbol P means potential influence (cannot be determined by agreement), respectively as shown in Figure 3.
In this Micmac analysis, sixteen critical variables have been identified through literature study and consultation with Indonesian transportation experts, grouped into several categories, as shown in Table 2. KRL safety (Safety), Capital for the operation of KRL (Capital), Ecomonev, Ecoplan, and COVID are input variables found in quadrant I. They are also the key variables that affect the policy of sustainable urban rail services with significant influence in the plans and actions used to develop sustainable urban rail service policies.
Table 2. Variables used in Micmac analysis
|
Dimension |
Variables |
References |
|
Economy |
1. The amount of KRL fare (Tarif) |
Regulation of the Minister of Transportation of the Republic of Indonesia (PM) 21 year 2020; KM 348 in 2020; Yagi and Shiraishi [7] Krmac and Djordjević [20] |
|
2. KRL profit rate/margin (Profit) |
PM 28 of 2012; Kurosaki and Alexandersson [21] |
|
|
3. KRL operating costs (Cost) |
PM 28 of 2012; Król et al. [8] Li and Yu [22] |
|
|
4. KRL operation capital (Capital) |
PM 28 of 2012; Yagi and Shiraishi [7] |
|
|
Social |
5. KRL service information (Info) |
PM. No. 63 Year 2019; Errampalli et al. [23] |
|
6. Discipline of KRL users & officers (Discip) |
PM. No. 63 Year 2019; Ali et al. [24]; Król et al. [8] |
|
|
Environment |
7. Planning and work procedures for saving electricity and water consumption, materials, materials, waste, environmental waste water in the form of facilities, information and education (Ecoplan) |
p.90/menlhk/setjen/set.1/11/2016 Errampalli et al. [23]; Ghate and Qamar [25] |
|
8. Monitoring and evaluation as well as continuous improvement of the implementation of community services at public facility posts in the context of improving environmental quality (Ecomonev) |
Regulation of the Minister of Environment of the Republic of Indonesia p.90/menlhk/setjen/set.1/11/2016; Zhang et al. [9]; Sugiarto et al. [26] |
|
|
9. Availability of public green open space based on the need for certain functions (Green space) |
Minister of Public Works 05/PRT/M/2008; Li and Yu [22] |
|
|
Railway Service |
10. KRL Safety (Safety) |
PM No. 63 Year 2019; Coppola and Silvestri [27] |
|
11. KRL security (Secure) |
PM No. 63 Year 2019; Ojha [28]; Coppola and Silvestri [27] |
|
|
12. KRL reliability (Reliblty) |
PM. No. 63 Year 2019; Kim et al. [29] |
|
|
13. KRL Convenience (Comfort) |
PM No. 63 Year 2019; Errampalli et al. [23]; Song et al. [30] |
|
|
14. Ease of KRL (Ease) |
PM. No. 63 Year 2019; Song et al. [30]; Allen et al. [31] |
|
|
15. KRL Equivalent (Equal) |
PM No. 63 Year 2019; Gallo and Marinelli [32]; Sugiarto et al. [26] |
|
|
16. Control of COVID-19 prevention KRL (COVID) |
PM No. 18 Years 2020; Naweed et al. [33] |
Figure 3. MDI matrix scored by experts (Micmac analysis)
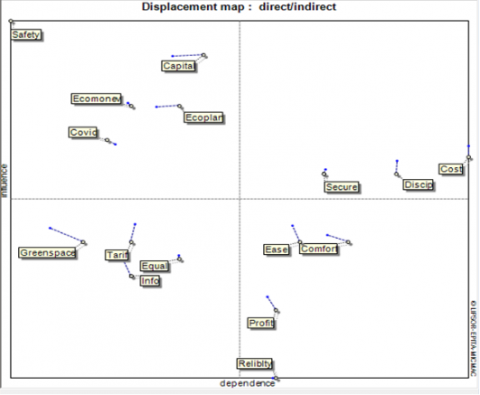
Figure 4 shows the Displacement between variables from direct to indirect influence/dependent map in Micmac analysis. The safety variable is one of the driving forces of railway services mandated by the law while transporting people, goods, and services. Meanwhile, Ecomonev, Ecoplan, and COVID-19 are triggering variables. According to the law and Regulation of the Minister, posts need to be made to improve environmental quality to KRL service standards at a public facility. The railway sector is one of the public service sectors most affected by COVID-19 because passengers were restricted from boarding trains. According to Errampalli et al. [23], Ecoplan does not continuously require trade-offs between financial, social, and natural destinations; instead, techniques that offer assistance are needed to determine the long-term goals of expanding the transportation framework efficiently. The low-carbon advancement of urban traveller transport increases cost due to its ability to produce vehicles with low CO2 emissions for urban transportation [25, 28].
Quadrant II consists of Secure, KRL operating costs, and Discipline of users & officers (Discip) intermediate variables with high dependencies. Actions on this variable provide a cascade and affect the dynamics of the Jabodetabek electric rail service system. The secure variable plays a vital part in influencing other factors such as Capital for the operation of KRL. Different organizations depend on this variable to identify users who do not pay their fares at the various paying stations. Allen et al. [31] stated that a more significant percentage of train stations have adequate staff, thereby preventing any security issue. Models gauges are used to prevent burglaries, harassment, and hateful persons from disrupting the station's safety [27]. The proposed excessive geographic expansion is detrimental to the region's revenues and operating costs. This process leads to a loss of financial sustainability [8].
Figure 4. Displacement between variables from direct to indirect influence/dependent map (Micmac analysis)
In the service dimension, safety and security are two key elements. Safety has a distinct connotation under the Law of the Republic of Indonesia number 23 of 2007 concerning Railways than security in transportation. Transportation safety refers to the state of preventing everyone from being exposed to the risk of transportation accidents caused by individuals, cars, roads, or the environment. On the other hand, security is a state of mind manifested in the operation of transportation that is free of disruptions or illegal actions. Coppola [27], in examining the perceptions of train users at Italian stations, also distinguishes between the terms safety and security. Safety means protecting human life from the dangers of accidents, while security is seen as something more threatening than safety due to the many risks of crime at the station.
Quadrant III is directly influenced by KRL profit rate (Profit), Reliblty, Comfort, and Ease variables with minor and highly dependent effects. The transfer facility serves as an area where the transportation agency reduces the penalty for waiting, walking, and transferring passengers. Among the following 5 factors, the attributes determining transmission satisfaction are access, connection and reliability, information, comfort and safety, and protection [29]. A charming operational environment makes staff and travellers feel comfortable with good physical and physiological attributes, positively impacting individuals' security mindfulness. Song et al. [30] stated that the elevated level of security mindfulness, hazardous activities, or components are anticipated and taken care of in time, using transmission satisfaction, thereby ensuring a secure and comfortable environment.
The amount of KRL fare (Tarif), KRL service information (Info), and the availability of public open green spaces are based on the needs of specific functions (Greenspace) and Equivalent KRL (Equal) in quadrant IV (autonomous variable), as shown in Figure 4. However, they are variables that are not influential enough with low dependency. Tarif variable is an autonomous variable because it does not affect the KRL system due to its annual subsidy by the government. In Edinburgh and Manchester, the open glare encompassing referenda are used to determine the dismissal of charging proposition by more prominent parts of 70–80%. According to Sugiarto et al. [26], the key components affecting open worthiness incorporate the charge level.
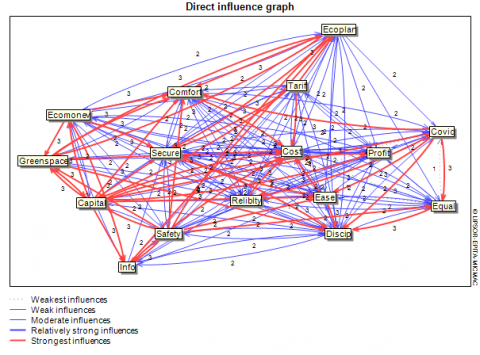
The direct influence diagram is established from the matrix that directly influences the MDI, which describes the direct influence between the variables that define the system. The MDI characteristic represents 0, 1, 2, 3, and 4 in the array.
The capital strongly influences the Info, Ecomonev, Equal, Ecoplan, Comfort, and Ease variables. Conversely, it is strongly influenced by Tarif, Safety, Profit, COVID, and Greenspace variables. Figure 5 shows that capital has a moderate impact on reliability and cost.
Figure 5. Direct influence map from MDI matrix at 75% percentage (Micmac analysis)
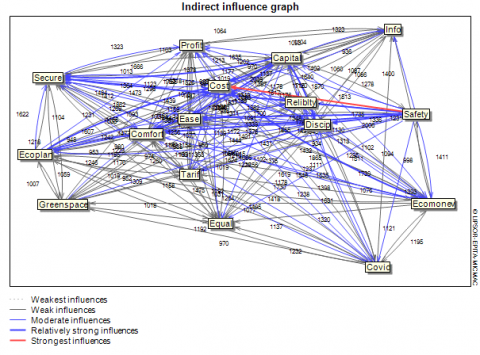
Figure 6. Indirect influence map from MII matrix at 75% percentage (Micmac analysis)
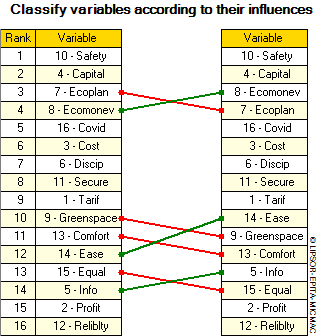
Figure 7. Ranking comparison between MDI Matrix and MII Matrix according to their influence (Micmac analysis)
MII is used to set up the Indirect Influence diagram and corresponds to the direct influence matrix through successive iterations. From this matrix, the current variable classifications are used to determine the most critical variables of the system. Hidden variables are detected due to the matrix multiplication procedure applied to the indirect category. The program makes it possible to study influence propagation through feedback methods and loops in a hierarchical way. Therefore, it considers the trajectory and number of loops of length 1, 2 ... N generated by each variable. Generally, the classification becomes stable from the 3, 4, or 5 factorial methods. Safety variable has powerful and weak influences on Cost and Greenspace. Meanwhile, it moderately impacts the Ecomonev, Profit, Info, Ease, and Tarif variables. In addition, the safety variable has a strong influence on the Comfort, Ease, Reliblty, and Ecoplan variables, as shown in Figure 6.
Figure 7 explains the scores between the variables based on their influence and its transfer after calculating the indirect impact. For example, Ecoplan, located initially at the 3rd position, was moved to the 4th and replaced with Ecomonev. After considering the indirect effects, other variables such as Greenspace changed from the 10th to the 11th position, and Ease increased from the 12th to the 10th position. These results show that Safety, Capital, Ecomonev, Ecoplan, COVID, and Cost are the 6 main vital variables of sustainable urban rail services.
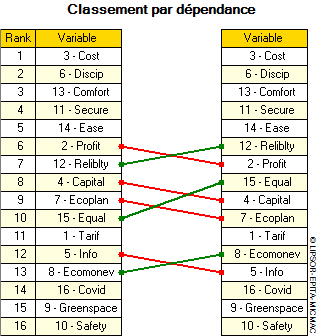
Furthermore, a classification comparison following the dependence relationship is shown in Figure 8. From the perspective of dependence, among the 4 significant dependent variables, the main variables, namely cost, discipline, comfort, secure, and, Ease are consistent. Profit and Reliblty are in the sixth and seventh positions, while (Cost) is highly dependent on the sustainability of railway services. The dependent variables Equal moved from tenth to eighth.
These variables offer assistance arrangements to advance the maintainability of railway administrations by deciding the need of critical factors with the most noteworthy scores, which ought to take precedence over variables with limited rankings. The forward-looking auxiliary examination is a method of developing future scenarios based on the chronicled patterns of the framework. The planned introductory study can effectively distinguish key factors (space controllers) and is used to consider the relationship between subordinate and free elements [16-18].
Figure 8. Ranking comparison between MDI Matrix and MII Matrix according to their dependence (Micmac analysis)
3.2 Mactor analysis
Data were collected from preliminary studies, related to regulations, consultancies with supervisors, discussions, and experts in the following fields:
1. General Administration of Railways, Ministry of Transport (DJKA)
2. R&D Centre of the Ministry of Transport (Puslitbang)
3. Indonesian commuter train company (KCI)
4. Jakarta Transportation Management Agency (BPTJ)
5. Indonesian Land Transport Polytechnic (Univ)
6. The Jabodetabek community using KRL (Society)
7. Indonesian Transportation Society (MTI)
8. Ministry of Environment & Forestry (KLHK)
9. Indonesian Consumers Foundation (YLKI)
10. National Transportation Safety Commission (KNKT)
11.Transportation Apparatus HR Development Centre (PPSDMAP).
The variables of Objectives identified in preliminary studies Król et al. [8]; Zhang et al. [9]; Krmac and Djordjević [20]; Coppola and Silvestri [27]; Ojha [28], Sugiarto et al. [26]; Errampalli et al. [23]; Ghate and Qamar [25]; Gallo and Marinelli [32]; Song et al. [30]; Li and Yu [22] related to the study were grouped into the following 4 dimensions:
1. Economy Dimension, which consists of a variable, namely (1) Increasing Indonesian commuter train company Profits amid the pandemic (Profit).
2. Social Dimension consists of 2 variables, namely (1) Increased Safety (reducing excess capacity on trains & platforms) and Equality (between men, women, elderly, disabled, children, pregnant women) and KRL users (Safety) as well as (2) The transfer of private motorized vehicle users to KRL through targeted subsidies to entitled recipients (Subsidy).
3. Environment Dimension consists of one variable, namely (1) Prohibition of reducing environmental quality in public facilities at KRL Station (or conservation) (Environ).
4. Service Dimension consists of one variable, namely (1) Improved KRL Services amid the COVID-19 pandemic (COVID).
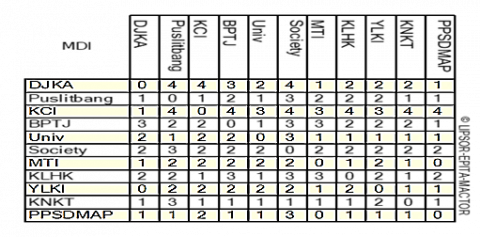
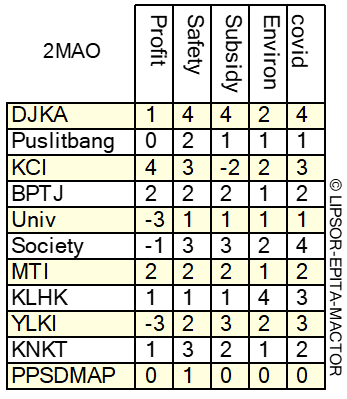
These variables are scored through the Direct Influence Matrix (MDI) with the actors created from the direct influence on each other. The impact is rated from 0 to 4, which indicates no effect (0), operational procedure (1), project (2), task (3), and exists (4). The matrix of valued positions Actor-Objective (2MAO) provides information on the actor's pro, against, neutral or indifferent objectives. The sign indicates the actor's ability to reach the purpose, as shown in Figure 9.
(a)
(b)
Figure 9. (a) The Matrix of Direct Influences (MDI) (b) The matrix of valued positions Actor-Objective (2MAO) scored by Experts, (Mactor analysis)
The graph of influence and dependence between participants is their graphic representation, direct (Di) or indirect (Ii) to each other. The position is automatically calculated using the Mactor software.
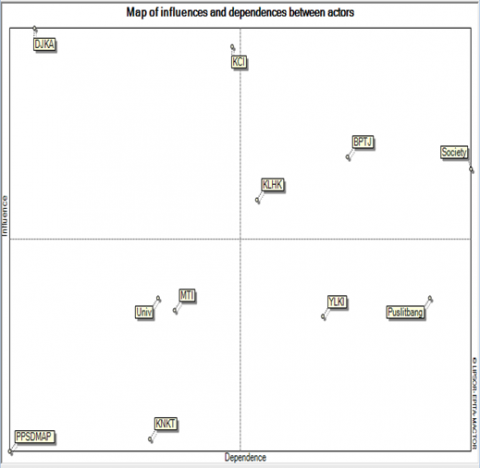
DJKA and KCI are in quadrant I or prominent role in the influence and dependency map. The dominant role is the most influential with a low degree of dependence. DJKA is an essential factor because it performs a supervisory role under Law No. 1 Regulation number 23 of 2007 on railways. In 2009 the Minister of Transport issued the Indonesian commuter rail company business license numbers KP No. 51 and KP No. 53. As the operator of KRL, the mission of the Indonesian commuter railway company is to organize commuter rail transportation services using the Electric Rail Train in the Jabodetabek area. Furthermore, the government plays a critical role in conveying high-quality administrations, such as presiding officers. According to Allen et al. [31], such clients are likely to prescribe the services of this transportation company to their peers.
Quadrant II (broadcasting actors) consists of KLHK, Society, and BPTJ with influence and dependency map. Relay actors have a substantial impact with high dependency. Meanwhile, KLHK tremendously influences regulators that oversee environmental management in public facilities such as trains, highly dependent on technical ministries. The community has a significant influence on the ability of the train service to assess rails. However, on the other hand, KRL is dependent on public transportation activities without congestion from the source to Jakarta.
Quadrant III (dominated actors) consists of YLKI and Puslitbang, dependent on the map. Dominated actors have low influence with high dependence. Although the Study and Development Centre is a government organization, it has a downward effect. The results are normative and follow the DJKA study. Furthermore, the Puslitbang study does not have the "coercive" power such as the DJKA sub-sector. YLKI is only an NGO that accepts public complaints without authority regarding KRL services.
MTI, PPSDMAP, KNKT, Univ on the map of influence and dependence is quadrant IV (autonomous actors). MTI is an NGO without authority, while KNKT is a non-structural government organization that works only during train accidents. PPSDMAP is a training centre that educates human resources in the managerial field to have little influence. Transportation colleges as educational institutions only provide academic studies when needed, as shown in Figure 10.
Figure 10. Diagram of influence and dependency between participants based on MDII matrix (Mactor analysis)
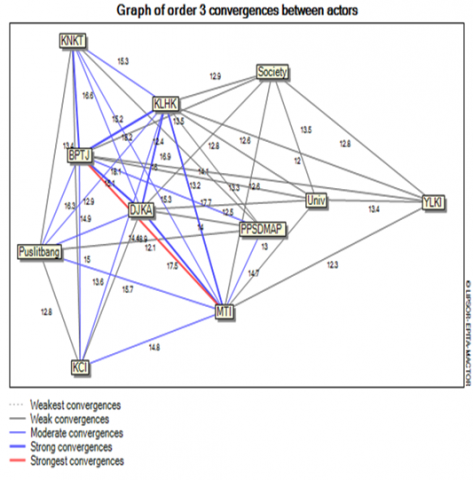
The convergence graph reflects participants' data, namely 1CAA, 2CAA, and 3CAA matrices. In other words, the closer the participants are to one another, the stronger their convergence. Based on the Third Order Convergence Actors-Actors (3CAA) matrix, BPTJ, MTI, KLHK, DJKA, and KNKT represent participants' degree of convergence with higher intensity 86.2, 80.8, 9.1, 140.1, and 76.4, respectively. BPTJ has extreme astringency to MTI with solid resistance to DJKA, KNKT, and KLHK. BPTJ often invites MTI, which comprises transportation experts from various agencies in Indonesia, to discuss the proximity of the Jakarta office and facilitate the meeting. BPTJ, KNKT, KLHK, and DJKA have daily purposes as regulators, as shown in Figure 11 (a).
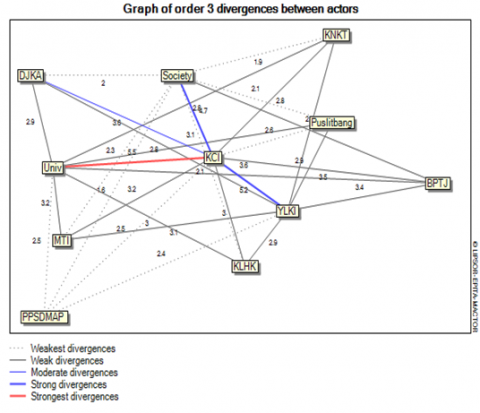
The participant divergence chart maps are in the third-order according to the divergence under the data in the 3DAA matrix. It helps to identify possible alliances and conflicts following the divergence Actors-Actors (3DAA) and the Actors-target (3MAO) matrix. The average divergence strength of each pair does not occupy the same position. The value of the matrix measures the intensity of conflict for each couple and their goal level (preference) and competitiveness. According to 3DAA, the KCI, Univ, YLKI, and society scores are 33.5, 16.7, 16.5, and 12.2. The value represents the degree of disagreement; therefore, the more significant the intensity, the greater the dispute between the participants. KCI and YLKI have strong relationships with Society and the Univ, respectively.
(a)
(b)
Figure 11. (a) Graph of order 3 convergences between actors, (b) Graph of order 3 divergences between actors at 75 % percentage (Mactor analysis)
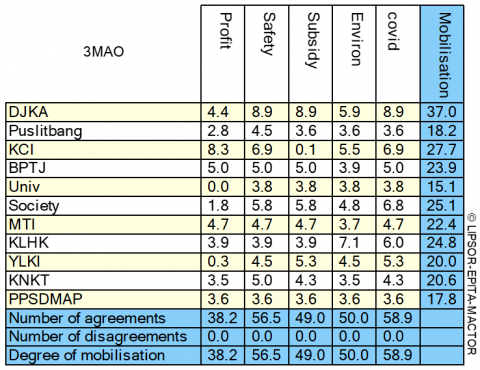
On many occasions, the Society has submitted complaints to YLKI for inadequate or unsatisfactory KRL services such as delays, accidents, security at stations, ticket prices, purchase facilities, etc., as shown in Figure 11b. From weighted valued positions of objectives between actors 3MAO Matrix, the goal of Increasing Indonesian commuter train company Profits for Univ, YLKI, and Society are 0.0, 0.3, and 1.8. This means that these attributes have an opposite attitude towards this goal. However, they were close to Safety, Environ, and COVID. DJKA (8.9) and Society (5.8) have a close relationship with the objectives of the Subsidy, as opposed to KCI (0.1), which is relatively distant. This is because the Indonesian commuter train company chooses to have the freedom to determine their electric rail fares based on their calculations of costs, benefits, and burdens. The payment of government subsidies through DJKA is often delayed, as shown in Figure 12.
The incident that occurred in KCI due to the monopoly of the state-owned enterprises also occurred in Swedish National Railway. Most passenger services are not profitable; however, maintaining these services is considered essential for socio-economic and political reasons. The railway network is under-capitalized, and once the line starts to lose money, reinvestment in infrastructure usually stops. This fettle worsens the situation, thereby decreasing state subsidies to compensate for the operating losses [30].
Figure 12. Weighted valued positions of objectives between actors, 3MAO Matrix (Mactor analysis)
Figure 12 shows that the 3MAO Matrix (DJKA) has the highest score of 37.0. This means that it plays an essential role in mobilizing the goals or issues of the improved KRL Services amid the pandemic (COVID), with a score of 58.9. Based on the circular letter by the Indonesian Minister of Transportation number SE. 89 of 2021 concerning instructions for implementing domestic travel by rail transportation during the pandemic within the Jabodetabek KRL agglomeration area, travellers are required to show their vaccine card as proof of vaccination. This finding is similar to the study carried out by Naweed et al. [33] that trains in Australia have been dubbed a ghost due to the low number of passengers and social restrictions.
3.3 Sustainable service model development of urban railway
Preliminary studies on the methodology used to create approaches for feasible beneficial advancement on KRL in key mega-regions were carried out by Chowdhury and Quaddus [13], Wolfson et al. [14], and Liu et al. [15]. Wolfson et al. [14] used the life cycle analysis method to create a sustainable service model using Israeli as a case study. Each new "super service" component needs to consider tangible and intangible resources in the sustainable service life cycle. To complete this cycle, the new value is created, and the sustainability of customers who are now suppliers is transferred to the next generation because it is a renewable service.
Chowdhury and Quaddus [13] established a different model using Bangladesh as a case study. They stated that the multi-stage fuzzy AHPQFD method introduced in this study bridges the sustainability implementation gap in the context. This study takes a systematic approach and places the conceptual model in a specific application area (m-health in Bangladesh).
Liu et al. [15] stated that the environment and society are the 2 pillars of a sustainable supply chain and the economy. As a critical supply chain member, it promotes service integrators for suppliers and customers to achieve a win-win situation in the supply chain based on life cycle assessment and compliance with social responsibilities.
Chowdhury's [13] study in Bangladesh stated that the concept of sustainable services ensures the delivery system affects 3 fragile organizations, namely social, environmental, and economic issues. Therefore, due to the impact on the environment, this study designed a sustainable service based on changes in customer needs. Furthermore, Liu's [15] study in China reported that sustainable service delivery is used to optimize the entire service supply chain's economy, environment, and social performance. Conversely, Wolfson [14], carried out in Israel, defined sustainable service as an economic benefit that fulfills client needs. It also influences the characteristics or social environment. Furthermore, it depicts monetary administrations and is used to integrate intangible assets.
However, these studies do not include transportation services, specifically railway, and their ability to provide meaningful stakeholder relationships. Another drawback is that they only defined sustainable services from the company's perspective and business context. Ojha [28] studied the quality of service delivery on the railway platform at Allahabad station in India by analyzing amenities such as food, drinks, bookstores, ATMs, and sanitation. This study also ignored the significance of interpersonal or institutional ties in the rail service system.
Therefore, from the explanation above, a study for Sustainable Service Improvement on Electric Rail Trains (KRL) on the Jabodetabek Route has not been conducted in the transportation sector. This study proposes a "sustainable service concept in urban railways in Jakarta, Bogor, Depok, Tangerang, Bekasi (Jabodetabek) megaregions" to fill this study gap. A mega-region is an extensive network consisting of a metropolitan city centre surrounded by territories and state borders connected to urban areas [34]. Studies on the use of sustainable services in the design of urban rail service in Indonesia using a multi-criteria decision-making technique have not been conducted. Furthermore, none explains the procedure used by KRL services to sustainably improve the Megaregions area in developing countries with specific socio-cultural conditions, such as Indonesia.
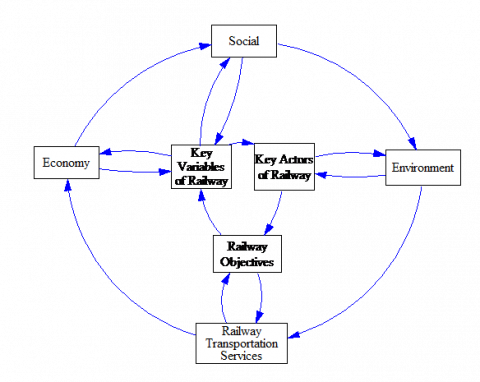
This study uses the Micmac and Mactor method, which has the advantage of mapping critical variables and actors that affect a sustainable service system on the urban rail. Figure 13 is a new model of sustainable service on urban rail developed using the Micmac and Mactor method. The model is also a development of the model previously made by Chowdhury & Quaddus [13], Wolfson et al. [14], and Liu et al. [15].
Micmac and Mactor's analysis and findings above can be synthesized and proposed that the sustainable urban railway service considers social, economic, and environmental elements. In addition to rail transportation services, critical variables of trains, railway actors, and the urban system's objectives will be achieved. From Figure 13 below, it can be explained that all components of a sustainable rail service influence each other. Furthermore, in terms of environmental aspects, electric train services are reliable, easy, safe, secure, and do not pollute the environment, thereby increasing the economic income of companies and the state. The running of the wheels on the urban rail makes it possible to achieve welfare and social care in the community. A prosperous, caring, and fair society, also pays attention to environmental sustainability. There are important railway actors that play essential roles in society. They develop goals with critical variables or drivers capable of affecting the economic and social aspects of the railway.
Figure 13. Sustainable urban railway service model
In conclusion, this study revealed that KRL operating costs, Discipline of KRL users & officers, KRL security, and Comfort of KRL are the 4 main critical variables of sustainable urban rail service in dependency ratio. Meanwhile, sustainable urban rail services have 5 crucial variables in terms of influence, namely KRL safety (Safety), Capital for the operation of KRL (Capital), Monitoring, evaluating, and the continuous improvement of the implementation of community services at public facility posts to improve environmental quality (Ecomonev), Planning and work procedures for saving electricity and water, materials, waste, ecological wastewater in the form of facilities, information, and education (Ecoplan), and Control of the COVID-19 prevention KRL (COVID).
This study also finds that the General Administration of Railways, Ministry of Transport, and Indonesian commuter train company are the institutions that have the most influence on the sustainability of Jabodetabek KRL services in Indonesia (quadrant I). In contrast, the Ministry of Environment & Forestry, Society, and Jakarta Transportation Management Agency (quadrant II) are institutions with significant influence and a high dependence on other institutions. The actions taken by this institution will have a substantial impact on the sustainability of rail services. Furthermore, the Indonesian Consumers Foundation and the R&D Centre of the Ministry of Transport are institutions that have little influence on the sustainability of KRL services (quadrant III).
The Indonesian Transportation Society, Transportation Apparatus Human Resources Development Centre, National Transportation Safety Commission, and Indonesian Land Transport Polytechnic are institutions with little influence and reliance on the Jabodetabek KRL urban rail service system, according to the study's findings (quadrant IV). These institutions have a negligible direct impact on Jabodetabek KRL's long-term viability. General Administration of Railways, Ministry of Transport plays an essential role in mobilizing the goals or issues of the improved KRL Services amid the pandemic.
Based on the analysis and discovery of Micmac and Mactor, it is possible to synthesize and propose the development of a sustainable urban electric rail service model in line with social, environmental, and economic factors as well as rail transport services, key actors, and variables. This study contributes to providing a current understanding and a new model of sustainable services in the context of urban rail transportation using Jabodetabek KRL as a case study.
This report advises the Indonesian government, notably the Ministry of Transportation, to put the safety of Jabodetabek KRL users first, especially during a pandemic. One of the most critical steps to stop the COVID-19 virus from spreading among KRL users. According to this study, the budget for the Directorate General of Railways Institution, as well as the government's capital participation in a government-owned business entity (PT KCI), should be increased to improve safety, control of COVID-19, develop environmentally-friendly KRL service plans, and conduct periodic monitoring and evaluation to enhance KRL services. Paying attention to environmental sustainability will eventually make the KRL service more sustainable.
This study was conducted amid the COVID-19 pandemic. Therefore, it is limited to a lack of expert opinions through in-depth interviews to complete the results of the mixed-method analysis used. Further study needs to develop more sustainable service models in other sectors.
The authors are grateful to the Education Fund Management Agency (LPDP) RI for the scholarship awarded to carry out this study. The authors are also grateful to the Study Advisory Commission, The Central Agency for Human Resources Development of Transportation Apparatus, and the Ministry of the Transportation Republic of Indonesia for their support and assistance.
[1] [BPS] Central Bureau of Statistics. (2014). Jabodetabek Commuter Statistics. Central Bureau of Statistics. Jakarta.
[2] [KCI] PT KAI Commuter Indonesia. (2018). Annual Report 2017: A Transformation for Greater Service. Jakarta.
[3] [BPS] Central Bureau of Statistics. (2019). DKI Jakarta in Figures 2019. BPS DKI Jakarta.
[4] Tomtom. (2021). Traffic Index results 2020. https://www.tomtom.com/en_gb/traffic-index/ranking/, accessed on April 26, 2021.
[5] Indonesian commuter train company. (2021). Submission of data on electric trains 2013-2020 (Jakarta: PT KCI).
[6] Dunn, W.N. (2000). Introduction to Public Policy analysis. Second Edition. Prentice-Hall Inc. New Jersey.
[7] Yagi, S., Shiraishi, H. (2017). Policy analysis for new commuter rail and road pricing alternatives using an SP survey in Abidjan. Transportation Research Procedia, 25: 2520-2535. https://doi.org/10.1016/j.trpro.2017.05.285
[8] Król, M., Taczanowski, J., Kołoś, A. (2018). The rise and fall of Interregio. Extensive open-access passenger rail competition in Poland. Research in Transportation Economics, 72: 37-48. https://doi.org/10.1016/j.retrec.2018.06.008
[9] Zhang, L., Long, R., Chen, H. (2019). Carbon emission reduction potential of urban rail transit in China based on electricity consumption structure. Resources, Conservation and Recycling, 142: 113-121. https://doi.org/10.1016/j.resconrec.2018.11.019
[10] Pyrialakou, V.D., Gkritza, K., Liu, S.S. (2019). The use of focus groups to foster stakeholder engagement in intercity passenger rail planning. Case Studies on Transport Policy, 7(2): 505-517. https://doi.org/10.1016/j.cstp.2018.12.009
[11] Khan, M.Z., Khan, F.N. (2021). A dynamic analysis of rail travel demand in Pakistan. Case Studies on Transport Policy, 9(2): 860-869. https://doi.org/10.1016/j.cstp.2021.04.006
[12] Dirgahayani, P., Yesuari, A.P., Wulansari, T.R., Sutanto, H. (2020). The formation of network governance in accelerating the implementation of TOD: The case of Jakarta MRT Phase 1, Indonesia. Case Studies on Transport Policy, 8(4): 1412-1425. https://doi.org/10.1016/j.cstp.2020.10.006
[13] Chowdhury, M.M.H., Quaddus, M.A. (2016). A multi-phased QFD based optimization approach to sustainable service design. International Journal of Production Economics, 171: 165-178. https://doi.org/10.1016/j.ijpe.2015.09.023
[14] Wolfson, A., Tavor, D., Mark, S. (2011). Sustainable services: The natural mimicry approach. Journal of Service Science and Management, 4(2): 125. https://doi.org/10.4236/jssm.2011.42016
[15] Liu, W., Bai, E., Liu, L., Wei, W. (2017). A framework of sustainable service supply chain management: A literature review and research agenda. Sustainability, 9(3): 421. https://doi.org/10.3390/su9030421
[16] Godet, M. (1994). From anticipation to action: A handbook of strategic prospective. Paris: UNESCO Publishing.
[17] Godet, M. (2006). Creating future: Scenario planning as a strategic management tool. London: Economica.
[18] Godet, M., Durance, P. (2011). Strategic Foresight for Corporate and Regional Development. Paris: UNESCO Publishing.
[19] Fauzi, A. (2019). Sustainability analysis techniques. Jakarta [ID]. Gramedia.
[20] Krmac, E., Djordjević, B. (2017). An evaluation of train control information systems for sustainable railway using the analytic hierarchy process (AHP) model. European Transport Research Review, 9(3): 1-17. https://doi.org/10.1007/s12544-017-0253-9
[21] Kurosaki, F., Alexandersson, G. (2018). Managing unprofitable passenger rail operations in Japan-Lessons from the experience in Sweden. Research in Transportation Economics, 69: 460-469. https://doi.org/10.1016/j.retrec.2018.07.019
[22] Li, X., Yu, B. (2019). Peaking CO2 emissions for China's urban passenger transport sector. Energy Policy, 133: 110913. https://doi.org/10.1016/j.enpol.2019.110913
[23] Errampalli, M., Patil, K.S., Prasad, C.S.R.K. (2020). Evaluation of integration between public transportation modes by developing sustainability index for Indian cities. Case Studies on Transport Policy, 8(1): 180-187. https://doi.org/10.1016/j.cstp.2018.09.005
[24] Ali, A.A., Eliasson, J., Warg, J. (2017). Measuring the socio-economic benefits of train timetables application to commuter train services in Stockholm. Transp Res Procedia, 27: 849-856. https://doi.org/10.1016/j.trpro.2017.12.124
[25] Ghate, A.T., Qamar, S. (2020). Carbon footprint of urban public transport systems in Indian cities. Case Studies on Transport Policy, 8(1): 245-251. https://doi.org/10.1016/j.cstp.2019.01.005
[26] Sugiarto, S., Miwa, T., Morikawa, T. (2020). The tendency of public’s attitudes to evaluate urban congestion charging policy in Asian megacity perspective: Case a study in Jakarta, Indonesia. Case Studies on Transport Policy, 8(1): 143-152. https://doi.org/10.1016/j.cstp.2018.09.010
[27] Coppola, P., Silvestri, F. (2020). Assessing travelers’ safety and security perception in railway stations. Case Studies on Transport Policy, 8(4): 1127-1136. https://doi.org/10.1016/j.cstp.2020.05.006
[28] Ojha, M.K. (2020). Quality of service delivery at railway platforms: A case of Allahabad junction railway station. Case Studies on Transport Policy, 8(3): 1087-1095. https://doi.org/10.1016/j.cstp.2020.07.012
[29] Kim, J., Schmöcker, J.D., Yu, J.W., Choi, J.Y. (2018). Service quality evaluation for urban rail transfer facilities with Rasch analysis. Travel Behaviour and Society, 13: 26-35. https://doi.org/10.1016/j.tbs.2018.05.002
[30] Song, L., Li, Q., List, G.F., Deng, Y., Lu, P. (2017). Using an AHP-ISM based method to study the vulnerability factors of urban rail transit system. Sustainability, 9(6): 1065. https://doi.org/10.3390/su9061065
[31] Allen, J., Muñoz, J.C., de Dios Ortúzar, J. (2020). On the effect of operational service attributes on transit satisfaction. Transportation, 47(5): 2307-2336. https://doi.org/10.1007/s11116-019-10016-8
[32] Gallo, M., Marinelli, M. (2020). Sustainable mobility: A review of possible actions and policies. Sustainability, 12(18): 7499. https://doi.org/10.3390/su12187499
[33] Naweed, A., Jackson, J.E., Read, G.J. (2021). Ghost trains: Australian rail in the early stages of the global COVID-19 pandemic. Human Factors and Ergonomics in Manufacturing & Service Industries, 31(4): 438-444. https://doi.org/10.1002/hfm.20886
[34] Ross, C.L. (2011). Transport and megaregions: High-speed rail in the United States. The Town Planning Review, 2(3): 341-348. https://doi.org/10.3828/tpr.2011.20