Mega Mutiara Sari* | Takanobu Inoue | Regil Kentaurus Harryes | I Wayan Koko Suryawan | Kuriko Yokota | Suprihanto Notodarmojo | Ika Bagus Priyambada
© 2022 IIETA. This article is published by IIETA and is licensed under the CC BY 4.0 license (http://creativecommons.org/licenses/by/4.0/).
OPEN ACCESS
Marine debris is one of the global problems due to human activities. One of the biggest loads of marine debris is in the city of Jakarta, namely the Pluit Emplacement. Emplacement Pluit is a special location for managing marine debris in Jakarta, with the largest burden of marine debris problems discharged from urban areas. This study analyses aquatic waste's generation or marine debris, composition, and recycling potential at the Pluit Emplacement. The research process starts with formulating the problem, conducting a literature review, collecting data, and analyzing it under ideal conditions and planning. This research was conducted by sampling for seven consecutive days, and load count analysis to determine the generation and composition of marine debris. The marine debris composition is grouped using a load based on the volume/volume (v/v) ratio. The generation of marine debris in the Pluit Emplacement can reach 230 m3/day or 303.6 tons/day. However, this value is higher than other areas in Jakarta and other areas in Indonesia. The composition of marine debris consists of Straw (PET), Food packaging, Drink cup, PET Bottle, Miscellaneous packaging, Plastic bags (PP), Plastic toys (HDPE), Metal, Styrofoam, biodegradable waste (wood, twigs and leaves) which is 0.1%; 3.1%; 2.2%; 22.5%; 4.0%; 0.7%; 0.8%; 0.6%; 3.1%; and 62.8%, respectively. The level of potential for recycling of Pluit's marine debris is 67.86%, with the greatest potential being from the utilization of biodegradable waste into compost or recycling of plastic waste, especially PET plastic. This considers the absence of previous sustainable marine debris processing. These findings can be one of the considerations for the government in making decisions to carry out appropriate planning according to the characteristics of marine debris, that this research can also be used as consideration for regions and even other countries in the characterization and planning of marine debris management.
marine debris, waste generation, waste composition, recycling
The large number of watersheds that reach 13 major rivers [1] is undoubtedly a source of distribution for the generation of marine debris. DKI Jakarta in 2019 has produced 7702 tons/day of solid waste [2]. In addition, other data shows an increase in the amount of waste from 6561 tons/day to 7702 tons/day from 2017 to 2019 in Jakarta [3]. The amount of waste generated is around 38% of the litter went to dumping into ocean/coastal ecosystem [4].
According to the world bank, waste in waters does not only come from waters. Still, it is also widely expressed by land. It is stated that in 2018 the most waste composition in DKI Jakarta waters was produced by organic waste with a percentage of 52.1% of the total composition of waste generation DKI Jakarta [5]. The marine debris generated will certainly continue to increase along with the increasingly dense population in the city of Jakarta.
Marine debris is solid objects with persistent properties produced or processed by humans directly or indirectly, intentionally or unintentionally disposed of or left in the marine environment [6-8]. Marine debris consists of various types of plastic, cloth, foam, styrofoam, glass, ceramics, metal, paper, rubber, and wood [9-11]. The Coastal Area of DKI Jakarta is currently experiencing environmental pressure due to the accumulation of industrial waste, domestic waste, and other waste originating from land and sea, also experiencing pressure due to plastic waste pollution [12]. In the mangrove ecosystem at Pantai Indah Kapuk, it was recorded that the dominant type of micro debris plastic, about 77.7% of the total micro debris, was plastic, followed by styrofoam (18.1%), and the thickness of macro debris reached 180 m [13]. In addition, macro plastic waste is transported from rivers. The river that empties into Jakarta Bay will be trapped on the north coast of Jakarta [14]. Waste produced by the watershed of DKI Jakarta is managed and temporarily accommodated by the UPK Badan Air Emplacement at each special emplacement for aquatic debris. The Pluit Emplacement, which serves two areas, West Jakarta and North Jakarta, has a large organic waste composition, 62.77% of the total 309 tons/day of waste. The waste at the Pluit Emplacement has not been processed and transported directly to the Bantar Gebang Landfill. The amount of waste originating from the Water Agency from 2017-2019 has always increased compared to the amount of land waste in DKI Jakarta [2].
Jambeck et al. [15] is the highest area, producing plastic waste into the sea. Indonesia is considered the second largest contributor to plastic waste in the ocean, between 0.48-1.29 million tons/year. Some estimates suggest that plastic waste accounts for about 10% of global plastic pollution. As much as 70 to 80% of marine debris is plastic originating from the land through rivers [16] intentionally dumped into the sea. In developing countries, the ratio of recycling plastic waste is low. Twelve of the 20 countries with the lowest recycling ratio of plastic waste are Asian countries. The top three countries that experience plastic waste processing errors are China, Indonesia and the Philippines [17]. The accumulation of plastic in waters can harm ecosystems and potentially endanger humans because it carries toxic chemicals that are washed away during plastic degradation in water [18, 19].
The average marine debris release of 23 ± 7.10 tons/day into Jakarta Bay within the plastics category release of 8.32 ± 2.44 tons/day from the Greater Jakarta area [20]. The latest update mentions an increase in marine debris from plastic by 487 tons/day of plastic debris that into the rivers and ended into the Jakarta Bay [21]. Plastic was the dominant type of marine debris recorded 77.7%, followed by styrofoam 18.1% [22].
The Indonesian government has issued Presidential Regulation number 83 of 2018 concerning the handling of marine waste as a follow-up step to the Government of Indonesia's commitment to handling 70% of plastic waste in the sea by 2025. The issuance of this regulation shows the government's seriousness in achieving one of the SDGs targets, namely protecting marine ecosystems. In supporting the achievement of the targets in this regulation 2025 target, multidisciplinary studies partnerships must be improved [23].
Currently, Indonesia still needs a study and field analysis related to the amount of waste, especially plastic waste in the sea, to solve the problem of marine debris in Indonesia to support the targets for the Sustainable Development Goals (SDGs) in 2030. Indonesia's marine debris data is needed to support the target of reducing 70% of waste to the sea by 2025, according to Presidential Decree no. 83 of 2018 concerning the handling of marine debris. Therefore, Indonesia is very timely and provides an ideal forum to explore contemporary issues in the regulation of the marine environment in light of Sustainable Development Goal (SDG) 14 life below water [24].
Jakarta has a smart city program and can play an important role model for other cities and countries experiencing marine debris problems as the nation's capital. However, the increase in waste generation and the high level of illegal dumping into rivers will increase the amount of marine debris. Marine debris in Jakarta is dominated by uncontrolled plastic waste. So that this condition causes an emergency to issue regulations to reduce plastic waste to the sea, to support this, more in-depth research is needed for stakeholder planning. This will also support the safety of underwater life according to the SDGs. This study aims to determine the generation, composition, and potential of waste from Pluit Employment that can be recycled.
2.1 Location and time
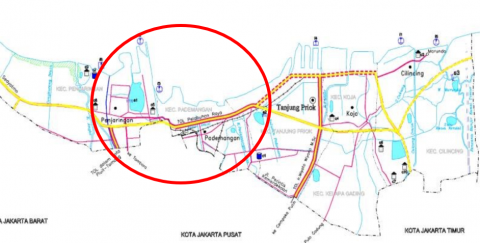
The location of the study area is referred to as the Pluit Employment, which is located in Pluit Village, Penjaringan District, North Jakarta City (Figure 1). The location coordinates are at 6o07'30.1"S and 106o48'05.9"E. The total land area of Pluit Emplacement is 0.28 ha (0.0028 km2). The boundaries of the Pluit Emplacement in the north are Angke River, in the east there is Tubagus Angke Park, in the south there are Jalan Pangeran Tubagus Angke and Mushola Al-Huda Pesing, and in the west there are Flyover Pesing and Jalan Raya Pantura.
At the Pluit Emplacement, the management is only limited to stockpiling, transporting, levelling and not having waste processing facilities. Empalsemen Pluit accommodates waste from 42 points from Penjaringan, Grogol, Petamburan, Kebon Jeruk, Palmerah, and Tamansari sub-districts. In the existing condition, operational hours every day at the Pluit Emplacement are from 08.00 to 16.00.
Figure 1. Marine Debris Study Area at Pluit Emplacement [5]
2.2 Waste generation and composition
After a literature study has been carried out as a reference or guide for the design, data collection is carried out on a primary and secondary basis. First, primary data collection in the form of volume of waste generation is carried out using the load count method measured from the waste that enters [25]. Then the density and composition were carried out according to SNI 19-3964-1994, RCRA Waste Sampling Draft Technical Guidance (EPA, 2002), and water sampling techniques from the World Bank [5].
The measurements were carried out using the load count analysis method, measuring the waste that entered the Pluit Emplacement transported by the conveyance with the sampling procedure based on ASTM E1109 – 86. First, measure the empty sampling box and the volume of the sampling box and then take the waste unloaded from the conveyance using heavy excavator equipment. Then divide the waste into four quadrants (A, B, C, and D) and take the A quadrant waste until it exceeds the height of the sampling box; Beat quadrant waste three times and measure its weight and calculate the density of quadrant A waste. Do the same steps for quadrant B from stages d – i. Next, compute the densities of the A and B quadrants, then compare them with the predetermined difference of 10%. If the difference in the density of quadrants A and B exceeds 10%, take the third quadrant (e.g. quadrant C) to compare the average density of quadrants A and B. To obtain the density of quadrant C, perform the same measurements as the density measurements for quadrants A and B). Then compare the average density of waste A and B with the density of the third quadrant (Quadrant C). The difference for the last comparison should not be more than 5%. If the calculation result of the difference still exceeds 5%, take a new sample from a different conveyance, take steps from the initial stage.
The process stages start from a pile of waste divided into four quadrants, and 1 m3 of each quadrant is taken using an excavator; after that, it is homogenized. The final result of the volume of waste generated is measured to produce waste every day. Next, the waste composition is obtained by comparing the volume of waste of each component with ratio of amount of waste generated (v/v). Finally, the calculation of the waste composition is obtained by Eq. (1).
$\frac{\text { Spesific waste volume }\left(\mathrm{m}^{3}\right)}{\text { Total waste generation }\left(\mathrm{m}^{3}\right)}$ (1)
The disadvantage of measuring with this method is that the results obtained are based on calculations, not the actual total. Accuracy of volume measuring instruments and humans are needed to get specific results. For this reason, in this study, observations were carried out continuously and repeated until the error was less than 10%. Measurements with load count analysis provide advantages in measures that can be carried out repeatedly on the same day, compared to measurements with the total amount of waste that require a lot of sampling surveyors.
2.3 Recycle potential
The potential recycling amount of these materials was calculated from Trihadiningrum et al. [26]. The actual recycling rate of non-compostable waste materials can be determined to determine the recycling potential calculated using Eq. (1) and Eq. (2).
The estimated actual recycling rate of non-compostable waste materials = Estimated actual recycling rate of non-compostable waste/ Total amount of the waste material x 100% (2)
The estimated actual recycling rate of compostable waste materials = Estimated actual recycling rate of compostable waste/ Total amount of the waste material x 100% (3)
3.1 Marine debris generation
The generation of marine debris in Emplacement Pluit for seven consecutive days can be seen in Table 1. The average value of marine debris generation in Emplacement Pluit can reach 230 m3/day. However, the value of marine debris is much higher than the generation that occurred in the Pesanggrahan, which reached 12 m3/day [27]. In Kelupauan Seribu Regency, DKI Jakarta, precisely on Untung Jawa Island, waste generation can reach 5.06 m3/day [28].
If we use the density found in previous studies, which is 1,370 kg/m3 [29], then at least the waste discharged into the Pluit Emplacement stream reaches 303.6 tons/day. The prediction of the amount of waste generated by Cordova and Nurhati, 2019 can reach 23 tons/day into Jakarta Bay [20]. Compared to big cities in Indonesia such as Surabaya City, the waste entering the Pluit Emplacement is also much larger. In contrast, Surabaya City only reaches 94.64 tons/day [30]. The generation of marine debris is mainly caused by garbage from land that is not managed properly and will be carried away through rivers, streams, rain, drainage, wind, or even by humans themselves and ends up in the sea [31]. Dynamic ocean movements result in the spread of marine debris in the sea to the ocean, even to the seabed [32].
Table 1. The generation of marine debris at the Pluit Emplacement for seven consecutive days
|
Time (day) |
Waste Generation (m3/day) |
|
1 |
309 |
|
2 |
145 |
|
3 |
247 |
|
4 |
241 |
|
5 |
204 |
|
6 |
231 |
|
7 |
233 |
|
Average |
230 |
3.2 Composition of marine debris
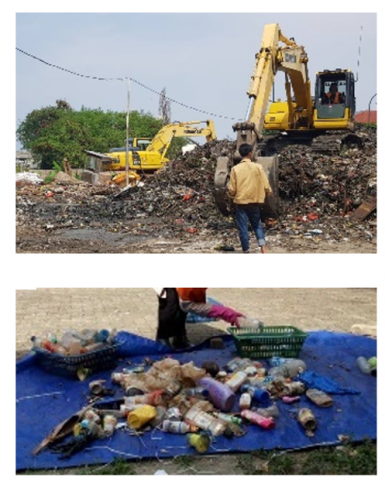
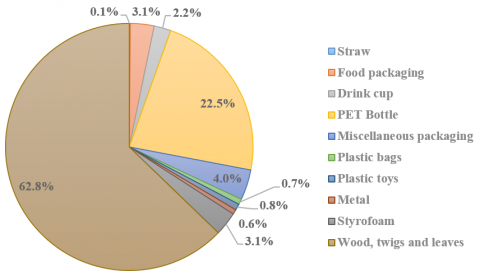
The composition of the weight of waste at Emplacement Pluit based on the amount of each type of waste consists of straw, food packaging, drink cups, pet bottles, miscellaneous packaging, plastic bags, plastic toys, metal, styrofoam, wood, twigs and leaves (Figure 2). The highest percentage of waste was found in biodegradable species, namely wood, twigs, and leaves, as much as 62.8%, followed by PET bottle waste with a value of 22.5% (Figure 3). This is also in line with the percentage of waste by finding that these two types of waste materials are the most found. Wood, twig, leaves, and plastic usually come from wood that drifts from upstream rivers, and is carried to the sea, then thrown again by waves to the beach because of its low density [33, 34].
Figure 2. The existing condition of marine debris for seven consecutive days at Pluit Emplacement
Figure 3. The average composition of marine debris for seven consecutive days at Pluit Emplacement
Plastic waste is more dominant when compared to other types of waste, this is caused by certain factors, which according to Jambeck et al. [15] that plastic is the dominant marine waste because plastic is a pollutant material that has been globally distributed in all waters. Furthermore, due to its durable nature, lightweight and easy to float, the mobility of plastic waste both from land to sea and from sea to land is easier than other types of waste. Derraik [35] also states that plastic is a synthetic organic polymer and has the characteristics of materials suitable for use in everyday life and the types of plastics commonly used in everyday life. Plastic debris including plastic bags, drink bottles, food wrappers, soap wrappers, sacks, straws, styrofoam, tableware and other solid plastics.
Marine debris from plastic types is more dominant than other types that enter the mangrove ecotourism area [36, 37] near Emplacement Pluit. This is because plastic waste is a water pollutant with durable properties that floats effortlessly and has been globally distributed in all marine waters globally, including in Indonesia.
Increasing the amount of plastic production requires plastic classification standards. The plastic classification currently used globally by SPI (Society of the Plastics Industry) is a resin identification code (RIC), which is a plastic classification based on the resin used [38]. Classification can facilitate recycling the plastic waste produced [39, 40].
3.3 Recycle potential
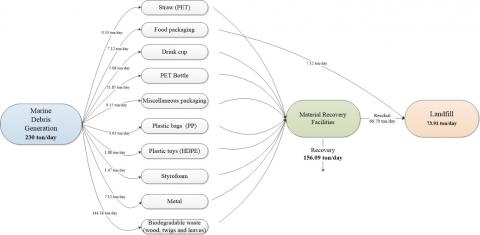
The total weight of waste generated at Emplacement Pluit is 67.86%, with the potential for recycling (Table 2 and Figure 4). The largest source of waste that produces potentially recycled waste is biodegradable waste such as wood, twigs and leaves. Biodegradable waste is a source of waste that produces the most waste per day. The resulting waste is wet waste that can be used as raw material for compost. In the 2018 synthesis report regarding Indonesian Marine Debris, the management of aquatic waste in Jakarta is managed by the UPK of the Water Agency. This management is carried out by collecting waste found on the water's surface carried by currents. The collected waste will be transported by truck, and the transportation is carried out from several points to emplacement locations (transfer stations). Marine debris collection systems downstream can use filter bars to prevent discharge into the marine or ocean. In addition to collecting garbage in the waters, standard excavators, garbage trucks, boat collection, garbage filter bars, and bamboo trash traps can be used [5]. This affects removing biodegradable organic waste in the waters.
Table 2. Potential for recycling of marine debris at Pluit emplacement
|
No |
Component |
Average marine debris generation (ton/day) |
Recycling Potential |
Potential Recyclable Marine Debris (ton/day) |
Residual (ton/day) |
|
1 |
Straw (PET) |
0.33 |
40% [41] |
0.13 |
0.2 |
|
2 |
Food packaging |
7.12 |
0% [42] |
0 |
7.12 |
|
3 |
Drink cup |
5.08 |
34% [43] |
1.73 |
3.35 |
|
4 |
PET Bottle |
51.85 |
52% [44] |
26.96 |
24.89 |
|
5 |
Miscellaneous packaging |
9.15 |
70% [45] |
6.4 |
2.74 |
|
6 |
Plastic bags (PP) |
1.63 |
68% [41] |
1.11 |
0.52 |
|
7 |
Plastic toys (HDPE) |
1.88 |
61% [41] |
1.15 |
0.73 |
|
8 |
Metal |
1.47 |
100% [46] |
1.47 |
0 |
|
9 |
Styrofoam |
7.12 |
23% [45] |
1.64 |
5.48 |
|
10 |
Biodegradable waste (wood, twigs and leaves) |
144.38 |
80% [47] |
115.5 |
28.88 |
|
Total (ton/day) |
230 |
156.09 |
73.91 |
||
|
Rate (%) |
67.86 |
32.14 |
|||
Figure 4. Material balance of potential for recycling of marine debris at Pluit emplacement
The existence of a composting process produces compost with benefits as a material to help enrich the soil by improving the physical, chemical, and biological properties of the soil. The many benefits of compost are recommended to support programs regarding reduce, reuse, and recycling (3R) waste facilities management. This is shown in the 3R waste management site technical guide module issued by the Director-General of Human Settlements [48] that organic waste processing/retention/recycling units and compost storage warehouses are units contained in the 3R waste management site concept.
The recycling rate of plastic waste also tends to be low. Jakarta's identified plastic waste recycling rate is 24% [49]. Therefore, other alternative technologies are also necessary to utilize the plastic waste collected by the community at the waste bank as much as possible. One alternative to plastic waste is recycling activities by making plastic waste as raw material to produce eco-paving blocks. Eco-paving block is a block product made from certain types of plastic waste, specifically PET (polyethene terephthalate) plastics.
There needs to be an alternative recycling process that is more promising and has prospects. One of them is converting plastic waste into oil. This can be done because plastic comes from petroleum, so it needs to be returned to its original shape. In addition, plastic also has a fairly high calorific value, equivalent to fossil fuels such as gasoline and diesel. The technology for converting plastic waste into fuel oil is the cracking process. Plastics into fuel-quality liquid products have been carried out and have shown promising results to be developed [50, 51].
The average marine debris generation in Pluit Emplacement can reach 230 m3/day, where the marine debris mostly consists of biodegradable waste and PET bottles. Therefore, the potential for recycling marine debris at Pluit Employment can reach 67.6% of the total waste. Limitations in this study only show the amount of marine debris in average weather conditions (steady) with no rain, changes in water level, and tides. To prevent bias in peak conditions, further research on unsteady conditions needs to be done. Additional planning for marine debris processing at the study site needs to be carried out for different implementations. In addition, it is also necessary to increase community participation in assisting the implementation of the reduced marine debris program and marine debris recycling efforts following related research. Biological processing technology for biodegradable waste is required, while for the non-biodegradable waste, it can be processed by an energy recovery process. However, to achieve sustainable marine debris reduction is through waste recycling efforts. These efforts can be composting and using PET plastic into paving blocks or fuel. In addition, sustainable research is needed to achieve the 2030 Sustainable Development Goals (SDGs) globally and reduce marine debris following Presidential Regulation No. 83 of 2018 regionally.
This research was implemented and fully supported from the Japan Society for The Promotion Science and Indonesia Directorate General of Research, Technology and Higher Education (JSPS/DG-RSTHE), through a Bilateral Joint Research Projects 2019-2022 between Universitas Pertamina, Indonesia and Toyohashi University of Technology, Japan. Special thanks also extended to UPK Badan Air of Indonesia, who has given the permission to take samples in their working area.
[1] Priscilla, V., Patria, M.P. (2020). Comparison of microplastic abundance in aquaculture ponds of milkfish Chanos chanos (Forsskål, 1775) at Muara Kamal and Marunda, Jakarta Bay. In IOP Conference Series: Earth and Environmental Science, 404(1): 012027. https://doi.org/10.1088/1755-1315/404/1/012027
[2] Ramadhan, M.R.S., Ikhsan, M., Putra, R.M., Simatupang, J.W., Mau, S., Kaburuan, E.R. (2021). Waste-to-energy potential using municipal solid waste as one implementation of Jakarta Smart City. Jurnal Serambi Engineering, 6(4). https://doi.org/10.32672/jse.v6i4.3499
[3] Ramadhan, M.R.S., Ikhsan, M., Putra, R.M., Simatupang, J.W., Mau, S., Kaburuan, E.R. (2021). Waste-to-energy potential using municipal solid waste as one implementation of Jakarta smart city. Jurnal Serambi Engineering, 6(4): 2382-2394. https://doi.org/10.32672/jse.v6i4.3499
[4] Manullang, C.Y. (2020). Distribution of plastic debris pollution and it is implications on mangrove vegetation. Marine Pollution Bulletin, 160: 111642. https://doi.org/10.1016/j.marpolbul.2020.111642
[5] Shuker, I.G., Cadman, C.A. (2018). Indonesia - Marine debris hotspot rapid assessment: Synthesis report (English). Washington, D.C.: World Bank Group. http://documents.worldbank.org/curated/en/983771527663689822/Indonesia-Marine-debris-hotspot-rapid-assessment-synthesis-report.
[6] Lippiatt, S., Opfer, S., Arthur, C. (2013). Marine debris monitoring and assessment: Recommendations for monitoring debris trends in the marine environment. NOAA Marine Debris Division. Technical Memorandum NOS-OR&R-46: 82. http://dx.doi.org/10.25607/OBP-727
[7] Agamuthu, P., Mehran, S.B., Norkhairah, A., Norkhairiyah, A. (2019). Marine debris: A review of impacts and global initiatives. Waste Management & Research, 37(10): 987-1002. https://doi.org/10.1177/0734242X19845041
[8] Iñiguez, M.E., Conesa, J.A., Fullana, A. (2016). Marine debris occurrence and treatment: A review. Renewable and Sustainable Energy Reviews, 64: 394-402. https://doi.org/10.1016/j.rser.2016.06.031
[9] Blanke, J.M., Steinberg, M.K., Donlevy, J.P. (2021). A baseline analysis of marine debris on southern islands of Belize. Marine Pollution Bulletin, 172: 112916. https://doi.org/10.1016/j.marpolbul.2021.112916
[10] Li, D., Zhao, L., Guo, Z., Yang, X., Deng, W., Zhong, H., Zhou, P. (2021). Marine debris in the beilun estuary mangrove forest: monitoring, assessment and implications. International Journal of Environmental Research and Public Health, 18(20): 10826. https://doi.org/10.3390/ijerph182010826
[11] Ivonie, R.N., Mardiastuti, A. (2020). Plastic litter distribution in Pulau Rambut Wildlife Sanctuary. In E3S Web of Conferences, 211: 03020. https://doi.org/10.1051/e3sconf/202021103020
[12] Cordova, M.R., Riani, E., Shiomoto, A. (2020). Microplastics ingestion by blue panchax fish (Aplocheilus sp.) from Ciliwung Estuary, Jakarta, Indonesia. Marine Pollution Bulletin, 161: 111763. https://doi.org/10.1016/j.marpolbul.2020.111763
[13] Suryono, D.D. (2019). Sampah plastik di perairan pesisir dan laut: Implikasi kepada ekosistem pesisir DKI Jakarta. Jurnal Riset Jakarta, 12(1): 17-23. https://doi.org/10.37439/jurnaldrd.v12i1.2
[14] Jasmin, H.H., Purba, N.P., Harahap, S.A., Pranowo, W.S., Syamsudin, M.L., Faizala, I. (2019). The model of macro debris transport before reclamation and in existing condition in Jakarta Bay. Jurnal Ilmu dan Teknologi Kelautan Tropis, 11(1): 131-140. https://doi.org/10.29244/jitkt.v11i1.24777
[15] Jambeck, J.R., Geyer, R., Wilcox, C., Siegler, T.R., Perryman, M., Andrady, A., Narayan, R., Law, K.L. (2015). Plastic waste inputs from land into the ocean. Science, 347(6223): 768-771. https://doi.org/10.1126/science.1260352 https://www.science.org/doi/10.1126/science.1260352
[16] Cable, R.N., Beletsky, D., Beletsky, R., Wigginton, K., Locke, B.W., Duhaime, M.B. (2017). Distribution and modeled transport of plastic pollution in the Great Lakes, the world's largest freshwater resource. Frontiers in Environmental Science, 5: 45. https://doi.org/10.3389/fenvs.2017.00045
[17] Wu, C., Zhang, K., Xiong, X. (2018). Microplastic pollution in inland waters focusing on Asia. In Freshwater Microplastics, 58: 85-99. https://doi.org/10.1007/978-3-319-61615-5_5
[18] He, D., Luo, Y., Lu, S., Liu, M., Song, Y., Lei, L. (2018). Microplastics in soils: Analytical methods, pollution characteristics and ecological risks. TrAC Trends in Analytical Chemistry, 109: 163-172. https://doi.org/10.1016/j.trac.2018.10.006
[19] Suryawan, I.W.K., Sarwono, A., Septiariva, I.Y., Lee, C.H. (2021). Evaluating marine debris trends and the potential of incineration in the context of the COVID-19 pandemic in southern Bali, Indonesia. Jurnal Ilmiah Perikanan dan Kelautan, 13(2). http://dx.doi.org/10.20473/jipk.v13i2.25164
[20] Cordova, M.R., Nurhati, I.S. (2019). Major sources and monthly variations in the release of land-derived marine debris from the Greater Jakarta area, Indonesia. Scientific Reports, 9(1): 1-8. https://doi.org/10.1038/s41598-019-55065-2
[21] Diastomo, H., Surya, M.Y., Sakti, A.D., Agustina, E. (2021). Marine debris tracking from river discharge base on hydrodynamic simulation on Jakarta Bay. In IOP Conference Series: Earth and Environmental Science 925(1): 012005. https://doi.org/10.1088/1755-1315/925/1/012005
[22] Hastuti, A.R., Yulianda, F.R.E.D.I.N.A.N., Wardiatno, Y.U.S.L.I. (2014). Distribusi spasial sampah laut di ekosistem mangrove Pantai Indah Kapuk, Jakarta. Bonorowo Wetlands, 4(2): 94-107. https://doi.org/10.13057/bonorowo/w040203
[23] Purba, N.P., Handyman, D.I., Pribadi, T.D., Syakti, A.D., Pranowo, W.S., Harvey, A., Ihsan, Y.N. (2019). Marine debris in Indonesia: A review of research and status. Marine Pollution Bulletin, 146: 134-144. https://doi.org/10.1016/j.marpolbul.2019.05.057
[24] Long, R., Chaves, M.R. (2018). Chapter 5 bridging the ocean, water and climate action goals under the 2030 agenda on sustainable development. In The Marine Environment and United Nations Sustainable Development Goal, 14: 83-110. https://doi.org/10.1163/9789004366619_010
[25] Suryawan, I.W.K., Septiariva, I.Y., Fauziah, E.N., Ramadan, B.S., Qonitan, F.D., Zahra, N.L., Sarwono, A., Sari, M.M., Ummatin, K.K., Wei, L.J. (2022). Municipal solid waste to energy: Palletization of paper and garden waste into refuse derived fuel. Journal of Ecological Engineering, 23(4): 6474. https://doi.org/10.12911/22998993/146333
[26] Trihadiningrum, Y., Laksono, I.J., Dhokhikah, Y., Moesriati, A., Radita, D.R., Sunaryo, S. (2017). Community activities in residential solid waste reduction in Tenggilis Mejoyo District, Surabaya City, Indonesia. Journal of Material Cycles and Waste Management, 19(1): 526-535. https://doi.org/10.1007/s10163-015-0440-5
[27] Safira, R.H., Sari, M.M., Notodarmojo, S., Inoue, T., Harryes, R.K. (2021). Potential utilization analysis of river waste in jakarta, Indonesia. Geosfera Indonesia, 6(2): 157-172. https://doi.org/10.19184/geosi.v6i2.23297
[28] Darwati, S. (2019). Pengelolaan sampah kawasan pantai. In Prosiding Seminar Nasional Pendidikan Biologi dan Saintek (SNPBS) ke-IV, 417-426.
[29] Sari, G.L., Kasasiah, A., Utami, M.R., Trihadiningrum, Y. (2021). Microplastics contamination in the aquatic environment of Indonesia: A comprehensive review. Journal of Ecological Engineering, 22(10): 127-140. https://doi.org/10.12911/22998993/142118
[30] Nisaa, A.F. (2019). Plastic waste policy in Indonesia: Case study of Surabay city. J. Purifikasi, 20(1): 15-27. https://doi.org/10.12962/j25983806.v20.i1.401
[31] Barnes, D.K., Galgani, F., Thompson, R.C., Barlaz, M. (2009). Accumulation and fragmentation of plastic debris in global environments. Philosophical transactions of the royal society B: biological sciences, 364(1526): 1985-1998. http://doi.org/10.1098/rstb.2008.0205
[32] Van Sebille, E., Aliani, S., Law, K.L., Maximenko, N., Alsina, J.M., Bagaev, A., Wichmann, D. (2020). The physical oceanography of the transport of floating marine debris. Environmental Research Letters, 15(2): 023003. https://doi.org/10.1088/1748-9326/ab6d7d
[33] Honingh, D., Van Emmerik, T., Uijttewaal, W., Kardhana, H., Hoes, O., Van de Giesen, N. (2020). Urban river water level increase through plastic waste accumulation at a rack structure. Frontiers in Earth Science, 8: 28. https://doi.org/10.3389/feart.2020.00028
[34] Cesarini, G., Scalici, M. (2022). Riparian vegetation as a trap for plastic litter. Environmental Pollution, 292: 118410. https://doi.org/10.1016/j.envpol.2021.118410
[35] Derraik, J.G. (2002). The pollution of the marine environment by plastic debris: A review. Marine Pollution Bulletin, 44(9): 842-852. https://doi.org/10.1016/S0025-326X(02)00220-5
[36] Nurdhy, S.N. (2020). Potentials and challenges of existing plastic pollutant biodegradation using bacteria in Jakarta Bay. In Proceeding International Conference on Science and Engineering, 3: 475-485. https://doi.org/10.14421/icse.v3.549
[37] Lestariningsih, W.A., Bengen, D.G., Ismet, M.S. (2020). Relationship between gastropods (Cassidula nucleus and Cassidula vespertilionis) and mangroves (Avicennia marina and Sonneratia alba) in a rehabilitated mangrove ecosystem in Pantai Indah Kapuk, Jakarta, Indonesia. Aquaculture, Aquarium, Conservation & Legislation, 13(4): 2327-2335.
[38] Khajuria, V., Chowdhary, S., Gupta, S., Rani, N. (2016). Evaluation of adherence to RIC standards for plastic packing of liquid pharmaceutical medications. JK Science, 18(4): 252-254.
[39] Gondal, M.A., Siddiqui, M.N. (2007). Identification of different kinds of plastics using laser-induced breakdown spectroscopy for waste management. Journal of Environmental Science and Health Part A, 42(13): 1989-1997. https://doi.org/10.1080/10934520701628973
[40] Chaqmaqchee, F.A. I., Baker, A.G., Salih, N.F. (2017). Comparison of various plastics wastes using X-ray fluorescence. American Journal of Materials Synthesis and Processing, 5(2): 24-27. https://doi.org/10.11648/j.ajmsp.20170202.12
[41] Faraca, G., Astrup, T. (2019). Plastic waste from recycling centres: Characterisation and evaluation of plastic recyclability. Waste Management, 95: 388-398. https://doi.org/10.1016/j.wasman.2019.06.038
[42] Dilkes-Hoffman, L.S., Lane, J.L., Grant, T., Pratt, S., Lant, P.A., Laycock, B. (2018). Environmental impact of biodegradable food packaging when considering food waste. Journal of Cleaner Production, 180: 325-334. https://doi.org/10.1016/j.jclepro.2018.01.169
[43] Kamenetz, A. (2010). The Starbucks Cup Dilemma. Fast Company.
[44] Eunomia. (2020). PET market in Europe: State of play. Production, Collection and Recycling Data, London, UK. https://www.eunomia.co.uk/reports-tools/pet-market-in-europe-state-of-play/.
[45] EuRIC AISBL. (2020). Recycling: Bridging Circular Economy & Climate Policy. https://circulareconomy.europa.eu/platform/sites/default/files/euric_-_plastic_recycling_fact_sheet.pdf.
[46] Dewilda, Y., Aziz, R., Fauzi, M. (2019). Kajian potensi daur ulang sampah makanan restoran di kota padang. Jurnal Serambi Engineering, 4(2): 482-487, https://doi.org/10.32672/jse.v4i2.1325
[47] Trihadiningrum, Y., Wignjosoebroto, S., Simatupang, N. D., Tirawaty, S., Damayanti, O. (2006). Reduction capacity of plastic component in municipal solid waste of Surabaya City, Indonesia. In Proc. International Seminar on Environmental Technology and Management Conference, 7-8.
[48] Direktorat Jenderal Cipta Karya, Buku Pedoman TPS 3R 2017. Jakarta: Kementrian Pekerjaan Umum RI, 2017. http://plpbm.pu.go.id/v2//assets/file/PetunjukTeknisTPS3R2017.pdf.
[49] Putri, A.R., Fujimori, T., Takaoka, M. (2018). Plastic waste management in Jakarta, Indonesia: Evaluation of material flow and recycling scheme. Journal of Material Cycles and Waste Management, 20(4): 2140-2149. https://doi.org/10.1007/s10163-018-0753-2
[50] Sarwono, A., Septiariva, I.Y., Qonitan, F.D., Zahra, N.L., Sari, N.K., Fauziah, E.N., Suryawan, I.W.K. (2021). Municipal solid waste treatment for energy recovery through thermal waste-to-energy in Depok City, Indonesia. Journal of Advanced Research in Fluid Mechanics and Thermal Sciences, 85.
[51] Qonitan, F.D., Suryawan, I.W.K., Rahman, A. (2021). Overview of municipal solid waste generation and energy utilization potential in major cities of Indonesia. In Journal of Physics: Conference Series, 1858(1): 012064. https://doi.org/10.1088/1742-6596/1858/1/012064