Saniwan Buaban* | Vilas Nitivattananon | Sangam Shrestha | Sylvia Szabo
© 2021 IIETA. This article is published by IIETA and is licensed under the CC BY 4.0 license (http://creativecommons.org/licenses/by/4.0/).
OPEN ACCESS
The rapid global increase in Special Economic Zones (SEZs) raises concerns regarding potential impacts on the environment, especially water use intensity, an increased risk of natural disasters, and an elevated greenhouse gas (GHG) emissions. However, studies examining these impacts are limited. Therefore, the aim of this paper is to examine the influence of SEZ development factors on flooding, water scarcity, and GHG emissions using Tak SEZ in Thailand as a case study. A Driver-Pressure-State-Impact-Response (DPSIR) framework, together with structural equation modeling (SEM) through the partial least squares (PLS) approach, has been used to examine the interrelationships between these factors. The results revealed that economic, industrial, and urban development are key drivers associated with flooding, water scarcity, and GHG emissions in the zone. The increased population density, water consumption, waste generation, and vehicular traffic are all significantly put pressure on climate change impacts. The integration of DPSIR framework together with PLS-SEM technique to explore the relationship among multiple sustainability indicators contributes to the existing sustainability assessment methodology. Future research can utilize the presented indicators to identify potential factors for the evaluation of other types of development zones that have a variety of socio-economic activities.
DPSIR framework, holistic approach, influential factor, special economic zone, strategic planning
Special Economic Zones (SEZs) are one of the political tools used to drive national economies. The main characteristics of SEZs include a specified boundary, management by an individual administrative organization, beneficial provisions for investors, and a separated customs area [1]. The general objectives of establishing SEZs are to 1) attract foreign direct investment, 2) serve as ‘pressure valves’ to alleviate large scale unemployment, 3) act as experimental laboratories for the application of new policies and approaches, and 4) support a wider economic reform strategy [2].
The establishment of SEZs has emerged rapidly over the past two decades [3], and this swift increase can have significant impacts on the livelihoods of local communities and the natural environment. While rapid urbanization promises to deliver economic benefits, it is also likely to exacerbate existing vulnerabilities and environmental pressures. Environmental and resource constraints pose challenges for many SEZs [4], and sustainability issues resulting from socio-economic activities in SEZ development are made more complex because of the impacts of climate change. Climate-related hazards can affect the large and local scale economies, as well as household income, health, and general well-being. For example, due to the great floods that occurred in Thailand in 2011, the national GDP in quarter 4 of that year decreased from 2.6 to 1.0 percent, and almost half of all businesses experienced severe to very severe impacts [5]. Such climatic events can therefore influence the future of economic areas, such as SEZs.
The sustainability of the SEZ implies more than an aggregation of the key developmental issues. Importantly, it refers to their interlinkages and the dynamics within a system [6]. Understanding the interactions between urbanization, regionalization, and climate change is necessary for the development of policies related to SEZs, which often have incomplete environmental impact assessments, no urban planning, and little consideration of climate risks.
The potential negative sustainability impacts of SEZs can be minimized by prior sustainability assessments (SAs). However, existing assessments tend to concentrate on only a single aspect of sustainability, such as the availability of natural resources, economic profitability, or environmental impacts [7]. Many studies have singularly focused on groundwater resource exploitation, industrial SO2 emissions, or national and regional CO2 [8-10]. Specific methods have been adopted to examine their determinants. For example, the LMDI model is widely used to identify influential factors of CO2 emissions within the limited scope of the factors (e.g. GDP per capita, population, energy consumption intensity, etc.) which is not comprehensive enough [11-13]. Exploring influential factors of water resources and flooding issues is usually undertaken using qualitative methods [14, 15], which does not allow measuring the exact level of influence. These methods are not ideal within the context of SEZs, which are at the center of many economic development activities. Driven by the business and private sectors, little consideration has been paid to climate risks. In order to identify and assess the impact of SEZ development policies on the sustainability of the area, the inter-relationships between the various factors behind SEZ development need to be deeply understood. Therefore, ex-ante assessments should be more strategic, comprehensive, and integrative [16], hence, a more holistic trans-disciplinary approach is needed [17].
Therefore, this study aims at filling the methodological gap resulting from fragmented and reductionistic SAs by establishing a connection between socio-economic development and social and environmental impacts in the context of SEZ development. To this end, a Driver-Pressure-State-Impact-Response (DPSIR) framework was adopted to understand the dynamic effects of socio-economic development on the key sustainability issues associated with SEZ development.
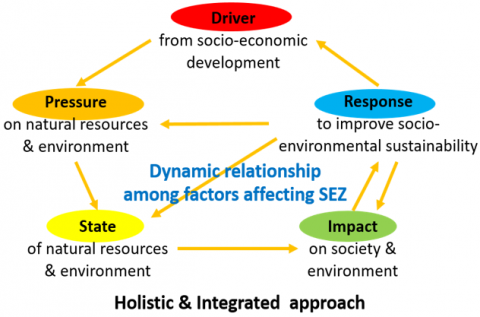
The DPSIR approach has been widely used to both qualitatively and quantitatively explore the relationships among factors in complex systems, including social, political and environmental systems [18]. According to Hazarika and Nitivattananon [8], drivers represent the major social and economic developments that affect people’s lives and the environment, while pressure is the stress that can result from driving forces. State refers to a status that can be changed by pressure, and impact is the effect from the development that can provide either positive or negative results. Finally, responses involve actions from relevant sectors that are needed to avoid, reduce/mitigate, or enhance either the drivers, pressures, states, or impacts. Figure 1 illustrates the relationships among DPSIR components in the framework.
The DPSIR framework is normally used as a tool during development to achieve sustainability in sectoral development, large-scale area planning, and even specific issues [19]. While DPSIR analyses aim to achieve sustainable development, most studies have applied this framework in a retrospective fashion to evaluate sustainability [20]. Rarely has this approach been used as a prospective SA tool for policy, plan, and program (PPP).
Thus, the objective of this paper is to assess the relationships between socio-economic development, society, natural resources and the environment in the development of SEZs, by applying the DPSIR concept to the Tak SEZ in Thailand as a case study. The main expected outcomes are 1) an improved understanding of the relationship between SEZ development and sustainability issues, and 2) the attainment of detailed information on the socio-economic and environmental impacts in relation to SEZ development, namely in terms of climate-related security risks, water resources and atmospheric emissions. Interrelationships between such influential factors as water and climate-related issues are likely to emerge from SEZ development, thus, highlighting the need for a holistic approach during the strategic development of SEZ policy.
The Tak SEZ, the first border economic zone in Thailand, was first established in 2004 [21] and was formally launched at the end of 2015 [22]. The zone is located in the western part of Thailand and shares a border with Myanmar (Figure 2). Defining the area boundaries for the current study proved somewhat challenging as the Tak SEZ covers parts of three districts in the Tak province, including Mae Ramat, Mae Sot, and Phop Phra. As this study relies on series data from historical time, the study area boundary was based on administrative districts. Significantly, more than 50% of the SEZ total area falls into the Mae Sot administrative jurisdiction (Figure 2) wherein land use in this region is targeted as the center of development activities. Therefore, the data set used in the current study was collected only from the Mae Sot administrative district and serves as a proxy for the whole Tak SEZ.
The Tak SEZ has issues vis-a-vis several climate-related hazards. The area frequently experiences water shortages, especially in the summer season, and droughts can occur. The area also often has floods during the rainy season and ineffective flood prevention measures directly affect community security. A report from the ONEP [23] shows that the Tha Sai Luad sub-district, a location for various industries and warehouses, is located in a low lying area and communities in this region are at a high risk for both flash flooding and drought. The report also emphasizes that the frequency and effects of these disasters tend to increase over time. Thus, this area is vulnerable to climate change.
Figure 1. The DPSIR causal framework (Source: Modified from [9])
Figure 2. Map of the Tak province (Source: Created by ArcMap 10.7, data from [24])
2.1 Conceptual framework
As outlined above, many studies have employed specific models to explore the potential impacts of single specific environmental issues [9, 10, 25]. Here, we have adopted a holistic DPSIR framework to explore the interrelationships between various factors associated with climate-related issues and SEZ development factors. The DPSIR model was established to analyze five factors: 1) driving factors from economic and social development, 2) pressures on local society, natural resources and the environment, 3) the state factors of society, natural resources and the environment, 4) the impacts on society, natural resources and the environment, and 5) responses to improve sustainable development. A flow chart outlining this model is shown in Figure 3.
Figure 3. The DPSIR conceptual framework (Source: Modified from [19, 26])
To summarize the model, SEZs can be viewed as systems where there are pressures from the socio-economic drivers of change that may ultimately require a response to promote sustainability (Figure 3). For example, economic, infrastructural, industrial, and urban development are all driving factors that can increase pressure on natural resources and the environment. These pressures, in turn, can result in various impacts on society and the environment. In the case of these changes, both public and private authorities may need to respond to improve socio-environmental sustainability by dealing with the influential driving factors. Of course, in this holistic model, all of these factors may influence each other within the SEZ system.
2.2 Analytical procedure
The DPSIR candidate indicators were developed based on a review of previous DPSIR studies, analyzing water issues and climate-related hazards. The set of candidate indicators were then finalized by experts from several relevant agencies. The main influential factors selected by the panel were subsequently used to construct the DPSIR model to explore the relationships among the indicators in the SEZ system. The specific details of each step are outlined below.
2.2.1 Selection of DPSIR candidate indicators
The observable candidate indicators were obtained using secondary data from a literature review and primary data from stakeholder discussion.
First, the literature review was conducted using social science databases and the candidate indicators were selected from journal articles, project reports, and case studies. The articles using a DPSIR framework to evaluate issues surrounding water resources, water-related hazards, and greenhouse gas (GHG) emissions, were chosen based on their relevancy to the SA and the challenges associated with SEZ development. The similar indicators were grouped together to make it is easier when consulting with the stakeholders.
Then, round table meetings with public/ private agencies and group discussions with local communities were used in order to develop an understanding of the relevant DPSIR factors associated with the Tak SEZ. The interview guide questions used during these meetings were designed to be as comprehensive as possible. Each candidate indicator was analyzed based on probable maximum data availability and applicability to the local setting. A causal effect diagram was used as a supporting tool in building the relationships among DPSIR components. Some of the indicators pre-selected from the literature were needed to be recategorized into five factor categories of the DPSIR model. The common indicators in the same component (D-P-S-I-R) were chosen for expert validation.
2.2.2 Confirmation of DPSIR indicators
DPSIR indicators can vary by location, scale, and other factors [27]. In order to reduce the large number of indicators gathered from literature review and stakeholder consultations, candidate indicators were reviewed by several experts.
Experts in areas relevant to the study were invited to complete a questionnaire, rate the suitability of the candidate indicators as well as the relevancy to the context of SEZ. These individuals had expertise in fields such as hydrology, water resources, disaster prevention and mitigation, air/water pollution, policy and planning, urban environmental management, and socio-economic impact assessments. Most of the experts worked for the central government or academic institutions. Previous studies have revealed that, when an expert judgment is used, the error can be very small; particularly, when the number of specialists is between 13 and 25 [28]. In total, the questionnaires were electronically distributed to 30 experts.
A Likert scale was used by the experts to rate the suitability of each candidate indicator. The scale included five levels: 1) Not suitable, 2) Quite unsuitable, 3) Not sure, 4) Quite suitable, and 5) Most suitable. The indicators on the questionnaire were tested for reliability and internal consistency using Cronbach’s alpha.
SPSS software was used to calculate the median from the ratings for each candidate indicator. The formula for the median is shown in Eq. (1).
$M e d=L o+I \frac{\left(F_{n}-F_{1}\right)}{\left(F_{1}-F_{2}\right)}$ (1)
where:
N = Number of data points
Fn= N/2
F1 = F next to Fn with a value less than Fn
F2= F next to Fn with value more than Fn
Lo = Actual lower limit of F2
I = Interval of the actual lower limit of level of F2
The median values were interpreted as 1) 1.00 - 1.49 = Not suitable, 2) 1.50 - 2.49 = Quite unsuitable, 3) 2.50 - 3.49 = Neutral, 4) 3.50 - 4.49 = Quite suitable, and 5) 4.50 - 5.00 = Most suitable. Only the indicators identified as the most suitable were chosen for further analysis.
2.2.3 Exploration of the main driving factors
The driving factors selected for a DPSIR analysis should have high degree of correlation with the dependent variables to provide the most accurate assessment. Thus, a correlational analysis was performed in order to examine the relationships between the identified independent variables and each dependent variable. The variables with non-significant correlations (p-value > 0.01, which corresponds to a 99% confidence) were excluded from further analysis to prevent multicollinearity [29].
When the correlation coefficient approaches 1.0, the results of the analysis are likely to be more accurate. If we require the correlation coefficient to be between 0.8 - 0.9, a minimum of sample size should be between 8 and 11 observations for each variable to achieve reliable results (for one correlation test with power = 90%, alpha = 0.05) [30]. Due to the Tak SEZ, launched recently in 2015 (less than the required 8 years of observations); the correlations in this study were modeled for 11 years, from 2008 to 2018, the latest year which data is available for. The indicator values were obtained from the relevant government agencies responsible for each indicator. The main source of data was the National Statistical Office (NSO).
2.2.4 Construction of the DPSIR model for the Tak SEZ
After the set of factors was selected, the DPSIR indicators were used to construct a structural equation model (SEM). In case, a variable could be measured directly, or measured through an indicator, and converted to a total or Z-score or Mean or Factor score, Path analysis (PA) or Path modeling (PM) can be applied. On the other hand, if the variable is a concept, like the DPSIR conceptual framework, which cannot be measured directly (known as a latent variable), it must be measured through indicators (e.g., index, dummy, manifest variables) and presented in the form of the SEM to show the measurement model [31].
Due to the limitations of the recorded historical data, a partial least squares (PLS) regression model was used to explore the path relationships between the identified climate-related issues and their influential factors. SmartPLS® software was used to carry out this analysis. The PLS technique can be used with small samples, non-normally distributed data, and formative measures, and focuses on prediction, model complexity, and exploratory research [32]. The impact indicators were defined as dependent variables (Y), while the driver indicators were used as independent variables (X). In order to identify the factors affecting key issues, a general regression model was constructed as shown in Eq. (2).
$Y_{i}=\beta_{0}+\beta_{1} X_{1, i}+\beta_{2} X_{2, i}+\cdots+\beta_{n} X_{n, i}+u_{i}$ (2)
where:
$\beta_{0}$, $\beta_{1}$, …, and $\beta_{n}$ = Estimated parameters,
Xk,i = ith observation of Xk,
ui = The random error term of observation i.
3.1 DPSIR framework to valuate key climate-related issues associated with SEZ development
A total of 167 candidate factors were selected from the literature based on relevancy and probable availability of long-term historical data. The candidate indicators were then grouped and categorized into 76 observable variables under 29 latent variables, according to the DPSIR categories (Figure 4).
Figure 4. The DPSIR framework used in this study (Source: Literature review and stakeholder group discussions)
Stakeholders mentioned that water shortages were one of their key sustainability concerns. Water demand in the Tak SEZ will likely continue to increase due to the expansion of domestic and industrial water use, while the supply remains uncertain. Changes in water availability are also influenced by climate change. Increasing the use of ground water and water recycling by industry may help to reduce the risk of water scarcity but the impacts of these changes may not be significant.
Natural disasters constitute another security concern for local people as climate change is linked closely to sustainability in the zone. Industry, transport and energy sectors are major emitters of GHGs, including CO2 and CH4; emission trends are perpetually increasing. While exact figures on emissions from the industrial sector in the Tak SEZ are not available, based on air pollution monitoring stations in the province, it is clear that pollution from industrial activities and transportation is a persistent problem. As far as impact is concerned, changing rainfall and temperature patterns are resulting in more frequent and intense flooding beside longer and hotter drought periods. Local communities raised the point that the area still lacks a comprehensive disaster preparation and mitigation plan. These observations indicate that communities in the SEZ are highly vulnerable to climate change impacts.
3.2 DPSIR indicator set
As outlined above, the 76 candidate variables were evaluated for their suitability by identified experts. Amongst the thirty questionnaires that were distributed, only 14 completed forms were returned. Analysis of the responses indicated that 53 of the variables were identified as the most suitable indicators (Median values = 4.50-5.00). The selected indicators and their descriptive statistics are shown in the Appendix. However, only 38 of them have sufficient data for further statistical analysis (Table 1).
3.3 Main influential factors associated with the key climate-related issues
The selected indicators were analyzed to identify the main influential factors. First, a correlational analysis was performed to ensure significant correlations between the independent variables and each dependent variable (i.e. impacts). The factors that are significantly associated with floods, water scarcity and GHG emissions are shown in Table 2.
As can be seen from Table 2, most indicators of economic, industrial, and urban development are positively associated with all three climate-related issues.
In particular, the analysis suggests that urban development, as indexed by the urbanization rate, is a key driver for community vulnerability to flooding (r = 0.835, p = 0.001). Among the pressure and stress indicators, population density (r = 0.851, p = 0.001), and the percentage of urban population (r = 0.847, p = 0.001) are also strongly associated with flooding. Clearly, greater urbanization increases the chances of a community confronting natural disasters. Other indicators of economic, industrial, and urban development are also associated with flooding (See Table 2), although to a lesser degree.
Table 1. The DPSIR factors associated with impacts on local society, natural resources and environment, focusing on climate-related issues
|
Latent variables |
References |
ID |
Observable variables |
References |
|
Drivers |
|
|
|
|
|
Economic development |
[15, 33, 34] |
DE1 |
Average income per capita (baht/person/year) |
Stakeholder consultation |
|
DE3 |
Border trade value (Mbaht) |
Stakeholder consultation |
||
|
DE4 |
Value of investment within SEZ (Mbaht) |
[2, 35] |
||
|
Infrastructure development |
Public participation |
DI1 |
Investment in Industry, Infrastructure, Real estate, Public utilities (Bbaht) |
[35], [36] |
|
Industrial development |
[27, 33] |
DN2 |
Number of factories registered in the area (factory) |
Stakeholder consultation |
|
DN3 |
Energy used in industrial sector (MW) |
[15, 7] |
||
|
Urban development |
[8, 27, 33] |
DU2 |
Urbanization rate (%) |
[9, 10] |
|
DU5 |
Energy demand from household sector (MW) |
[36, 37] |
||
|
Pressure |
|
|
|
|
|
Population density |
[9, 10] |
PP1 |
Population density (persons/km2) |
[9, 10] |
|
Traffic density |
Public participation |
PT1 |
Traffic Density (vehicle/km) |
Stakeholder consultation |
|
PT2 |
Volume-to-Capacity Ratio (V/C) (vehicle) |
Stakeholder consultation |
||
|
Energy consumption |
[33] |
PE1 |
Total energy consumption (kWh/year) |
[10] |
|
PE2 |
Energy consumption per capita (kWh/person) |
[10] |
||
|
Water consumption |
[33] |
PW2 |
Sectoral water use rate (m3/day) |
[27, 34, 38, 39] |
|
Waste disposal |
[33] |
PA1 |
Amount of waste generated from industrial and municipal sectors (ton/day) |
[2, 40, 41] |
|
PA3 |
Amount of waste accumulated (ton) |
Stakeholder consultation |
||
|
Increased GHG emissions |
[15] |
PG1 |
Carbon emission per energy consumption (kgCO2eq/kWh) |
[10] |
|
PG2 |
Annual Average Daily Traffic (AADT) (vehicle) |
Stakeholder consultation |
||
|
Climate change |
[27, 42, 43] |
PC1 |
Number of days of extreme rainfall (Precipitation > 80 mm) (day/year) |
[44] |
|
PC2 |
Maximum precipitation (mm) |
[42, 44] |
||
|
PC3 |
Total precipitation in rainy season (mm) |
[44] |
||
|
State |
|
|
|
|
|
Demographics |
[10] |
SD1 |
Total population (people) |
[10] |
|
SD2 |
Urban population (% of total population) |
[10] |
||
|
Available water resources |
[27, 34] |
SB1 |
Water budget (Mm3) |
Stakeholder consultation |
|
Water quality |
Public participation |
SW1 |
Water Quality Index (WQI) |
Stakeholder consultation |
|
Air quality |
Public participation |
SA2 |
Average PM2.5 or PM10 concentration (µg/m3) |
[19] |
|
Precipitation pattern |
[15, 34] |
SP1 |
Change in annual rainfall from base year value (%) |
[44] |
|
Occurrence of floods |
[15, 33, 42] |
SO1 |
Number of flood events (time) |
[44] |
|
Impact |
|
|
|
|
|
Flood damage |
[33, 45] |
IF2 |
Number of households affected by flood (household) |
[33] |
|
IF3 |
Economic loss (baht) |
[33] |
||
|
IF5 |
Vulnerability Index |
[44] |
||
|
Water resource scarcity |
[34, 43] |
IW2 |
Level of water stress (%) |
[46] |
|
Emission levels |
[9] |
IG1 |
Total GHGs emission (kgCO2eq) |
[37, 39, 47] |
|
Response |
|
|
|
|
|
Environmental development project |
[33, 43] |
RS1 |
Ratio of environmental protection investment as a percentage of total investment (%) |
[10] |
|
RS2 |
Investment of water project (Mbaht) |
[8, 34] |
||
|
Waste management |
Public participation |
RM1 |
Urban solid waste with proper disposal (ton/day) |
Stakeholder consultation |
|
RM2 |
District recycling rate (%) |
[37] |
||
|
Afforestation |
[33, 34] |
RA1 |
Growth rate of forest cover rate (%) |
Stakeholder consultation |
Source: Literature review and Public participation
Table 2. Influential factors associated with water scarcity, flooding, and GHG emissions
|
|
I |
|||||
|
|
Floods |
Water scarcity |
GHG emissions |
|||
|
|
Factor |
ID |
|
IF5 |
IW2 |
IG1 |
|
D |
Economic development |
DE1 |
r Sig. |
|
.901** 0.000 |
.684* 0.020 |
|
DE3 |
r Sig. |
|
.890** 0.000 |
.641* 0.034 |
||
|
DE4 |
r Sig. |
.647* 0.031 |
.975** 0.000 |
.650* 0.030 |
||
|
Industrial development |
DN2 |
r Sig. |
|
.890** 0.000 |
.670* 0.024 |
|
|
DN3 |
r Sig. |
.678* 0.022 |
.974** 0.000 |
.626* 0.039 |
||
|
Urban development |
DU2 |
r Sig. |
.835** 0.001 |
.871** 0.000 |
|
|
|
DU5 |
r Sig. |
.662* 0.026 |
.980** 0.000 |
.618* 0.043 |
||
|
P |
Population density |
PP1 |
r Sig. |
.851** 0.001 |
.902** 0.000 |
|
|
Energy consumption |
PE1 |
r Sig. |
|
.715* 0.013 |
|
|
|
PE2 |
r Sig. |
|
.665* 0.025 |
|
||
|
Water consumption |
PW2 |
r Sig. |
.742** 0.009 |
.997** 0.000 |
|
|
|
Waste disposal |
PA1 |
r Sig. |
.828** 0.002 |
.926** 0.000 |
|
|
|
PA3 |
r Sig. |
|
.669* 0.024 |
.757** 0.007 |
||
|
Increased GHG emissions |
PG1 |
r Sig. |
|
-.626* 0.039 |
-.605* 0.048 |
|
|
PG2 |
r Sig. |
.656* 0.028 |
.745** 0.009 |
|
||
|
S |
Demographics |
SD1 |
r Sig. |
.844** 0.001 |
.896** 0.000 |
|
|
SD2 |
r Sig. |
.847** 0.001 |
.886** 0.000 |
|
||
|
Available water resources |
SB1 |
r Sig. |
|
-.778** 0.005 |
-.708* 0.015 |
|
|
Air quality |
SA2 |
r Sig. |
|
.634* 0.036 |
|
|
|
Occurrence of disaster events |
SO1 |
r Sig. |
.737* 0.037 |
|
|
|
|
R |
Waste management |
RM1 |
r Sig. |
-.678* 0.022 |
-.964** 0.000 |
|
|
RM2 |
r Sig. |
-.698* 0.017 |
-.941** 0.000 |
|
||
|
Afforestation |
RA1 |
r Sig. |
|
-.688* 0.019 |
-.728* 0.011 |
|
Note: r = Correlation Coefficient, ** Correlation is significant at the 0.01 level (2-tailed), * Correlation is significant at the 0.05 level (2-tailed).
The correlational analysis also shows that indicators of economic, industrial, and urban development are strongly associated with water resource scarcity. Among the economic development indicators, average income per capita (r = 0.901, p = 0.000), border trade value (r = 0.890, p = 0.000), and value of investment within the SEZ (r = 0.975, p = 0.000) positively correlate with the degree of water scarcity. With regard to industrial indicators, the number of factories registered in the area (r = 0.890, p = 0.000) and the energy used in the industrial sector (r = 0.974, p = 0.000) are also positively associated with water scarcity. In addition, indicators of urban development, including the urbanization rate (r = 0.871, p = 0.000) and energy demand from the household sector (r = 0.980, p = 0.000) are strongly positively correlated with the degree of water scarcity (See Table 2). Thus, the increased water consumption associated with these driving factors likely increases the risk of communities having to confront a drought situation. It should also be noted that the state of water availability has an inverse relationship with the level of water stress (r = - 0.778, p = 0.005).
With regard to GHG emissions, most indicators of economic, industrial and urban development (with the exception of urbanization rate) significantly associate with the level of emissions in positive manner (See Table 2). In addition, the pressure from the amount of waste accumulated is associated with GHG emissions (r = 0.757, p = 0.007). Accumulated waste can emit CH4, one of the key harmful GHGs, which may increase environmental pollution.
3.4 DPSIR and PLS-SEM model evaluation of key climate-related issues that likely result from SEZ development
The external load coefficients between the first- and second-level indices were calculated. With the PLS-SEM method, a negative value and a value less than 0.5 for the loadings of the observable variables indicate non-significant variables. The non-significant variables were excluded from the SEM to prevent multicollinearity [48]. The validity of the PLS-SEM results can be tested through factor loading (basically known as path coefficient: PC), Cronbach's alpha (αq), and R2 values [49]. As a rule of thumb, the statistical analysis results are significant when loading ≥ 0.707, or at least 0.500, which indicates that the Average Variance Extracted (AVEq) is ≥ 0.500. In addition, the Cronbach's alpha, which combines the correlations with equal weights, should be ≥ 0.700. The Composite Reliability (CR or ρ), which combines the loading values with the same weight, should be ≥ 0.600 [31, 50]. Figure 5 illustrates the DPSIR and PLS-SEM model used to evaluate the various indicators of SEZ development that are associated with climate-related issues. The path coefficients for each indicator and DPSIR category are shown.
As can be seen from Figure 5, analysis showed that the pressure indicators have the most influence on climate-related issues (PC = 0.721), while the response indicators have the least influence (PC = 0.050). Analysis also shows that the reliability and validity of the utilized DPSIR model was adequate. Each DPSIR category exhibited a high Cronbach's alpha (with the exception of state), thus, implying a high degree of internal consistency (See Table 3). The CR and AVEq also pass the criteria of a good statistical significance.
Figure 5. The DPSIR and PLS-SEM model (Source: PLS-SEM analysis, using SmartPLS® 3.0)
Table 3. Reliability of the DPSIR categories
|
|
Cronbach's alpha |
rho_A |
CR |
AVEq |
|
Driver |
0.983 |
0.984 |
0.986 |
0.908 |
|
Impact |
0.770 |
0.828 |
0.870 |
0.694 |
|
Pressure |
0.915 |
0.943 |
0.940 |
0.761 |
|
Response |
0.996 |
0.996 |
0.998 |
0.996 |
|
State |
-0.074 |
0.894 |
0.704 |
0.802 |
Source: PLS algorithm, using SmartPLS® 3.0
Moreover, the validity of the separate DPSIR categories was assessed by calculating discriminant validity values, which indicate the degree of differentiation among all the categories. For adequate discriminant validity, the square roots of the average extracted variance of the variables should be above the absolute value of the corresponding correlation coefficients of the variables and over 0.50 [51]. Analysis showed that all of the discriminant validity values were above the absolute value of the corresponding correlation coefficients of the variables and over 0.50, which implies that DPSIR model is valid (Table 4).
Table 4. Discriminant validity of the DPSIR categories
|
|
Driver |
Impact |
Pressure |
Response |
State |
|
Driver |
0.953 |
|
|
|
|
|
Impact |
0.931 |
0.833 |
|
|
|
|
Pressure |
0.965 |
0.969 |
0.873 |
|
|
|
Response |
-0.945 |
-0.884 |
-0.924 |
0.998 |
|
|
State |
0.957 |
0.965 |
0.985 |
-0.907 |
0.896 |
Source: PLS algorithm, using SmartPLS® 3.0
The SEZ system is complex and comprised of various socio-economic activities. SEZ policy planning tends to focus more on socio-economic development while ignoring potential environmental impacts, especially with regard to climate change. In order to effectively plan for sustainable SEZs, key issues related to climate impacts need to be understood. As the factors associated with SEZ development are interconnected, a holistic approach is needed to assess this complex system. Therefore, this study adopted a DPSIR framework to explore the influential factors associated with climate-related risks.
Overall, the analysis showed that production and human activities in the Tak SEZ place increased pressure on natural resources and the environment, which, in turn, impact community safety and security. When considering each factor separately, the current analysis indicated that economic, industrial, and urban development are all driving factors associated with flooding, water scarcity, and GHG emissions. The SEM analysis also showed that pressure indicators, including increased population density, water consumption, waste disposal, and vehicular traffic are most closely associated with the climate-related issues in the Tak SEZ.
Based on the results of the correlational analysis, it can be concluded that economic development, rapid industrialization, and urbanization are among the significant anthropogenic driving factors associated with climate-related changes in the SEZ. In particular, urbanization is closely associated with an increased risk of flooding. Besides, water scarcity is linked with all three types of development, and GHG emissions are moderately linked with the three categories of development.
Increased water consumption from development within the SEZ places significant stress on water resources within the zone. The intensive use of water resources from various sectors, including industrial plants and households, contribute to pressure on the water supply. These observations are consistent with the DPSIR results of Pandey and Shrestha [27], which indicate that industry, energy demands, and an increased number of households are driver indicators for water quantity issues. In addition, the qualitative DPSIR study by Hazarika and Nitivattananon [8] affirms that population increases and urbanization are key drivers for groundwater resource exploitation and can result in a significant decline in the groundwater level.
Climate change resulting from SEZ development activities may also exacerbate an already precarious water resource situation, and, consequently, may contribute to flooding risks within the zone. Climate change is associated with alterations in rainfall patterns and temperature, which can affect both water availability and increase the risk of natural disasters. For instance, heavy rainfall may lead to severe flooding, while intermittent rain in the summer season can lead to water supply problems. The current results indicate that development in SEZs may increase these risks via climate-related changes due to heightened GHG emissions.
Indeed, economic, industrial, and urban development in the SEZ drive the demand for fuel for increased freight and vehicular traffic, increased power for industrial production processes, and increased electricity demand for household use. These increased demands clearly increase GHG emissions in the Tak SEZ. Additionally, increased waste disposal in the SEZ places stress and pressure on local communities and contributes to the emission of GHGs.
The results outlined above indicate the need for several mitigation strategies to promote the sustainability of the Tak SEZ. In particular, both supply- and demand-side mitigation measures should be implemented to reduce industrial and household water use in the zone. Besides, policies to lower the rate of GHG emissions, including decrease in vehicular traffic and waste disposal, should be developed. Moreover, the adaptive capacity of local communities to deal with flooding needs improvement to reduce the risks associated with natural disasters. Apparently, hard infrastructure within the SEZ should be constructed, including flood control measures and improved drainage systems, and an early warning system for flood-related emergencies. The vulnerability to climate hazards could also be reduced by increasing the dissemination of knowledge related to disaster prevention.
There are several limitations to this study, the recording of the amount of historical data being the preliminary limitation. With regards to factor analysis, a larger number of samples contribute to more robust results [52]. Comprehensively, as the geographical scope of this study was restricted to district level boundaries, the data pertaining to the collection of long and continuous historical time-series was assiduously challenging in nature. Thus, the study defined the probable availability of long-term historical data as one criterion in selecting the indicators to avoid a large amount of missing value.
The current findings have identified several driving factors, including economic, industrial, and urban development, that are associated with climate-related issues in the Tak SEZ. The path coefficient of the driving factors and the impact factors is -0.062, indicating that economic, industrial, and urban development have a negative effect on water resources, natural disasters, and GHG emissions. Contrarily, the pressure and state factors have significant positive impact on the climate related issues (PC = 0.721, 0.359 respectively), while the influence is low between the response and the impact (PC = 0.050). The identification of these factors should help policy-makers, evaluators, and the public understand the potential impacts of SEZ development on sustainability, especially with regards to water resources, natural disaster risks, and GHG emissions. These findings simultaneously highlight several mitigation strategies that may help to minimize the environmental risks associated with SEZ development.
The indicators presented in the current study will be helpful for future investigators working on identifying potential variables for the evaluation of other types of development zones that have a variety of socio-economic activities. The integration of holistic thinking using DPSIR framework together with PLS-SEM technique to explore the relationship among multiple sustainability indicators contributes to the existing methodology for assessing large scale area-based development, like SEZs. Future studies could also use the PLS-SEM model to estimate the dynamic effects of socio-economic development on dependent variables in these systems in order to prevent/ mitigate potential impacts that may occur from the proposed development by dealing with the main development factors related to the outcomes. Directions for the future could then be suggested through development modification. The results of this study may further assist in planning more effectively, which would then lead to greater sustainability in any regional development.
This work is supported by a Royal Thai Government scholarship as part of a PhD dissertation. The authors would like to thank local authorities, including key stakeholders and local communities, for providing insightful information on the focused issues.
|
Label |
Name |
N |
Median |
Mode |
Std. Deviation |
Percentiles |
|||
|
Valid |
Missing |
25 |
50 |
75 |
|||||
|
DE1 |
Income/capita |
12 |
2 |
5.00 |
5 |
0.900 |
4.25 |
5.00 |
5.00 |
|
DE2 |
Registered of juristic person |
13 |
1 |
4.00 |
3a |
0.870 |
3.00 |
4.00 |
4.00 |
|
DE3 |
Border trade value |
12 |
2 |
4.50 |
5 |
1.193 |
4.00 |
4.50 |
5.00 |
|
DE4 |
Investment value |
12 |
2 |
5.00 |
5 |
0.622 |
5.00 |
5.00 |
5.00 |
|
DI1 |
Investment in infrastructure |
14 |
0 |
4.50 |
5 |
0.914 |
4.00 |
4.50 |
5.00 |
|
DI2 |
Profitability of infrastructure |
13 |
1 |
3.00 |
4 |
1.256 |
2.00 |
3.00 |
4.00 |
|
DI3 |
Construction land |
12 |
2 |
3.50 |
3 |
1.243 |
3.00 |
3.50 |
4.75 |
|
DN1 |
Gross value of fixed assets |
11 |
3 |
4.00 |
4 |
1.168 |
3.00 |
4.00 |
5.00 |
|
DN2 |
Registered factory |
14 |
0 |
4.50 |
5 |
0.825 |
3.75 |
4.50 |
5.00 |
|
DN3 |
Industry electricity demand |
14 |
0 |
4.50 |
5 |
1.269 |
3.75 |
4.50 |
5.00 |
|
DU1 |
Population growth |
11 |
3 |
4.00 |
4 |
0.647 |
4.00 |
4.00 |
5.00 |
|
DU2 |
Urbanization rate |
14 |
0 |
4.50 |
5 |
0.949 |
3.00 |
4.50 |
5.00 |
|
DU3 |
Urban growth rate |
11 |
3 |
4.00 |
4a |
0.831 |
3.00 |
4.00 |
5.00 |
|
DU4 |
Urban employment rate |
14 |
0 |
5.00 |
5 |
0.852 |
4.00 |
5.00 |
5.00 |
|
DU5 |
Household electricity demand |
12 |
2 |
4.50 |
5 |
1.505 |
3.25 |
4.50 |
5.00 |
|
PP1 |
Population density |
11 |
3 |
5.00 |
5 |
0.505 |
4.00 |
5.00 |
5.00 |
|
PI1 |
Road density |
12 |
2 |
4.00 |
4 |
0.793 |
3.00 |
4.00 |
4.75 |
|
PT1 |
Traffic density |
14 |
0 |
4.50 |
5 |
0.975 |
3.75 |
4.50 |
5.00 |
|
PT2 |
Volume-to-Capacity Ratio |
14 |
0 |
4.50 |
5 |
1.177 |
3.00 |
4.50 |
5.00 |
|
PT3 |
VKT/VMT |
13 |
1 |
4.00 |
5 |
0.927 |
4.00 |
4.00 |
5.00 |
|
PE1 |
Total energy consumption |
13 |
1 |
5.00 |
5 |
0.650 |
4.00 |
5.00 |
5.00 |
|
PE2 |
Energy consumption/capita |
12 |
2 |
4.50 |
4a |
0.522 |
4.00 |
4.50 |
5.00 |
|
PW1 |
Water consumption |
12 |
2 |
5.00 |
5 |
0.669 |
4.00 |
5.00 |
5.00 |
|
PW2 |
Water use rate |
12 |
2 |
5.00 |
5 |
0.905 |
4.00 |
5.00 |
5.00 |
|
PL1 |
Land use intensity |
11 |
3 |
4.00 |
4a |
0.905 |
4.00 |
4.00 |
5.00 |
|
PL2 |
Land cover area |
11 |
3 |
3.00 |
3a |
1.362 |
2.00 |
3.00 |
5.00 |
|
PF1 |
Forest cover |
12 |
2 |
4.00 |
4a |
1.115 |
3.00 |
4.00 |
5.00 |
|
PA1 |
Waste generated from household |
13 |
1 |
5.00 |
5 |
0.855 |
5.00 |
5.00 |
5.00 |
|
PA2 |
Waste generated from industry |
13 |
1 |
5.00 |
5 |
0.376 |
5.00 |
5.00 |
5.00 |
|
PA3 |
Waste accumulated |
11 |
3 |
5.00 |
5 |
0.924 |
5.00 |
5.00 |
5.00 |
|
PA4 |
Communities complaints |
13 |
1 |
5.00 |
5 |
1.115 |
3.00 |
5.00 |
5.00 |
|
PG1 |
Carbon emission |
13 |
1 |
5.00 |
5 |
0.776 |
4.00 |
5.00 |
5.00 |
|
PG2 |
AADT |
14 |
0 |
4.50 |
5 |
1.167 |
3.75 |
4.50 |
5.00 |
|
PC1 |
Days of extreme rainfall |
14 |
0 |
4.50 |
5 |
1.359 |
3.50 |
4.50 |
5.00 |
|
PC2 |
Maximum precipitation |
14 |
0 |
4.50 |
5 |
1.122 |
4.00 |
4.50 |
5.00 |
|
PC3 |
Total precipitation in rainy season |
14 |
0 |
4.50 |
5 |
1.122 |
4.00 |
4.50 |
5.00 |
|
PC4 |
Max. value of daily max. temp. |
14 |
0 |
4.00 |
4 |
1.267 |
3.75 |
4.00 |
4.25 |
|
SD1 |
Total population |
11 |
3 |
5.00 |
5 |
0.688 |
4.00 |
5.00 |
5.00 |
|
SD2 |
Urban population |
11 |
3 |
5.00 |
5 |
0.505 |
4.00 |
5.00 |
5.00 |
|
SD3 |
Household size |
11 |
3 |
4.00 |
4a |
1.136 |
3.00 |
4.00 |
5.00 |
|
SD4 |
Household number |
11 |
3 |
4.00 |
5 |
0.982 |
4.00 |
4.00 |
5.00 |
|
SB1 |
Water budget |
11 |
3 |
5.00 |
5 |
0.688 |
4.00 |
5.00 |
5.00 |
|
SW1 |
WQI |
13 |
1 |
5.00 |
5 |
0.439 |
4.50 |
5.00 |
5.00 |
|
SW2 |
Wastewater discharged |
12 |
2 |
4.50 |
5 |
1.206 |
3.00 |
4.50 |
5.00 |
|
SW3 |
Complaints of wastewater |
13 |
1 |
5.00 |
5 |
1.068 |
3.00 |
5.00 |
5.00 |
|
SA1 |
AQI |
11 |
3 |
5.00 |
5 |
1.206 |
4.00 |
5.00 |
5.00 |
|
SA2 |
PM2.5 & PM10 |
13 |
1 |
5.00 |
5 |
0.877 |
4.00 |
5.00 |
5.00 |
|
SA3 |
Days with air quality exceed std. |
13 |
1 |
5.00 |
5 |
1.013 |
3.50 |
5.00 |
5.00 |
|
SA4 |
Complaints about air pollution |
13 |
1 |
4.00 |
5 |
1.080 |
3.00 |
4.00 |
5.00 |
|
SP1 |
Rainfall |
14 |
0 |
4.50 |
5 |
1.167 |
3.75 |
4.50 |
5.00 |
|
SO1 |
Flood |
14 |
0 |
4.50 |
5 |
0.825 |
3.75 |
4.50 |
5.00 |
|
SO2 |
Drought |
14 |
0 |
4.00 |
3a |
0.877 |
3.00 |
4.00 |
5.00 |
|
IF1 |
People affected by flood |
12 |
2 |
4.00 |
4 |
0.793 |
3.25 |
4.00 |
5.00 |
|
IF2 |
Household affected by flood |
11 |
3 |
5.00 |
5 |
0.905 |
3.00 |
5.00 |
5.00 |
|
IF3 |
Economic loss |
11 |
3 |
5.00 |
5 |
1.009 |
4.00 |
5.00 |
5.00 |
|
IF4 |
Water-borne diseases |
12 |
2 |
4.00 |
5 |
0.996 |
3.25 |
4.00 |
5.00 |
|
IF5 |
Vulnerability Index |
14 |
0 |
5.00 |
5 |
0.756 |
4.00 |
5.00 |
5.00 |
|
IW1 |
Freshwater shortage |
11 |
3 |
5.00 |
5 |
1.206 |
4.00 |
5.00 |
5.00 |
|
IW2 |
Water stress |
11 |
3 |
5.00 |
5 |
0.688 |
4.00 |
5.00 |
5.00 |
|
IW3 |
Groundwater level |
11 |
3 |
4.00 |
5 |
0.982 |
4.00 |
4.00 |
5.00 |
|
IG1 |
Total GHG emissions |
13 |
1 |
5.00 |
5 |
0.439 |
4.50 |
5.00 |
5.00 |
|
IG2 |
People exposed by pollutants |
12 |
2 |
4.00 |
5 |
1.044 |
3.00 |
4.00 |
5.00 |
|
RE1 |
Energy efficiency |
14 |
0 |
4.50 |
4a |
0.519 |
4.00 |
4.50 |
5.00 |
|
RE2 |
Clean production process |
14 |
0 |
4.50 |
5 |
0.646 |
4.00 |
4.50 |
5.00 |
|
RW1 |
Agricultural water use efficiency |
11 |
3 |
5.00 |
5 |
0.688 |
4.00 |
5.00 |
5.00 |
|
RW2 |
Reuse wastewater |
11 |
3 |
5.00 |
5 |
0.467 |
4.00 |
5.00 |
5.00 |
|
RW3 |
Safely treated wastewater |
11 |
3 |
5.00 |
5 |
0.522 |
4.00 |
5.00 |
5.00 |
|
RS1 |
Envi. protection investment |
14 |
0 |
5.00 |
5 |
0.514 |
4.00 |
5.00 |
5.00 |
|
RS2 |
Water infrastructure investment |
14 |
0 |
4.50 |
5 |
0.745 |
4.00 |
4.50 |
5.00 |
|
RM1 |
Proper disposal |
11 |
3 |
5.00 |
5 |
0.505 |
4.00 |
5.00 |
5.00 |
|
RM2 |
Recycling rate |
12 |
2 |
5.00 |
5 |
0.651 |
4.25 |
5.00 |
5.00 |
|
RA1 |
Growth rate of forest cover rate |
11 |
3 |
5.00 |
5 |
1.168 |
4.00 |
5.00 |
5.00 |
|
RA2 |
Afforest in built-up area |
11 |
3 |
4.00 |
5 |
1.433 |
2.00 |
4.00 |
5.00 |
|
RL1 |
Green space |
11 |
3 |
4.00 |
4a |
0.905 |
4.00 |
4.00 |
5.00 |
|
RL2 |
Ecological protection |
11 |
3 |
5.00 |
5 |
1.168 |
4.00 |
5.00 |
5.00 |
|
RL3 |
Urban envi. infra. investment |
11 |
3 |
4.00 |
4 |
0.944 |
4.00 |
4.00 |
5.00 |
Note: a. Multiple modes exist. The smallest value is shown.
Source: Expert judgment, statistical analysis, using SPSS® Statistics 26.0.
[1] Farole, T. (2011). Special economic zones: What have we learned? World Bank, Poverty Reduction and Economic Management Network.
[2] Financial & Insurance Advisor Services (FIAS). (2008). Special Economic Zones: Performance, Lessons learned, and Implications for Zone Development. World Bank, Washington, D.C.
[3] United Nations Conference on Trade and Development (UNCTAD). (2019). World Investment Report 2019: Special Economic Zones. United Nations Publications, New York.
[4] Zeng, D.Z. (2010). Building Engines for Growth and Competitiveness in China: Experiences with Special Economic Zones and Industrial Clusters. World Bank, Washington, D.C.
[5] Bank of Thailand (BOT). (2012). Thailand Floods 2011: Impact and Recovery from Business Survey. Bangkok. https://www.bot.or.th/English/MonetaryPolicy/EconomicConditions/BLP/ThaiFloodSurvey2011_Eng.pdf.
[6] Singh, R.K., Murty, H.R., Gupta, S.K., Dikshit, A.K. (2012). An overview of sustainability assessment methodologies. Ecological Indicators, 15(1): 281-299. http://dx.doi.org/10.1016/j.ecolind.2011.01.007
[7] Martire, S., Tuomasjukka, D., Lindner, M., Fitzgerald, J., Castellani, V. (2015). Sustainability impact assessment for local energy supplies’ development - The case of the alpine area of Lake Como, Italy. Biomass and Bioenergy, 83: 60-76. http://dx.doi.org/10.1016/j.biombioe.2015.08.020
[8] Hazarika, N., Nitivattananon, V. (2016). Strategic assessment of groundwater resource exploitation using DPSIR framework in Guwahati city, India. Habitat International, 51: 79-89. http://dx.doi.org/10.1016/j.habitatint.2015.10.003
[9] Liu, Y., Wang, S., Qiao, Z., Wang, Y., Ding, Y., Miao, C. (2019). Estimating the dynamic effects of socioeconomic development on industrial SO2 emissions in Chinese cities using a DPSIR causal framework. Resources, Conservation & Recycling, 150: 104450. https://doi.org/10.1016/j.resconrec.2019.104450
[10] Wei, Y., Zhu, X., Li, Y., Yao, T., Tao, Y. (2019). Influential factors of national and regional CO2 emission in China based on combined model of DPSIR and PLS-SEM. Journal of Cleaner Production, 212: 698-712. https://doi.org/10.1016/j.jclepro.2018.11.155
[11] Song, J.K. (2012). Factor decomposition of carbon emissions from energy consumption of Shandong Province based on LMDI. Resource Science, 34(1): 35-41. http://dx.doi.org/10.2991/iceemt-16.2016.71
[12] Tan, Z., Li, L., Wang, J. (2011). Examining the driving forces for improving China’s CO2 emission intensity using the decomposing method. Applied Energy, 88(12): 4496-4504. http://dx.doi.org/10.1016/j.apenergy.2011.05.042
[13] Zhao, X., Long, R.Y. (2010). The status and decomposition model of carbon emissions for Jiangsu province. Chinese Journal of Population, Resource and Environment, 20(7): 25-30.
[14] Lee, H.C. (2013). DPSIR and disaster risk analysis. Disaster Advances, 6(1): 48-53.
[15] Khajuria, A., Ravindranath, N.H. (2012). Climate change vulnerability assessment: Approaches DPSIR framework and vulnerability index. Journal of Earth Science & Climate Chang, 3(1): 109. http://dx.doi.org/10.4172/2157-7617.1000109
[16] Hacking, T., Guthrie, P. (2008). A framework for clarifying the meaning of triple bottom-line, integrated, and sustainability assessment. Environmental Impact Assessment Review, 28(2-3): 73-89. https://doi.org/10.1016/j.eiar.2007.03.002
[17] Sala, S., Ciuffo, B., Nijkamp, P. (2015). A systematic framework for sustainability assessment. Ecological Economics, 119: 314-325. http://dx.doi.org/10.1016/j.ecolecon.2015.09.015
[18] Kristensen, P. (2004). The DPSIR framework. Paper presented at the 27-29 September 2004 workshop on a comprehensive / detailed assessment of the vulnerability of water resources to environmental change in Africa using river basin approach. UNEP Headquarters, Nairobi, Kenya.
[19] Ministry of Environmental Protection of China and Netherlands Commission for Environmental Assessment (MEPCNCEA). (2014). Strategic Environmental Assessment Effectiveness: Learning from Experience in China and the Netherlands. Appraisal Center for Environment and Engineering.
[20] Ness, B., Urbel-Piirsalu, E., Anderberg, S., Olsson, L. (2007). Categorising tools for sustainability assessment. Ecological Economics, 60(3): 498-508. http://dx.doi.org/10.1016/j.ecolecon.2006.07.023
[21] Asian Development Bank (ADB). (2010). Strategy and Action Plan for the Greater Mekong Sub-region East-West Economic Corridor. Mandaluyong City, Philippines.
[22] National Economic and Social Development Board (NESDB). (2016). Thailand’s Special Economic Zones. Spatial Development Planning and Strategy Office, Office of the National Economic and Social Development Board, Bangkok.
[23] Office of Natural Resources and Environmental Policies and Planning (ONEP). (2015). Guideline for Vulnerability Assessment of Communities, Project on Strengthening Regional Cooperation in Planning for Climate Change Adaptation, Ministry of Natural Resources and Environment, Bangkok.
[24] Geo-Informatics and Space Technology Development Agency (GISTDA). (2019). Coordinates of sub-districts, districts, provinces of the country, Department of Provincial Administration (DPA). https://gistdaportal.gistda.or.th/portal/home/item.html?id=a9e042bb191a43a9994e469ada3fa66e.
[25] Hou, Y., Zhou, S., Burkharda, B., Müller, F. (2014). Socioeconomic influences on biodiversity, ecosystem services and human well-being: A quantitative application of the DPSIR model in Jiangsu, China. Science of the Total Environment, 490: 1012-1028. http://dx.doi.org/10.1016/j.scitotenv.2014.05.071
[26] Liu, X., Liu, H., Chen, J., Liu, T., Deng, Z. (2018). Evaluating the sustainability of marine industrial parks based on the DPSIR framework. Journal of Cleaner Production, 188: 158-170. https://doi.org/10.1016/j.jclepro.2018.03.271
[27] Pandey, V.P., Shrestha, S. (2016). DPSIR framework for evaluating groundwater environment. Groundwater Environment in Asian Cities: Concepts, Methods, and Case Studies, 17-37. http://dx.doi.org/10.1016/B978-0-12-803166-7.00002-7
[28] Pilouk, S., Koottatep, T. (2017). Environmental performance indicators as the key for eco-industrial parks in Thailand. Journal of Cleaner Production, 156: 614-623. http://dx.doi.org/10.1016/j.jclepro.2017.04.076
[29] Shuai, C., Chen X., Wu, Y., Yongtao, T., Zhang, Y., Shen, L. (2018). Identifying the key impact factors of carbon emission in China: Results from a largely expanded pool of potential impact factors. Journal of Cleaner Production, 175: 612-623. https://dx.doi.org/10.1016/j.jclepro.2017.12.097
[30] Bujang, M.A., Baharum, N. (2016). Sample size guideline for correlation analysis. World Journal of Social Science Research, 3(1): 37-46. http://dx.doi.org/10.22158/wjssr.v3n1p37
[31] Piriyakul, M. (2021). Mediation model and Moderation model analysis. Ramkhamhaeng University, Bangkok. http://www.research.ru.ac.th/.
[32] Ringle, C.M., Sarstedt, M., Straub, D.W. (2012). Editor’s comments: A critical look at the use of PLS-SEM. MIS Quarterly, 36(1): 3-14. http://dx.doi.org/10.2307/41410402
[33] Rehman, J., Sohaib, O., Asif, M., Pradhan, B. (2019). Applying systems thinking to flood disaster management for a sustainable development. International Journal of Disaster Risk Reduction, 36: 101101. https://doi.org/10.1016/j.ijdrr.2019.101101
[34] Sun, S., Wang, Y., Liu, J., Cai, H., Wu, P., Geng, Q., Xu, L. (2016). Sustainability assessment of regional water resources under the DPSIR framework. Journal of Hydrology, 532: 140-148. https://doi.org/10.1016/j.jhydrol.2015.11.028
[35] Farole, T., Akinci, G. (2011). Special Economic Zones: Progress, Emerging Challenges, and Future Directions, Washington, D.C. https://doi.org/10.1596/978-0-8213-8763-4
[36] Dilly, O., Hüttl, R.F. (2009). Top-down and Europe-wide versus bottom-up and intra-regional identification of key issues for sustainability impact assessment. Environmental Science & Policy, 12(8): 1168-1176. https://doi.org/10.1016/j.envsci.2009.09.002
[37] United Nations Conference on Trade and Development (UNCTAD). (2015). Enhancing the Contribution of Export Processing Zones (EPZs) to the Sustainable Development Goals: An analysis of 100 EPZs and a Framework for Sustainable Economic Zones. New York and Geneva. https://unctad.org/en/PublicationsLibrary/webdiaepcb2015d5en.pdf.
[38] Li, W., Liu, Y.J., Yang, Z. (2012). Preliminary strategic environmental assessment of the great western development strategy: Safeguarding ecological security for a new western China. Environmental Management. 49(2): 483-501. https://doi.org/10.1007/s00267-011-9794-1
[39] Wood, R., Garnett, S. (2010). Regional sustainability in Northern Australia -A quantitative assessment of social, economic and environmental impacts. Ecological Economics, 69(9): 1877-1882. https://doi.org/10.1016/j.ecolecon.2010.05.006
[40] Zambia-China Economic and Trade Cooperation Zone Development Company Limited (ZCCZ). (2014). Strategic Environmental and Social Assessment of the Lusaka East Multi-Facility Economic Zone, Lusaka.
[41] Zeng, D.Z. (2015). Global Experiences with Special Economic Zones: Focus on China and Africa, Washington, D.C. https://openknowledge.worldbank.org/handle/10986/21854.
[42] Chiang, Y.C. (2018). Exploring community risk perceptions of climate change - A case study of a flood-prone urban area of Taiwan. Cities, 74: 42-51. https://doi.org/10.1016/j.cities.2017.11.001
[43] Zare, F., Elsawah, S., Bagheri, A., Nabavi, E., Jakeman, A.J. (2019). Improved integrated water resource modelling by combining DPSIR and system dynamics conceptual modelling techniques. Journal of Environmental Management, 246: 27-41. https://doi.org/10.1016/j.jenvman.2019.05.033
[44] Shrestha, S., Babel, M.S., Pandey, V.P. (2014). Climate Change and Water Resources, 1st ed. Boca Raton: CRC Press.
[45] Helbron, H., Schmidt, M., Glasson, J., Downes, N. (2011). Indicators for strategic environmental assessment in regional land use planning to assess conflicts with adaptation to global climate change. Ecological Indicators, 11(1): 90-95. https://doi.org/10.1016/j.ecolind.2009.06.016
[46] Brown, A., Matlock, M.D. (2011). A Review of Water Scarcity Indices and Methodologies, White Paper #106, April 2011. https://sustainabilityconsortium.org/download/a-review-of-water-scarcity-indices-and-methodologies/.
[47] Verma, A., Rahul, T.M., Dixit, M. (2015). Sustainability impact assessment of transportation policies - A case study for Bangalore city. Case Studies on Transport Policy. 3(3): 321-330. https://doi.org/10.1016/j.cstp.2014.06.001
[48] Henseler, J. Chin, W.W. (2010). A comparison of approaches for the analysis of interaction effects between latent variables using partial least squares path modeling. Structural Equation Model: A Multidisciplinary Journal, 17(1): 82-109. http://dx.doi.org/10.1080/10705510903439003
[49] Davison, A.C., Hinkley, D.V. (1997). Bootstrap Methods and Their Application. Cambridge Series in Statistical and Probabilistic Mathematics. Cambridge University Press, UK.
[50] Latan, H., Ramli, N.A. (2013). The results of partial least squares-structural equation modelling analyses (PLS-SEM). SSRN Electronic Journal. http://dx.doi.org/10.2139/ssrn.2364191
[51] Chin, W.W. (1998). The partial least squares approach to structural equation modeling. Modern Methods for Business Research, 295(2): 295-336.
[52] Yim, M.S. (2019). A study on factor analytical methods and procedures for PLS-SEM. International Journal of Industrial Distribution & Business, 10(5): 7-20. http://dx.doi.org/10.13106/ijidb.2019.vol10.no5.7