Devianti | Fachruddin* | Eva Purwati | Dewi Sartika Thamren | Agustami Sitorus
© 2021 IIETA. This article is published by IIETA and is licensed under the CC BY 4.0 license (http://creativecommons.org/licenses/by/4.0/).
OPEN ACCESS
Land management in the Krueng Jreu sub-watershed (Aceh Province, Indonesia) that did not follow soil and water conservation methods encouraged erosion. This can lead to silting of rivers or irrigation canals due to sediment deposition. Limited tools were the main reason for the infrequent measurement and mapping of these sediments in watersheds. Therefore, this study aims to conduct sedimentary mapping using GIS techniques combined with the sediment routing method to successfully produce a map of sediment assessment criteria for the Krueng Jreu sub-watershed area from 2010 to 2019. Rainfall and spatial data from the Krueng Jreu sub-watershed were analyzed to obtain several parameters of surface runoff, peak discharge, erodibility, slope, the value of ground cover, and land management. The results show that the Krueng Jreu sub-watershed was included in the wet climate type. The type of land use classification of savanna accounted for the most significant runoff, and land use type of open soil gave the smallest runoff. The maximum erosion found in the secondary dryland forest type land classification. It was known that the type of secondary dryland forest land use was the most significant contributor to sediment occurrence in the Krueng Jreu sub-watershed area.
aceh, agricultural information system, appropriate technology, erosion, soil and water engineering
A watershed is an ecosystem area limited by topography, which functions as a place for water catchment, water reserves, and water distribution. Naturally, watersheds have strategic functions in the hydrological system and cycle, especially the upstream watersheds [1-3]. This is mainly related to land use management as a sub-system that affects water and sediment dynamics [4].
Watershed management was an activity carried out by the community (both farmers and the government) and helps improve land conditions and integrated water supply in watersheds. However, some watershed management activities that do not follow soil and water conservation principles will encourage erosion [5-7]. Sediment due to erosion will have an impact on the silting of irrigation canals and rivers.
If watershed management was carried out optimally, it could benefit farming communities, especially in fulfilling water resources for agriculture [8]. On the other hand, activities that occur in watersheds can lead to changes in the watershed ecosystem. For example, changes in land use in the upstream area can impact the downstream area in the form of water fluctuations and the content of sediment and other dissolved substances. A real example was the change in land use of tropical forests in the upstream side of the river to become an agricultural area, causing changes in the amount of water that can be infiltrated into the soil. The surface run-off will occur by bringing soil particles downstream of the river. If allowed to drag on, this will cause sedimentation, which causes silting of the river on the downstream side of the river flow.
Land use management consists of biological elements in vegetation and physical factors such as topography and soil types. Changes in land use are caused by an increase in population, climate, agricultural cultivation, and local government policies that impact land mismatches, causing degradation of watersheds [9-11]. Ideally, the percentage of land use management is 30% protected friends and 70% cultivated area. Unbalanced land use management causes high erosion, and there will be a high increase in sediment.
The Krueng Aceh watershed was the main source of water needs for some communities. The Krueng Aceh watershed has seven sub-watersheds, namely the Krueng Seulimum, Krueng Inong, Krueng Khea, Krueng Keumireu, Krueng Jreu, Krueng Aneuk, and Krueng Aceh Hilir watersheds. According to Zhao et al. [12], forest damage in upstream areas can cause the water discharge to fluctuate around 95% of the standard limit. In addition, the conversion of forest functions that occurs causes land degradation so that the quality of the soil decreases, which can cause erosion.
Sediment measurement can be done directly by measuring soil sediment in the river. However, direct measurement was sometimes difficult because various things, such as limited tools, were constrained. Nonetheless, it is important to monitor an agricultural system to make the right decisions [13, 14]. Therefore, sediment routing was one way to view sediment by describing the overall biophysics of the watershed in the form of soil type, land use, and topography [15-17]. Each of these biophysics will affect rather than erosion. For example, increased erosion will cause an increase in sediment.
Estimated sediment routing requires land use maps, topographic maps, irrigation network maps, and soil type maps, where the maps are processed using a geographic information system (GIS). A geographic information system was a tool that can help process data, analyze data, and display information. For example, GIS can create a map of sediment distribution in the watershed and can then be managed according to its function in the long term. Therefore, this study aims to conduct sedimentary mapping using GIS techniques combined with the sediment routing method to successfully produce a map of sediment assessment criteria for the Krueng Jreu sub-watershed area from 2010 to 2019.
This study uses daily rainfall data for the last ten years (2010-2019). The rainfall data was used to calculate surface runoff and peak discharge required as one of the parameters in calculating erosion using modified universal soil loss equation (MUSLE) method. This method was first introduced by Williams [18], who developed the following revised form of the universal soil loss equation (USLE) [19].
2.1 Surface runoff analysis
Surface runoff is calculated using Eq. (1). The retention value was calculated using Eq. (2). The curve number (CN) value was obtained by overlaying land cover maps, soil texture, and slope so that the land use unit is obtained from the Krueng Jreu sub-watershed area. CN was a coefficient that reflects runoff during a given rainfall period. CN coefficients were generally grouped based on the hydrological properties of the soil. CN coefficient can be found in research reports [20-22]. After that, the land-use units were grouped based on the Hydrologic Soil Group (HSG) (values A, B, C, and D) [23].
$Q=\frac{(R-0.2 S)^{2}}{R+0.8 S}$ (1)
$S=254\left(\frac{100}{C N}-1\right)$ (2)
where, Q-surface runoff (mm), R-daily rainfall, S-retention, CN-curve number.
2.2 Peak discharge analysis
One method to determine peak discharge was to use the rational method [24-26]. Determining the peak discharge value with this method (Eq. (3)) was influenced by several parameters such as concentration-time (Eq. (5)), rainfall intensity (Eq. (4)), and runoff coefficient.
$Q_{p}=0.278 \times C \times I \times A$ (3)
$I=\left(\frac{R_{T r}}{24}\right)\left(\frac{24}{t_{c}}\right)^{2 / 3}$ (4)
$t_{c}=\left(\frac{0.87 \times L^{2}}{1000 \times S}\right)^{0.385}$ (5)
where, C-coefficient of runoff, I-maximum rain intensity (mm/hr), A-area of river basin (km2), RTr-amount of planned rainfall for the return period T-year, tc-time of rain concentration (hr), L-river length (km), S-river slope (%).
Concentration time was needed to determine the length of rainwater flowing from the upstream to the watershed outlet. To determine the value of the concentration-time is strongly influenced by several parameters such as the value of the river's length and the slope of the river. The length of the river in the Krueng Jreu sub-watershed is 46.20 km. The river slope (15.5%) was obtained from the difference between the highest upstream elevation of the watershed (749 m) and the lowest downstream elevation of the watershed (32 m) in a ratio of the length of the river. Determining the value of rain intensity can be done using the formula from Mononobe based on the daily rainfall data (mm) contained in Eq. (4). Rain intensity can be interpreted as heavy rain per unit time. Analysis of rainfall intensity using the Mononobe method uses time variables of concentration and maximum monthly rainfall.
2.3 Erosion analysis
Analysis of the amount of erosion in the Krueng Jreu sub-watershed using Eq. (6) [27]. The coefficient values of soil erodibility factor (K), cover crops factor (C), soil management factor (P) for this equation can be obtained from the results of previous studies [4, 28, 29]. The soil erodibility parameter was the level of sensitivity of a soil type to erosion. This parameter was obtained from the soil type map. The erodibility value was highly dependent on soil characteristics, such as soil texture, stability of soil aggregates, permeability, organic matter content. The ground cover factor is the plant cover factor. Soil management factors are land management factors obtained from land-use maps. The slope value is a factor obtained from the topographic map. Slope grade values are presented in Table 1.
$Y=11.8 \times\left(Q \times Q_{p}\right)^{0.56} \times(K \times C \times P \times L S)$ (6)
where, Y-total erosion, Qp-peak runoff, K-soil erodibility factor, C-cover crops factor, P-soil management factor, LS-slope factor.
Table 1. Slope grade values
|
Grading |
Slope grading |
Description |
|
I |
0-8 % |
Flating land |
|
II |
8-15 % |
Sloping land |
|
III |
15-25 % |
Slightly steep land |
|
IV |
25- 40 % |
Steep land |
|
V |
>40 % |
Very steep land |
Table 2. Soil erosion hazard classification
|
Grade |
Soil losing (tons×ha-1×year-1) |
Description |
|
I |
<15 |
Very light |
|
II |
16-60 |
Light |
|
III |
60-180 |
Medium |
|
IV |
180-480 |
Heavy |
|
V |
>480 |
Very heavy |
The calculation of the erosion value using the MUSLE formula was then classified into five classes, namely very light, light, medium, heavy, and very heavy [30]. Table 2 shows the classification of erosion hazard levels.
2.4 Sediment routing method
Sediment is the result of the process of erosion. Soil that was continuously eroded will settle in one place. Sediment calculation requires erosion value, sediment routing coefficient value, concentration-time, and particle diameter [15-17]. Sediment routing was influenced by all watershed biophysics, namely land use, slope, soil type, surface runoff, and peak discharge which have various values. Thus, a weighted (composite) value is needed to unify the uniformity by adding the value obtained per unit of land use multiplied by the area and divided by the area of the sub-watershed. Because the values obtained are tremendous and too complicated to calculate manually, the sediment routing coefficient value was calculated using a solver in Microsoft Excel. Completely this method was developed by Williams [31] and has been used in several recent research results such as Brewer et al. [32], who applied his study in Spain and Greece, Kazezyılmaz-Alhan, et al. [25], who conducted his study in Poland with precise factor weight values for each type of land used to provide consistent sediment values.
The calculation of sediment values using sediment routing was then classified into five classes, namely very low, low, medium, high, and very high. The criteria for assessing sediment load can be seen in Table 3.
Table 3. Sediment assessment criteria
|
Soil losing (tons×ha-1×year-1) |
Score |
Recovery qualification |
|
MS ≤ 5 |
0.50 |
Very low |
|
5< MS ≤10 |
0.75 |
Low |
|
10 < MS ≤15 |
1.00 |
Medium |
|
15 < MS ≤20 |
1.25 |
High |
|
MS ≥ 20 |
1.50 |
Very high |
2.5 Map delineation
Delineation was the drawing of a temporary boundary line in an area on a map. Determine the Krueng Jreu Sub-watershed boundaries on administrative maps, land use maps, soil type maps, river network maps, and topographic maps using the QGIS application. Then, clip the river network map, topographic map, slope map, and land use map to leave the information on the Krueng Jreu sub-watershed.
2.6 Map overlays
An overlay is done to determine the land map unit consisting of K, LS, CP values. K, LS, CP values were obtained from land use maps, soil type maps, and topographic maps overlaid using the QGIS application.
3.1 Description of the Krueng Jreu sub-watershed area
(1) Geographical and administrative location
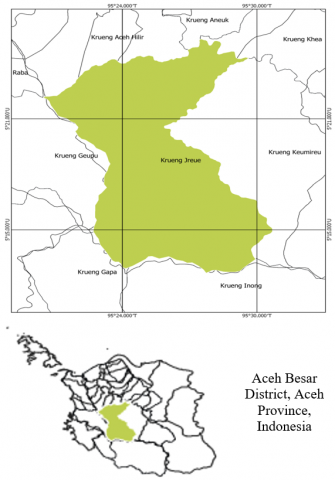
Geographically, Aceh Besar Regency was one of the regencies in Aceh Province, which is located between 5°2’– 5°8’ North Latitude and 95°80’-95°88’ East Longitude with an area of 2969 km2. Aceh Besar district consists of 23 sub-districts and 604 villages. To the north, Aceh Besar Regency was bordered by the Malacca strait and to the south by Aceh Jaya Regency. In the west, it was bordered by Pidie Regency and in the east by the Indian Ocean.
The Krueng Jreu sub-watershed was one of the sub-watersheds in the Krueng Aceh watershed, located in the Indrapuri sub-district, Aceh Besar district (Figure 1). The Krueng Jreu sub-watershed was located between 5°12’29.5” to 5°23’57.5” north latitude and 95°21’49” to 95°30’45.2” east longitude with an area of 23194.98 ha. The length of the main river is 46.20 km, with a slope of 15.5%.
Figure 1. Krueng Jreu Sub-watershed map
(2) Soil type Krueng Jreu sub-watershed
There were five soil types in the Krueng Jreu sub-watershed: alluvial, latosol, brown podzolic complex, podzol and lithosols, and red-yellow podzolic. The distribution of soil types in the Krueng Jreu watershed can be seen in Table 4. Each soil type has a different erodibility value, which shows the ability of the soil to resist erosion. The higher the erodibility value, the easier the soil is to erode. Based on the erodibility value, the types of easily eroded soil are latosols and brown podzolic complexes, and lithosols. The percentage of soil types that are easily eroded is 53.98%, while the types of soils that were not easily eroded are alluvial, red-yellow podzolic, and lithosols. The percentage of soil types not easily eroded was 46.02%. According to Jiang et al. [33], the Krueng Jreu sub-watershed generally has moderate to good ability to resist erosion based on the type of soil.
Table 4. Soil type area of Krueng Jreu sub-watershed
|
Soil type |
Erodibility |
Area (ha) |
Percentage (%) |
|
Alluvial |
0.19 |
1.26 |
0.01 |
|
Latosol |
0.31 |
26.25 |
0.11 |
|
Brown podzolic complexes, and lithosols |
0.27 |
12494.91 |
53.87 |
|
Lithosols |
0.16 |
9097.51 |
39.22 |
|
Red-yellow podzolic |
0.17 |
1575.05 |
6.79 |
(3) Land use Krueng Jreu sub-watershed
Table 5. Land use management classification Krueng Jreu sub-watershed
|
Land use management |
Cover crop value |
Area (ha) |
Percentage (%) |
|
Protected area |
|||
|
Primary dryland forest |
0.0005 |
1583.30 |
6.83 |
|
Secondary dryland forest |
0.1 |
10976.46 |
47.32 |
|
Water body |
0.001 |
40.64 |
0.18 |
|
Cultivation area |
|||
|
Residential areas |
0.2 |
30.77 |
0.13 |
|
Dryland farming |
0.02 |
605.41 |
2.61 |
|
Mixed dryland Farming |
0.02 |
462.71 |
1.99 |
|
savanna |
0.012 |
5193.56 |
22.39 |
|
Rice field |
0.005 |
381.83 |
1.65 |
|
Shrubs |
0.04 |
3900.21 |
16.81 |
|
Open land |
0.5 |
20.09 |
0.09 |
Land use in the Krueng Jreu sub-watershed was classified into two areas: protected areas and cultivated areas. Protected areas consist of land uses such as primary forest, secondary forest, and water bodies. The cultivation area consists of dryland agriculture, rice fields, shrubs, and open land. Comparison of the percentage of space for each land use (Table 5) describes land use management related to cover crops with different crop coefficients and soil management, affecting the amount of erosion and sedimentation. Protected areas have a percentage of 54.32% and cultivation areas of 45.68%. This shows that protected forest areas still dominate the land use in the Krueng Jreu sub-watershed area. The most significant percentage of land use in protected areas was secondary dryland forest of 47.32%, and the smallest was water bodies of 0.18%. Meanwhile, the most important cultivated area land use was savanna of 22.39%, and the smallest was open land of 0.09%.
(4) Sloping land in Krueng Jreu sub-watershed
The Krueng Jreu sub-watershed was divided into five categories of land slope classes ranging from flat to very steep, with the area and percentage of each class presented in Table 6. Flat slope types generally have a sloping surface relief with an area of 5519.55 ha (23.80%). This area was an area used as land for agricultural development and urban development. The type of sloping slope with an area of 8238.64 ha (35.52%) where the area with this condition was suitable as a location for plantation cultivation development. A slightly steep slope with an area of 745.81 ha (3.22%) was a primary dryland forest area. The steep slope of 2353.91 ha (10.15%) was a hilly area with primary dryland forest. Finally, the very steep area with an area of 6337.07 ha (27.32%) was a protected forest area.
Table 6. Slope area of the Krueng Jreu sub-watershed
|
Sloping land |
Slope factor |
Area (ha) |
Percentage (%) |
|
Flating land (0% - 8%) |
0.4 |
5519.55 |
23.80 |
|
Sloping land (8%-15%) |
1.4 |
8238.64 |
35.52 |
|
Slightly steep land (15% - 25%) |
3.1 |
745.81 |
3.22 |
|
Steep land (25% - 40%) |
6.8 |
2353.91 |
10.15 |
|
Very steep land (>40%) |
9.5 |
6337.07 |
27.32 |
(5) Rainfall in area Krueng Jreu sub-watershed
The rainfall data used in this analysis is monthly rainfall data for ten years from 2010-2019, which was obtained from the Meteorology, Climatology and Geophysics Agency (BMKG) Indrapuri Station in Banda Aceh (Table 7). According to BMKG (2011), the climate type in this area can be determined using the Schmidt-Ferguson classification. The average wet and dry months in this sub-watershed are 0.5 month and 9.4 month, respectively. Therefore, according to the Schmidt-Ferguson climate classification, the Krueng Jreu sub-watershed area belongs to the wet climate type.
Table 7. Monthly rainfall data
|
Year |
Jan |
Feb |
Mar |
Apr |
May |
Jun |
Jul |
Aug |
Sep |
Oct |
Nov |
Des |
|
2010 |
39.0 |
24.0 |
44.2 |
58.0 |
75.5 |
35.0 |
41.7 |
60.0 |
30.0 |
49.5 |
69.4 |
37.4 |
|
2011 |
87.2 |
40.8 |
54.5 |
47.6 |
13.7 |
9.4 |
45.7 |
15.8 |
44.0 |
60.9 |
77.2 |
79.5 |
|
2012 |
89.0 |
51.0 |
63.5 |
55.0 |
25.6 |
7.2 |
17.0 |
25.1 |
31.7 |
39.5 |
162.0 |
65.5 |
|
2013 |
63.0 |
35.5 |
66.2 |
57.0 |
60.7 |
33.0 |
23.0 |
11.2 |
77.3 |
27.2 |
50.0 |
78.0 |
|
2014 |
24.5 |
28.5 |
19.4 |
55.7 |
77.0 |
32.9 |
8.5 |
21.6 |
56.3 |
53.5 |
125.7 |
119.3 |
|
2015 |
89.0 |
5.9 |
27.6 |
57.9 |
60.4 |
5.4 |
21.8 |
7.8 |
30.5 |
38.2 |
63.4 |
113.0 |
|
2016 |
48.0 |
55.9 |
40.0 |
45.5 |
35.0 |
17.0 |
13.0 |
37.8 |
8.6 |
50.9 |
95.9 |
31.6 |
|
2017 |
84.0 |
25.0 |
64.5 |
62.0 |
40.8 |
23.8 |
10.7 |
16.0 |
55.0 |
57.3 |
96.3 |
91.4 |
|
2018 |
23.5 |
21.6 |
21.7 |
42.7 |
34.3 |
14.4 |
15.4 |
14.5 |
28.6 |
33.5 |
67.9 |
53.1 |
|
2019 |
33.8 |
27.0 |
21.1 |
103.4 |
41.0 |
34.5 |
60.5 |
24.0 |
21.5 |
74.2 |
73.4 |
35.0 |
(6) Surface runoff Krueng Jreu sub-watershed
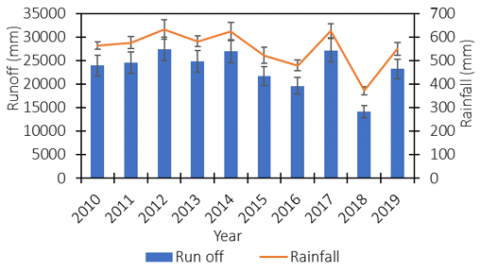
Runoff was a critical element in the water cycle and one of the causes of erosion. The amount of surface runoff in the Krueng Jreu sub-watershed in the last ten years is presented in Figure 2. The highest runoff occurred in 2012 at 27455.93 mm, and the lowest runoff occurred in 2018 at 14185.74 mm. In 2012 there was an increase in runoff in the Krueng Jreu sub-watershed by 17.49% from the average runoff from 2010 to 2019. However, there was a significant decrease in runoff in 2018 of 47.81% from the previous year's runoff. The increase and decrease in surface runoff for ten years are caused by high and low rainfall and land-use factors. Heavy rainfall will potentially increase the volume of water that will be present on the ground surface. Some that can enter the soil (infiltration) will become groundwater, and most of it will flow as surface run-off. Land use will act as a factor that can increase infiltration into the soil so that the surface runoff can be smaller.
Figure 2. Runoff in Krueng Jreu sub-watershed
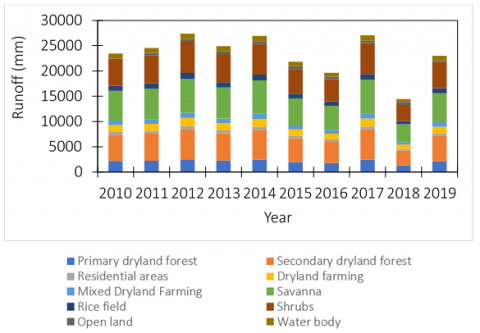
The amount of surface runoff in various land uses presented in Figure 3. Savanna land use contributes to the most significant increase in runoff of 6726 mm/year. In addition, bushland/shrub contributed about 6168 mm/year. The smallest runoff occurs on open land of 329 mm/year, followed by land use for settlement, which was 339 mm/year. The curve numbers rainfall and soil type conditions influenced the fluctuation in surface runoff in various land uses.
Figure 3. Surface runoff at various land uses in Krueng Jreu sub-watershed
3.2 Estimation of peak discharge by rational method
(1) Time of concentration
The results of the analysis that the concentration-time of this sub-watershed is 2.57 hr. This means that the time required for rainwater to flow from the furthest point (upstream) of the sub-watershed to the output of the sub-watershed (downstream) was 2.57 hr.
(2) Rainfall intensity
The results of the analysis of rain intensity can be seen in Figure 4. The highest rainfall intensity occurred in 2012, 1324.65 mm/hr, and the lowest rainfall intensity occurred in 2018, which was 228.61 mm/hr. The higher the maximum rainfall, the higher the intensity of the rain. The decrease and increase in rainfall intensity are influenced by the high or low maximum rain.
(3) Runoff coefficient of Krueng Jreu sub-watershed
Each land use in the Krueng Jreu sub-watershed has a different runoff coefficient (Table 8). For example, the largest runoff coefficient value was found in land use for settlements. The runoff coefficient on land use was 0.06. This means that 60% of the rainwater in the area will runoff, and only 40% will enter the ground. Due to various land use types in the Krueng Jreu sub-watershed area, a runoff coefficient of 5% was obtained, which means that 95% of the water will enter the soil when it rains.
Figure 4. Rainfall intensity in Krueng Jreu sub-watershed
Table 8. Krueng Jreu sub-watershed runoff coefficient
|
Land use management |
Runoff coefficient-(C) |
Area (ha)-(A) |
C*A |
|
Primary dryland forest |
0.02 |
1583.45 |
31.67 |
|
Secondary dryland forest |
0.03 |
10956.54 |
328.70 |
|
Residential areas |
0.60 |
30.77 |
18.46 |
|
Dryland farming |
0.10 |
605.40 |
60.54 |
|
Mixed Dryland Farming |
0.10 |
401.00 |
40.10 |
|
Savanna |
0.07 |
5192.93 |
363.51 |
|
Rice field |
0.15 |
385.83 |
57.87 |
|
Shrubs |
0.07 |
3978.27 |
278.48 |
|
Open land |
0.20 |
20.15 |
4.03 |
|
Water body |
0.05 |
40.64 |
2.03 |
(4) Peak discharge of the Krueng Jreu watershed
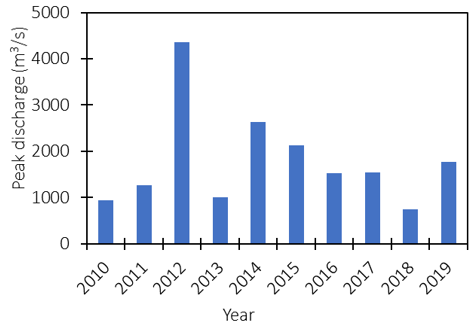
The results of the analysis of peak discharge using the rational method in the Krueng Jreu sub-watershed in the period of 10 years from 2010 to 2019 were presented in Figure 5. The highest peak discharge occurred in 2012, which was 4365.24 m3/s and the lowest peak discharge occurred in 2018, which was equal to 753.37 m3/s. It can be seen that there was a significant increase in peak discharge in 2012, which was 3.45 times greater than in the previous year. However, in 2013 there was a decrease in a peak discharge of 76.82% from the previous year. One of these peak discharge fluctuations was influenced by the intensity of the rain, which if the rainfall intensity were low, the peak discharge produced would be small (vice versa).
3.3 Krueng Jreu sub-watershed erosion
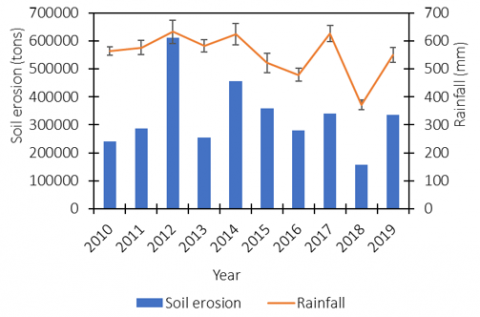
Erosion in the period 2010 to 2019 in the Krueng Jrue sub-watershed is presented in Figure 6. The largest erosion in the Krueng Jreu sub-watershed was 611044.72 tons which occurred in 2012. The smallest erosion in this sub-watershed occurred in 2018 of 157831.63 tons. The largest erosion in 2012 was known to be 1.84 times greater than the 10-year average. In addition, the smallest erosion in 2018 is known to be 47.52% less than the average erosion in the last ten years. Another phenomenon related to erosion in the Krueng Jreu sub-watershed was rainfall that was not significantly different (between 2012 and 2013) but provides a significant amount of erosion. This is due to the greater rainfall intensity in 2012, which resulted in a lot of loose soil being carried away by rainwater. In addition, according to several research results [34-36], erosion fluctuations were generally influenced by surface runoff, peak discharge, soil erodibility, sloping land, cover crops, and land management.
Figure 5. Peak discharge in Krueng Jreu sub-watershed
Figure 6. Total soil erosion Krueng Jreu sub-watershed
Figure 7. Erosion at various land uses in Krueng Jreu sub-watershed
The amount of erosion in various land uses in the Krueng Jreu sub-watershed was presented in Figure 7. In general, in the Krueng Jreu sub-watershed, there was an increase in erosion due to land use for other purposes, from 240563.28 tons in 2010 to 611044.72 tons in 2012. Erosion The highest occurred in the land classification of secondary dryland forest, followed by shrub and savanna land type classification. The lowest erosion occurred in the water body type land classification and land use for rice fields. Erosion fluctuations in various types of land use were not only caused by the use of the land itself. Still, they can also be caused by the different areas of each land type classification, factors of cover crops, type of tillage, sloping land, and type of soil.
3.4 Total sedimentation in Krueng Jreu sub-watershed
Based on the amount of erosion and river morphology, the sediment routing coefficient for the Krueng Jreu sub-watershed area from 2010 to 2019 was -0.25. Sediment erosion in the Krueng Jreu sub-watershed in the period 2010 to 2019 was presented in Figure 8. The highest sediment in the Krueng Jreu sub-watershed occurred in 2012 of 488757.02 tons, and the lowest sedimentation occurred in 2018 of 130014.46 tons. The analysis results show that almost the same rainfall in 2012 and 2017 resulted in significantly different sediment values. This may be due to one of the reasons for the different rainfall intensities that year. Rain intensity in 2012 was known at 1324.65 mm/hr, and in 2017 was known at 468.09 mm/hr. This difference in intensity resulted in different peak discharges resulting in other erosion in the two years.
Figure 8. Sedimentation in Krueng Jreu sub-watershed
The relationship between sediment and various land uses in the Krueng Jreu sub-watershed was presented in Figure 9. The highest sedimentation occurs in the land use classification of secondary dryland forest, followed by shrubs and savanna. The lowest sediment occurs in the land use classification for water bodies and then followed by land use for rice fields. It can be seen that there was an increase in sediment in the use of secondary dryland forest land in 2012 by 2.10 times greater than in the previous year. This sediment fluctuation was influenced by erosion factors that occur in the land-use area.
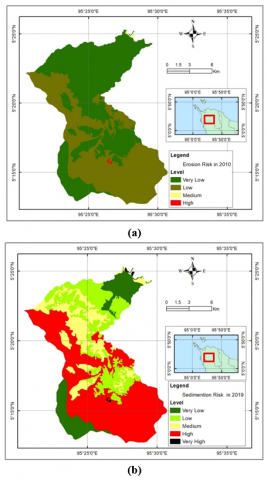
The assessment map of the sediment load criteria at the beginning and end of the study year was presented in Figure 10. The sediment criteria that occurred in the Krueng Jreu sub-watershed in 2010 can be classified into low, very low, very high, and high. Whereas in 2019, the sediment criteria changed to low, very low, and very high. The difference in sediment load criteria was due to differences in sediment produced in various land uses from 2010 to 2019.
Figure 9. Sedimen pada berbagai penggunaan lahan
Figure 10. Map of sediment assessment criteria for (a) 2010, and (b) 2019
Sedimentation mapping using GIS techniques combined with the sediment routing method has succeeded in producing a map of sediment assessment criteria for the Krueng Jreu sub-watershed area from 2010 to 2019. It can be seen that the Krueng Jreu sub-watershed was included in the wet climate type (Schmidt-Ferguson climate classification). The highest rainfall intensity was known to occur in 2012 (1324.65 mm/hr) and the lowest in 2018 (228.61 mm/hr). The maximum and minimum peak discharges in the Krueng Jreu sub-watershed area respectively occurred in 2012 (4365.24 m3/s), 2018 (753.37 m3/s). The maximum and minimum runoff in 2012-2019 occurred in 2012 (27455.93 mm), 2018 (14185.74 mm). The type of land use classification of savanna accounted for the most considerable runoff (6726 mm/year). The smallest runoff occurred in the use of open soil (329 mm/year). The maximum and minimum erosion in the Krueng Jreu sub-watershed is 611044.72 tons (2012), 157831.63 tons (2018). The highest erosion occurred in the land classification of secondary dryland forest, and the lowest erosion was found in the water body type land classification. The most increased sediment in the Krueng Jreu sub-watershed occurred in 2012 (488757.02 tons), and the lowest sedimentation occurred in 2018 (130014.46 tons). The type of land use of the secondary dryland forest was the most significant contributor to sediment occurrence in the Krueng Jreu sub-watershed area. Based on this research study, the authors suggest that secondary dryland forest land use should be reduced and prioritize land use for cultivation with plant species with deep roots and a wider canopy.
[1] Elmes, M.C., Price, J.S. (2019). Hydrologic function of a moderate-rich fen watershed in the Athabasca Oil Sands Region of the Western Boreal Plain, northern Alberta. Journal of Hydrology, 570: 692-704. https://doi.org/10.1016/j.jhydrol.2018.12.043
[2] Rahmati, O., Samadi, M., Shahabi, H., Azareh, A., Rafiei-Sardooi, E., Alilou, H., Shirzadi, A. (2019). SWPT: An automated GIS-based tool for prioritization of sub-watersheds based on morphometric and topo-hydrological factors. Geoscience Frontiers, 10(6): 2167-2175. https://doi.org/10.1016/j.gsf.2019.03.009
[3] Ahmed, R., Sajjad, H., Husain, I. (2018). Morphometric parameters-based prioritization of sub-watersheds using fuzzy analytical hierarchy process: A case study of lower Barpani Watershed, India. Natural Resources Research, 27(1): 67-75. https://doi.org/10.1007/s11053-017-9337-4
[4] Asdak, C. (2018). Hidrologi Dan Pengelolaan Daerah Aliran Sungai. Gadjah Mada University Press. http://repository.pelitabangsa.ac.id/xmlui/handle/123456789/863.
[5] Shi, Z.H., Ai, L., Fang, N.F., Zhu, H.D. (2012). Modeling the impacts of integrated small watershed management on soil erosion and sediment delivery: A case study in the Three Gorges Area, China. Journal of Hydrology, 438: 156-167. https://doi.org/10.1016/j.jhydrol.2012.03.016
[6] Surya, B., Syafri, S., Sahban, H., Sakti, H.H. (2020). Natural resource conservation based on community economic empowerment: Perspectives on watershed management and slum settlements in Makassar City, South Sulawesi, Indonesia. Land, 9(4): 104. https://doi.org/10.3390/land9040104
[7] Tsani, S., Koundouri, P., Akinsete, E. (2020). Resource management and sustainable development: A review of the European water policies in accordance with the United Nations’ Sustainable Development Goals. Environmental Science & Policy, 114: 570-579. https://doi.org/10.1016/j.envsci.2020.09.008
[8] Reddy, V.R., Saharawat, Y.S., George, B. (2017). Watershed management in South Asia: A synoptic review. Journal of Hydrology, 551: 4-13. https://doi.org/10.1016/j.jhydrol.2017.05.043
[9] Awasthi, K.D., Sitaula, B.K., Singh, B.R., Bajacharaya, R.M. (2002). Land-use change in two Nepalese watersheds: GIS and geomorphometric analysis. Land Degradation & Development, 13(6): 495-513. https://doi.org/10.1002/ldr.538
[10] Kusi, K.K., Khattabi, A., Mhammdi, N., Lahssini, S. (2020). Prospective evaluation of the impact of land use change on ecosystem services in the Ourika watershed, Morocco. Land Use Policy, 97: 104796. https://doi.org/10.1016/j.landusepol.2020.104796
[11] Lambin, E.F., Geist, H.J., Lepers, E. (2003). Dynamics of land-use and land-cover change in tropical regions. Annual review of Environment and Resources, 28(1): 205-241. https://doi.org/10.1146/annurev.energy.28.050302.105459
[12] Zhao, Y., Zou, X., Liu, Q., Yao, Y., Li, Y., Wu, X., Wang, T. (2017). Assessing natural and anthropogenic influences on water discharge and sediment load in the Yangtze River, China. Science of the Total Environment, 607: 920-932. https://doi.org/10.1016/j.scitotenv.2017.07.002
[13] Sartika, D.T., Sihotang, R., Muslih, M., Sitorus, A., Haris, O., Bulan, R. (2020). Development of irrigation tank monitoring system and its environment for the effectiveness of rice irrigation. Acta Universitatis Agriculturae et Silviculturae Mendelianae Brunensis, 68(5): 859-865. https://doi.org/10.11118/actaun202068050859
[14] Sitorus, A., Hasan, A.R., Karyadi, A., Yudinata. (2019). Simple performance test of an appropriate technology solar concentrator equipped with a monitoring system for remote areas. International Journal of Scientific and Technology Research, 8(11): 3744-3748.
[15] Caracciolo, L. (2020). Sediment generation and sediment routing systems from a quantitative provenance analysis perspective: Review, application and future development. Earth-Science Reviews, 209: 103226. https://doi.org/10.1016/j.earscirev.2020.103226
[16] Barham, M., Reynolds, S., Kirkland, C.L., O'Leary, M.J., Evans, N.J., Allen, H.J., McDonald, B.J. (2018). Sediment routing and basin evolution in Proterozoic to Mesozoic east Gondwana: A case study from southern Australia. Gondwana Research, 58: 122-140. https://doi.org/10.1016/j.gr.2018.03.006
[17] Ortiz, A., Guillocheau, F., Lasseur, E., Briais, J., Robin, C., Serrano, O., Fillon, C. (2020). Sediment routing system and sink preservation during the post-orogenic evolution of a retro-foreland basin: The case example of the North Pyrenean (Aquitaine, Bay of Biscay) Basins. Marine and Petroleum Geology, 112: 104085. https://doi.org/10.1016/j.marpetgeo.2019.104085
[18] Williams, J.R. (1975). Sediment-yield prediction with universal equation using runoff energy factor. Present and Prospective Technology for Predicting Sediment Yield and Sources, 40: 244-252.
[19] Sadeghi, S.H.R., Gholami, L., Khaledi Darvishan, A., Saeidi, P. (2014). A review of the application of the MUSLE model worldwide. Hydrological Sciences Journal, 59(2): 365-375. https://doi.org/10.1080/02626667.2013.866239
[20] Shaw, S.B., Walter, M.T. (2009). Improving runoff risk estimates: Formulating runoff as a bivariate process using the SCS curve number method. Water Resources Research, 45(3): 1-10. https://doi.org/10.1029/2008WR006900
[21] Slack, R.B., Welch, R. (1980). Soil conservation service runoff curve number estimates from landsat data 1. Jawra Journal of the American Water Resources Association, 16(5): 887-893. https://doi.org/10.1111/j.1752-1688.1980.tb02504.x
[22] Woodward, D.E., Hawkins, R.H., Jiang, R., Hjelmfelt, Jr, A.T., Van Mullem, J.A., Quan, Q.D. (2003). Runoff curve number method: Examination of the initial abstraction ratio. In World Water & Environmental Resources Congress, pp. 1-10. https://doi.org/10.1061/40685(2003)308
[23] Lohani, S., Baffaut, C., Thompson, A.L., Aryal, N., Bingner, R.L., Bjorneberg, D.L., Yasarer, L.M.W. (2020). Performance of the soil vulnerability index with respect to slope, digital elevation model resolution, and hydrologic soil group. Journal of Soil and Water Conservation, 75(1): 12-27. https://doi.org/10.2489/jswc.75.1.12
[24] Cheah, R., Billa, L., Chan, A., Teo, F.Y., Pradhan, B., Alamri, A.M. (2019). Geospatial modelling of watershed peak flood discharge in Selangor, Malaysia. Water, 11(12): 2490. https://doi.org/10.3390/w11122490
[25] Kazezyılmaz-Alhan, C.M., Yalçın, İ., Javanshour, K., Aytekin, M., Gülbaz, S. (2021). A hydrological model for Ayamama watershed in Istanbul, Turkey, using HEC-HMS. Water Practice and Technology, 16(1): 154-161. https://doi.org/10.2166/wpt.2020.108
[26] Carvalho, D.J., Costa, M.E.L., da Costa, J., Koide, S. (2018). Modelling runoff in watershed without Calibration using PCSWMM. In International Conference on Urban Drainage Modelling, 544-549. https://doi.org/10.1007/978-3-319-99867-1_94
[27] Kumar, T., Jhariya, D.C., Pandey, H.K. (2020). Comparative study of different models for soil erosion and sediment yield in Pairi watershed, Chhattisgarh, India. Geocarto International, 35(11): 1245-1266. https://doi.org/10.1080/10106049.2019.1576779
[28] Römkens, M.J.M., Young, R.A., Poesen, J.W.A., McCool, D.K., El-Swaify, S.A., Bradford, J.M. (1997). Soil erodibility factor (K). Compilers) In: Renard KG, Foster GR, Weesies GA, McCool DK, Yoder DC, editors. Predicting soil erosion by water: A guide to conservation planning with the Revised Universal Soil Loss Equation (RUSLE). Washington, DC, USA: Agric. HB, 703: 65-99.
[29] Gómez, J.A., Battany, M., Renschler, C.S., Fereres, E. (2003). Evaluating the impact of soil management on soil loss in olive orchards. Soil Use and Management, 19(2): 127-134. https://doi.org/10.1111/j.1475-2743.2003.tb00292.x
[30] Djoukbala, O., Hasbaia, M., Benselama, O., Mazour, M. (2019). Comparison of the erosion prediction models from USLE, MUSLE and RUSLE in a Mediterranean watershed, case of Wadi Gazouana (NW of Algeria). Modeling Earth Systems and Environment, 5(2): 725-743. https://doi.org/10.1007/s40808-018-0562-6
[31] Williams, J.R. (1975). Sediment routing for agricultural watersheds 1. JAWRA Journal of the American Water Resources Association, 11(5): 965-974. https://doi.org/10.1111/j.1752-1688.1975.tb01817.x
[32] Brewer, C.J., Hampson, G.J., Whittaker, A.C., Roberts, G.G., Watkins, S.E. (2020). Comparison of methods to estimate sediment flux in ancient sediment routing systems. Earth-Science Reviews, 207: 103217. https://doi.org/10.1016/j.earscirev.2020.103217
[33] Jiang, F., He, K., Lin, J., Li, H., Zhan, Z., Lin, J., Huang, Y. (2020). A comparison of the effectiveness of the roots of two grass species in reducing soil erosion on alluvial fans in south-east China. Hydrological Processes, 34(1): 96-110. https://doi.org/10.1002/hyp.13575
[34] Chen, H., Zhang, X., Abla, M., Lü, D., Yan, R., Ren, Q., Yang, X. (2018). Effects of vegetation and rainfall types on surface runoff and soil erosion on steep slopes on the Loess Plateau, China. Catena, 170: 141-149. https://doi.org/10.1016/j.catena.2018.06.006
[35] Zhang, B.J., Zhang, G.H., Yang, H.Y., Wang, H. (2019). Soil resistance to flowing water erosion of seven typical plant communities on steep gully slopes on the Loess Plateau of China. Catena, 173: 375-383. https://doi.org/10.1016/j.catena.2018.10.036
[36] Yu, Y., Wei, W., Chen, L., Feng, T., Daryanto, S. (2019). Quantifying the effects of precipitation, vegetation, and land preparation techniques on runoff and soil erosion in a Loess watershed of China. Science of the Total Environment, 652: 755-764. https://doi.org/10.1016/j.scitotenv.2018.10.255