Dilaj Maduranga* | Mahesh Edirisinghe
© 2021 IIETA. This article is published by IIETA and is licensed under the CC BY 4.0 license (http://creativecommons.org/licenses/by/4.0/).
OPEN ACCESS
This study reveals the spatiotemporal distribution of lightning activities over Bandaranaike International Airport, the main international airport of Sri Lanka. Lightning flash data was acquired from the Lightning Imaging Sensor (LIS) on Tropical Rainfall Measuring Mission (TRMM) of NASA to investigate lightning activities from 1998 to 2014 covering an area of 30 km×30 km over the airport. Overhead annual flash density was 8.19 flashes km-2 year-1. The maximum lightning activities (57%) with an overhead flash density of 28.83 flashes km-2 year-1 was recorded in the first inter-monsoon season. The overhead flash density of 5.28 flashes km-2 year-1, 16.36 flashes km-2 year-1 and 7.46 flashes km-2 year-1 were recorded in the southwest monsoon season, second inter-monsoon season, and northeast monsoon season respectively. The month of April accounts for the highest number of lightning activities while maximum lightning flashes (22%) had occurred during 19.00-20.00 Local Time. According to the international climate season, maximum lightning activities over the study area have been recorded from March to May and during this seasonal period, the northern hemisphere is in spring and the southern hemisphere is in autumn. Safety guidelines are proposed to minimize lightning accidents in the airport. It is important to concern the regions with high lightning activity and vulnerable time periods to mitigate lightning accidents and to take adequate safety precautions to ensure the safety of passengers and the working crew to achieve environmental goals of sustainable development in the aviation industry.
Bandaranaike international airport, lightning climatology, lightning flash density, lightning hazards, lightning protection, lightning safety
Generally, lightning is a serious threat to the safety of the working crew at the airport, those include baggage handlers, airplane fuel suppliers, food suppliers, etc. Most of them are working outside of the well protected buildings in the airport and should continue their service under any climate situation. Otherwise, possible lightning accidents happening in the airport area may influence the interruption of the flight arrival and departure time table of the airport. Therefore, when thunderstorms form nearby to the airport area, warning alerts should be dispensed to people who are working outdoor and inside including signal operators and others who are working with electronic instrumentation in order to ensure their safety. Furthermore, thunderstorm activities can be addressed as the major causative factor which reduces the operational efficiency of airport and it is a demanding challenge to balance personal safety and operational efficiency.
Generally, cloud to ground (CG) lightning flashes could cause direct injuries to employees in the airport and cause damages to properties. CG lightning flash may consist of multiple strokes and those are separated in time by 20-100 ms [1] and in space by up to 12 km [2]. Furthermore, cloud flashes (intracloud, intracloud and air discharges) are also important to monitor as it has a significant influence on electronic circuits and communication signals in the airport area due to electromagnetic coupling and induce-effect. Therefore, monitoring and forecasting the total lightning (CG and IC) activities play a critical role in issuing warning alerts.
The early warning systems implemented at the airport premises are of great interest in triggering two major attributes [3-6]. It is responsible for triggering the ground delay safety programs by issuing weather alerts for outdoors workers and to high lightning-exposed areas such as aircraft parking aprons and tower buildings [3-6]. Reducing flight delays is the second most important purpose of having an early warning system [6]. On the other hand, lightning risks at the airport have been studied using several approaches which include the investigation of lightning flash density using International Electrotechnical Commission (IEC) 62305 stands and launching investigations on past happened lightning accidents at the airport area [7, 8].
Furthermore, distribution of the thunderstorm activities is not uniform around the world and about 70% of lightning activities are confined to the tropics in the world [9]. As Sri Lanka is a tropical country, a study of the variation of the seasonal and annual lightning activities over airports in Sri Lanka is an essential requirement to mitigate the lightning threats in the aviation industry. Moreover, thunderstorms pose various hazards to aviation operations in addition to dangerous cloud-to-ground lightning including low-level wind shear, poor visibility, heavy rainfall, and severe turbulence, etc. [10].
Existing standardized and accredited lightning safety rules for employees engage in the aviation industry are not strong enough to demand critical weather issues. Therefore, it is a crucial aspect to focus on lightning safety in the aviation industry. Study about the spatiotemporal distribution of the lightning flash density assists to forecast the highly lightning active seasons and months and to propose the lightning safety rules for outdoor workers and other staff members in airports. A previous study suggested that a lightning warning is ordinarily based on a first lightning strike which can be recognized within a critical distance from the airport [11].
Lightning climatology and the variation trend of the lightning activities over Sri Lanka have been descriptively analyzed in Maduranga et al. [12], Jeyanthiran et al. [13], Sonnadara et al. [14], and Maduranga et al. [15]. Furthermore, Edirisinghe and Maduranga [16] state that the average lightning flash density in the country was 8.26 flashes km-2 year-1, and the reported accidents from 1974 to 2019 emphasize that 0.56 and 0.51 people per million per year were killed and injured respectively due to lightning accidents. The average lightning flash density of the Gampaha administrative district, where the BIA is located was 16.74 flashes km-2 year-1, and 31 deaths, 20 injuries, and 33 property damage due to the lightning accidents have been recorded in the district from 1974 to 2019. For this study, the lightning data were extracted from a global database based on observations from National Aeronautics and Space Administration’s (NASA) instruments, Lightning Imaging Sensor (LIS) onboard Tropical Rainfall Measurement Mission (TRMM) low-earth-orbit satellite from 1998 to 2014. This satellite data consists of the amount, rate, time of occurrence, location, and radiant energy of lightning flashes, etc. in both the day and night [17]. These data have been used to study the lightning climatology over the area of Bandaranaike International Airport (BIA), in Sri Lanka. Also, a study about the distribution of lightning activities over BIA and the surrounded area is vital to endorse the safety of the indoor and outdoor workers and passengers. It will also assist to increase the operational efficiency of the airport which will eventually assist to achieve sustainable development in the aviation industry by successfully overcoming the weather and climatic barriers.
NASA has recorded remotely sensed lightning data using LIS which is a space-based instrument on the TRMM. LIS instrument was built in 1990 and mission operated perfectly over 17 years, from 1997 to April 2015. It has measured the amount, time of occurrence, location, rate, and radiant energy of lightning flash between ±350 in latitude, both day and night [17-19]. The TRMM satellite traveled a 7 km distance in every second as it orbits the Earth by monitoring individual storms for lightning activities for almost 80 s with detection efficiency from 69% near noon to 88% in the night [12, 14, 17, 18]. This satellite was a low-earth-orbiting satellite and it necessitates a minimum period of 49 days for the LIS instrument to observe most locations on Earth at least once in each local solar hour of the diurnal cycle [20, 21]. The satellite was passing over Sri Lanka twice per day which means 160 s day-1 with 3 km-6 km spatial resolution and 600 km × 600 km field of view. For this study, LIS data of total lightning activities in the period from 1998 to 2014 over BIA (7°10'49''N, 79°53'03''E) and surrounded area (7°02'42"N-7°18'55"N and 79°44'57"E-80°01'09"E) were considered to analyze the spatiotemporal variation of lightning flash density [22].
Then, extracted lightning satellite data over the aforementioned study area was separated into 5 km × 5 km grids annually, monthly, and seasonally. Gridded data were projected by using the Geographic Information System (GIS). Since the study area was not observed 24 hours per day and only a fraction of the lightning activities were monitored by LIS satellite, flash density (flashes km-2 year-1) in 5 km × 5 km grid was calculated by using Eq. (1), as reported by Maduranga et al. (2019) and Sonnadara et al. [12, 14].
Flash density $=\frac{\sum \text { Flashes }}{5 \mathrm{~km} \times 5 \mathrm{~km}} \times \frac{24 \times 3600}{2 \times 80} \times \frac{1}{\text { Years }}$ (1)
Raster maps of the spatial distribution of lightning flash density were generated by using the Invers Distance Weight (IDW) in GIS. Furthermore, estimated total lightning flashes during the considered time period were obtained by average flash density which was obtained from zonal statistics of the generated annual and seasonal raster maps of lightning flash density. For further analysis, BIA statistics were obtained from the Annual reports of the Civil Aviation Authority of Sri Lanka [23].
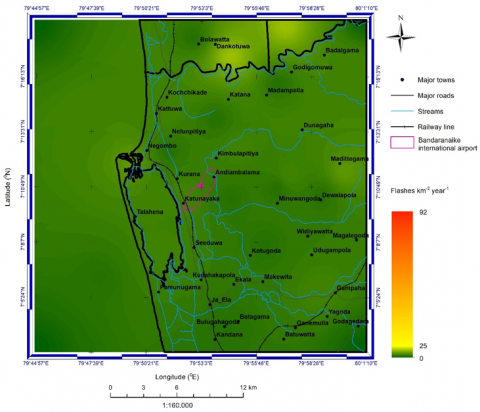
Spatial variation of lightning flash density into respective 5×5 km2 grids over the Bandaranaike international airport (BIA) was analyzed annually and seasonally by using LIS data on TRMM from 1998 to 2014. Figure 1 depicts the study area (7°02'42"N-7°18'55"N and 79°44'57"E-80°01'09"E) by covering 30 km × 30 km square by centering the BIA.
Furthermore, variation of lightning flash density over the aforementioned area was analyzed to identify the risk level and take actions to mitigate the lightning hazards in the study area. The procedure followed in the current study is in accordance with the procedure of the previous study [12]. In this study, analysis was based on the climate seasons in Sri Lanka. The climate seasons of Sri Lanka are mainly comprised two monsoon seasons and two inter-monsoon seasons, namely southwest monsoon season (May to September), northeast monsoon season (December to February), first inter-monsoon season (March to April), and second inter-monsoon season (October to November) respectively. GIS software (ArcMap 10.1) has been incorporated in the analysis of the lightning flash density. Corresponding results were used to investigate the extremely active lightning seasons and corresponding risk levels around BIA and the surrounding area.
3.1 Monsoon seasons (Southwest and Northeast)
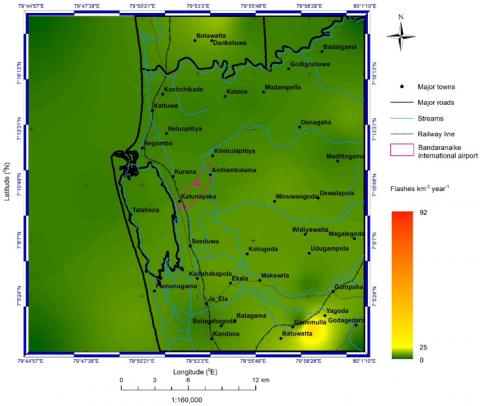
Figure 2 shows the spatial distribution of the total lightning activities in the southwest monsoon (SWM) season over the BIA, Sri Lanka in the period from 1998 to 2014. The overhead flash density was 5.28 flashes km-2 year-1 while the maximum flash density of 15.88 flashes km-2 year-1 was detected at 7°17' 39"N/ 79°54'22"E and 7°17'39"N/ 79°57'05"E which were 12.75 km and 14.66 km away from the airport respectively in the SWM. For the considered study area, an average flash density of 5.29 flashes km-2 year-1 was recorded in the SWM (minimum = 0.00 flashes km-2year-1 and standard deviation = 1.97 flashes km-2 year-1). During this season, most of the lightning activities had distributed in north regions from BIA, Sri Lanka.
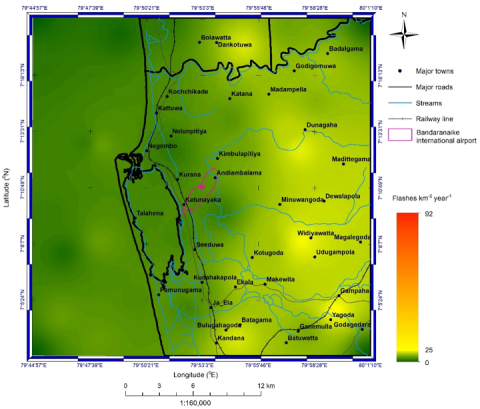
Figure 3 depicts the spatial distribution of the lightning flash density considering the lightning data in the northeast monsoon season (NEM) in the period of 1998-2014. According to Figure 3, the maximum flash density of 35.50 flashes km-2 year-1 occurred at 7°04'06"N/79°59'49"E which was 17.81 km away from the airport during this season. The overhead flash density of 7.46 flashes km-2 year-1 was observed over the BIA during the NEM. For the considered study area, an average flash density of 7.36 flashes km-2 year-1 was recorded in the NEM (minimum = 0.00 flashes km-2 year-1 and standard deviation = 2.86 flashes km-2 year-1).
Figure 4(a) depicts the estimated number of total lightning flashes in the SWM over the airport in the period of 1998 to 2014. The maximum lightning flash count of 7,323 flashes was recorded in 2002 during the SWM. Figure 4(b) depicts the count of estimated lightning flashes in the NEM from 1998 to 2014. The maximum lightning flash count of 2,817 flashes was recorded in the year 2010 during the NEM. Furthermore, a lesser number of lightning flashes had been recorded during this seasonal period as same as the SWM.
Figure 1. Expanded view of the study area
Figure 2. Spatial distribution of the lightning flash density in the southwest monsoon season from 1998 to 2014
Figure 3. Spatial distribution of the lightning flash density in the northeast monsoon season from 1998 to 2014
Figure 4. Number of estimated lightning flashes over the study area from 1998 to 2014 (a)Southwest monsoon season (b) Northeast monsoon season
3.2 Inter monsoon seasons (First and Second)
The spatial distribution of the total lightning activities during the first inter-monsoon (FIM) season over the BIA, Sri Lanka is depicted in Figure 5 using the LIS data from 1998 to 2014. In the FIM, the overhead flash density was about 28.83 flashes km-2 year-1. According to Figure 5, maximum flash density, 91.46 flashes km-2 year-1 was recorded at 7°04'05"N/ 79°54'23"E, 7°14'57"N/79°57'05"E and 7°09'31"N/79°57'06"E which were 12.75 km, 10.61 km, and 7.91 km away from the study location in the FIM respectively. For the considered study area, an average flash density of 38.72 flashes km-2 year-1 was recorded in the FIM (minimum = 0.00 flashes km-2 year-1 and standard deviation = 20.37 flashes km-2 year-1). Analysis suggests that, during this season, most of the lightning activities had distributed in west and southwest regions from BIA, Sri Lanka.
The spatial distribution of lightning flash density over the BIA, Sri Lanka for the second inter-monsoon (SIM) in the period of 1998 to 2014 is depicted in Figure 6. The maximum lightning flash density of 53.36 flashes km-2 year-1 had occurred at 7°09'30"N/79°48'57"E and 7°09'31"N/ 79°59'48"E which were 7.95 km and 12.79 km away from the study location in the SIM respectively, the overhead flash density of 16.36 flashes km-2 year-1 was recorded during the SIM. For the considered study area, an average flash density of 7.92 flashes km-2 year-1 was recorded in the SIM (minimum = 0.00 flashes km-2 year-1 and standard deviation = 7.92 flashes km-2 year-1). According to Figure 6, the peak of lightning activities was recorded in the southwest and southeast regions from the study area during this seasonal period.
Figure 7(a) presents the estimated total count of lightning flashes which were recorded in each year during the FIM in the considered period of 1998 to 2014. The year 2009 accounts for the maximum number of lightning flashes (17,727 lightning flashes). Furthermore, the second maxima (17,633 lightning flashes) had occurred in 2012. Figure 7(b) depicts the estimated number of lightning flashes which had been occurred in the SIM from 1998 to 2014. The maximum number of lightning flashes of 9,011 had been recorded in the year 2008 during the SIM.
Figure 5. Spatial distribution of the lightning flash density in the first inter-monsoon season from 1998 to 2014
Figure 6. Spatial distribution of the lightning flash density in the second inter-monsoon season from 1998 to 2014
3.3 The annual variation of lightning flash density
Annual variations of lightning flash density over the study area are represented in Figure 8 by considering the lightning data from 1998 to 2014. Overhead annual flash density was 8.19 flashes km-2 year-1 and the maximum flash density of 25.41 flashes km-2 year-1 had been recorded at 7°04'06"N, 79°59'49"E which was 4.88 km away from the airport area. For the considered study area, an average flash density of 11.18 flashes km-2 year-1 was recorded in the SIM (minimum = 0.00 flashes km-2 year-1 and standard deviation = 5.42 flashes km-2 year-1). Furthermore, according to Figure 8, lightning activities over the landmass of the considered area were higher than the activities over the area covered by the Indian Ocean and although overhead lightning flash density over the airport area is low, the nearest landmass of the airport area is vulnerable to lightning activities.
Figure 7. Number of estimated lightning flashes over the study area from 1998 to 2014 (a) First inter-monsoon season
(b) Second inter-monsoon season
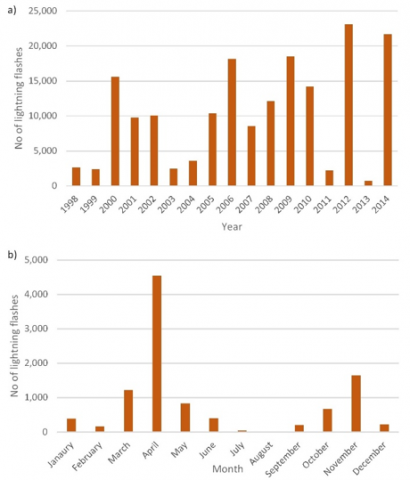
Figure 9(a) depicts the annual variability of the estimated lightning flashes over the BIA in the period of 1998 to 2014. A maximum number of lightning flashes of 23,101 flashes had been recorded in the year 2012 and year 2013 is with minimum lightning flashes over the airport area. Figure 9(b) shows the monthly variation of the estimated average number of lightning flashes which had been occurred over the BIA by considering the lightning data in the period of 1998-2014. As indicated in Figure 9(b), the month of April can be recognized as the month with most of the lightning activities with a total of 4,547 lightning flashes. Months of March, May, October, and November are vulnerable to lightning activities, while February, June, August, and September, are less susceptible to lightning activities.
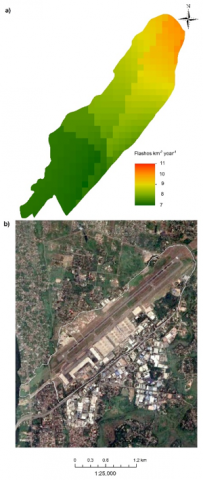
Figure 10(a) shows the extracted view of the annual spatial distribution of lightning flash density over the BIA from 1998 to 2014 and Figure 10(b) shows the satellite view of the airport area. The maximum lightning activities had been recorded over the northeast region of the runway, while over the southwest region of the runway accounts for the minimum lightning activities. For the indicated airport area, an average flash density of 8.13 flashes km-2 year-1 was recorded (maximum= 10.08 flashes km-2 year-1, minimum = 7.01 flashes km-2 year-1 and standard deviation = 0.85 flashes km-2 year-1). The geographical view shows that the airport area and surrounded area have a high building density due to the location of the Katunayake export processing zone. It confirms the urgent requirement of the implementation of a warning system for the airport area. Furthermore, if the airport administration is planning to construct any safer passenger waiting rooms, the above-mentioned low lightning active regions over the airport area can be addressed as more vital zones at the premises for such installations.
Figure 8. Spatial distribution of the annual lightning flash density over the study area from 1998 to 2014
Figure 9. Total number of estimated lightning flashes over the study area from 1998 to 2014 (a) Annual variability of lightning flashes (b) Average monthly variation of lightning flashes
Figure 10. Expanded overview of the Bandaranaike International Airport area (a) Spatial distribution of annual lightning flash density (b) Satellite view of the airport area
3.4 Analysis of seasonal and diurnal variation
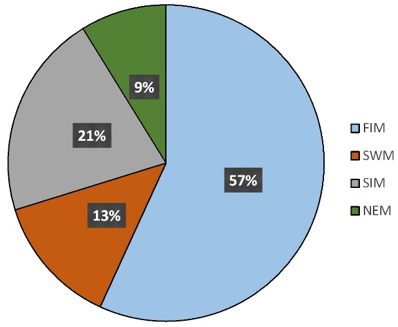
Figure 11 depicts the seasonal variation of the lightning flashes over the BIA from 1998 to 2014. Accordingly, recorded lightning flashes for the FIM season is 57%. When considering the SIM season, the lightning flashes are relatively low and the recorded percentage is 21%. In the SWM season, the noted percentage for lightning flashes is 13% and finally, the least percentage for lightning flashes had been reported during the NEM period with a percentage of 9%. Furthermore, recent studies carried out with 14 years of data of LIS on TRMM reported that the FIM accounts for the maximum lightning flashes while the minimum lightning flashes had been recorded in the NEM over Sri Lanka and surrounded coastal belt [12, 14].
Figure 11. Seasonal variation of lightning flashes over the airport area from 1998 to 2014
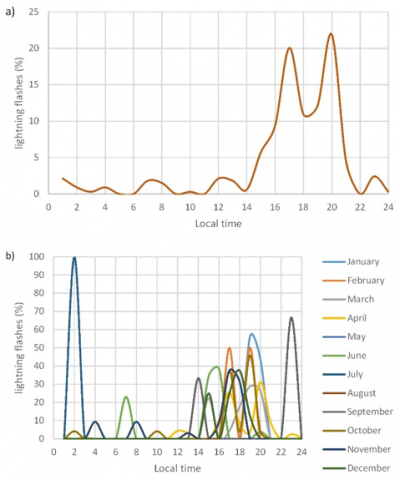
Figure 12. Variation of lightning flashes over the study area from 1998 to 2014 (a) Average diurnal variation (b) Diurnal variation lightning flashes in each month
Figure 12(a) illustrates the diurnal variation of the lightning flashes over BIA, with the use of 14 years of data from 1998 to 2014. Maximum lightning flashes (21.88% of flashes) have occurred in 19.00-20.00 Local Time (LT) during the considered time period. Furthermore, more of the lightning flashes have occurred between 14.00 LT and 21.00 LT and it is depicted that afternoon hours are highly vulnerable with lightning flashes than the other time periods in a day. Figure 12(b) shows the diurnal variation of lightning flashes for each month over BIA. According to Figure 12(b), a maximum number of flashes had occurred between 14.00 LT and 21.00 LT and the minimum number of lightning flashes had occurred in morning hours in all months. Moreover, diurnal variation of lightning activities shows that in most of the months, maximum of the lightning flashes had occurred in the evening hours (14.00 LT-21.00 LT) over the airport area.
Figure 13. Monthly variation of thunder days over Meteorological Briefing Centre for flight, located at BIA
Figure 14. Graphical overview of lightning data from 1998 to 2014 together with respective thunder data (a) Monthly variation (b) Annual variation
3.5 Analysis of thunder data
Furthermore, as a validation process, results were comparatively analyzed with the thunder data observed by the Katunayake weather station of the Metrological Department of Sri Lanka located at BIA. Figure 13 shows the variation of recorded thunder days in the period of 1998-2014. The average of thunder days in each month is indicated by the solid line in Figure 13. A maximum number of thunder days had been recorded in April while the second maxima was during November. Furthermore, the months of January and July show the minimum number of thunder days.
Figure 14(a) shows the percentage of lightning data which was observed by LIS on TRMM and the percentage of thunder data which was observed by Meteorological Briefing Centre for flight, located at BIA of Sri Lanka in the period of 1998-2014. According to Figure 14(a), both variants of the lightning data and thunder data show a maximum in April. Figure 14(b) shows the annual variability of thunder days and lightning flashes over BIA from 1998 to 2014. Although the percentage of lightning hits shows considerable variation, thunder days have a tiny variation during the aforementioned time period.
Lightning activities over the BIA and surrounded 30 km×30 km square area were analyzed to identify the highly lightning active periods and the lightning hotspots in the study area. This is crucial to implement a lightning safety plan in order to assist the continuation of both the indoor and outdoor activities at BIA without any interruption and it is important to ensure personal safety including both indoor and outdoor workers in the airport area and passengers by increasing operational efficiency at BIA. Obtained results from LIS data on TRMM from 1998 to 2014 are compared with the accuracy level of the thunder data in the aforementioned period.
On the other hand, tourism plays a leading role in the economic platform of Sri Lanka. Unique topological features and a quite hot climate in Sri Lanka throughout the year can be addressed as major lending hands to embrace tourism. BIA is the main international airport in Sri Lanka which plays a governing role in immigrations and emigrations. Figure 15 shows the number of international and domestic passenger movements at the BIA from 2004 to 2018. It shows that the number of international passenger movements has increased throughout the last years. Therefore, it is crucial to take appropriate and adequate safety precautions to ensure the safety of both international and domestic passengers in order to mitigate lightning accidents in the airport area. According to the Sri Lanka Tourism Development Authority, December, January, February, and March have higher tourist attractions to the country. According to this study, although, low lightning activities have been recorded in December, January, and February, this further emphasizes that the month of March is comparatively more likely to lightning activities than the other three months over the airport area.
Figure 15. International and domestic passenger movement in BIA from 2004 to 2018
Figure 16 depicts the number of flights that flew over Colombo Flight Information Region (FIR) airspace in 2017. Months of December, January, August, September, and March show a greater number of flights flew than other months. According to the study, lightning climatology is vulnerable in March (11.81% of lightning flashes), April (43.90% of lightning flashes), October (6.52% of lightning flashes), and November (15.92% of lightning flashes) than the other months over the airport area. Therefore, especially, airport authorities should be attentive to take further advanced technological approaches such as the implementation of auto-generated weather warning systems for indoor and outdoor workers to mitigate lightning accidents in the airport area. Although a low number of lightning activities had been recorded in December and January, a maximum of the lightning activities had been recorded in the southwest and southeast regions of the airport area in December and January.
Figure 16. Monthly variation of the number of flights flew over FIR airspace in 2017
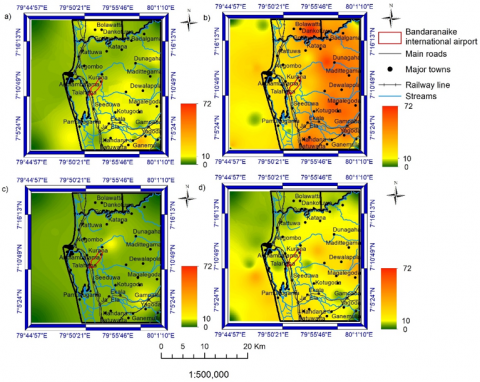
According to the international meteorological temperate seasons, there are four time periods namely winter, spring, summer, and autumn. Table 1 shows the starting and end dates of above mentioned seasons in the southern and northern hemispheres. Those seasonal periods are based on the arrival of tourists to the country. Figure 17 depicts the spatial distribution of lightning activities over the airport area in different climatological seasons. The maximum overhead flash density of 11.46 flashes km-2 year-1 and overall maximum lightning activities over BIA and surrounded area have been recorded in March to May (maximum = 71.14 flashes km-2 year-1, minimum = 0.00 flashes km-2 year-1, average = 29.34 flashes km-2 year-1 and standard deviation = 14.95 flashes km-2 year-1). During this seasonal period, the northern hemisphere is in spring and the southern hemisphere is in autumn. In the seasonal period of June to August, overhead flash density was 5.85 flashes km-2 year-1 (maximum = 10.16 flashes km-2 year-1, minimum = 0.00 flashes km-2 year-1, average = 5.00 flashes km-2 year-1 and standard deviation = 1.46 flashes km-2 year-1) and overhead flash density was 11.46 flashes km-2 year-1 in the seasonal period of September to November over the BIA(maximum = 35.57 flashes km-2 year-1, minimum = 0.00 flashes km-2 year-1, average = 11.96 flashes km-2 year-1 and standard deviation = 5.52 flashes km-2 year-1). On the other hand, 7.46 flashes km-2 year-1, overhead flash density over the BIA have been recorded in the period of December to February (maximum = 35.43 flashes km-2 year-1, minimum = 0.00 flashes km-2 year-1, average = 7.36 flashes km-2 year-1 and standard deviation = 2.86 flashes km-2 year-1).
Table 1. Meteorological temperature seasons
|
Northern hemisphere |
Southern hemisphere |
Start date |
End date |
|
Winter |
Summer |
1-Dec |
28/29-Feb |
|
Spring |
Autumn |
1-Mar |
31-May |
|
Summer |
Winter |
1-Jun |
31-Aug |
|
Autumn |
Spring |
1-Sep |
30-Nov |
Figure 17. Variation of lightning activities a) December- February b) March-May c) June- August d) September- November
On the other hand, climate changes such as variation of temperature, precipitation, thunderstorms, sea level, and wind patterns are the dominant ways which are expected to affect the aviation industry. The temperature change of the atmosphere affects aircraft performance and variation of precipitation patterns could increase delays and cancellations of flight [6, 10]. Moreover, strong storms may severely impact on schedule disruption, fuel burn, damage to infrastructure, and lightning strikes. During the tremendous lightning-active months and seasons, the airport should take measures to implement safety precautions to enhance the safety of the passengers, indoor and outdoor workers, and properties in the airport.
Generally, flight operation direction is in accordance with the prevailing wind direction and wind speed. Therefore, landing and take-off of aircraft should always against the wind. However, wind regimes in Sri Lanka can be identified as four major wind seasons. NEM (December to February), FIM (March and April), SWM (May to September), and SIM (October and November) are the major wind seasons in Sri Lanka. The mean wind direction in the SWM season is from the west of the country. According to this study, the majority of the lightning activities have been distributed in northern regions from BIA during this season. Therefore, during this season lightning activities over the northern region from BIA should be thoroughly concerned during the taking off and landing of aircraft. The mean wind direction in the NEM season is from the northeast of the country. In this season, most of the lightning activities have been distributed in southeast regions from BIA. The strongest westerly winds are in July and the strongest north-easterly winds while during January. Furthermore, it is strictly important to concern with highly lightning-active regions and time periods during the taking off and landing of flights.
Currently, there is a lack of accredited guidelines or recommendations for indoor and outdoor workers to follow up in the airport in Sri Lanka, to address the issue of lightning safety alerts. According to research from the Federal Aviation Administration in the US [24], a lightning detection system which can be detected both clouds to cloud and cloud to ground lightning should be implemented in the airport area. Furthermore, it is recommended to implement an automated lightning warning system to issue lightning alerts at 8 km and issue the severe weather alerts at 5 km to aware the indoor and outdoor workers to take prompt security measures in any operation at 5 km [25]. Moreover, within 8 km, the airport should delay fueling & ramp operations and should resume the above-mentioned operations after 15 minutes [25]. Based on these issues, it is critically important to implement the above-proposed suggestions to endorse the safety of the outdoor workers and indoor workers to increase the operational efficiency at the airport. On the other hand, at every possible time, while lending the service, outdoor workers should strictly adhere to the recommended lightning safety guidelines [26-28]. As the outdoor area is not safe during lightning, workers should be attentive to rescue themselves by immediately moving to safer shelters with well-protected coverages, according to the internationally recommended lightning protection method, and to follow the 30-30 rule [27, 28]. Furthermore, awareness of the working crew about lightning safety and providing adequate knowledge on basic first-aid for lightning victims should suitably be carried out by the airport authority.
Battle against climate and weather crises is one of the uttermost goals of achieving sustainable development of the aviation industry to gift a safe flight to all passengers. Therefore it is a vital role of the airport management to implement and enhance the existing precautionary safety measures to successfully avoid hazardous climatic and weather influences. As discussed in this study, lightning is an influential natural hazard to aviation management. Therefore, this study reveals the necessity of implementing adequate and appropriate safety precautions to minimize lightning accidents, not only for the BIA but also for all the other international airports in the tropics to achieve sustainable development by successfully triggering the challenging climate and weather barriers.
According to the results, a maximum of 57% lightning activities had been recorded in the first inter-monsoon season over the airport area from 1998 to 2014. In this seasonal period, overhead average flash density was about 28.83 flashes km-2 year-1 and maximum flash density, 91.46 flashes km-2 year-1 was recorded at 7°04'05"N/ 79°54'23"E, 7°14'57"N/79°57'05"E and 7°09'31"N/79°57' 06"E which were 12.75 km, 10.61 km and 7.91 km away from the study area, respectively. The second maxima of lightning activities have been recorded in the second inter-monsoon season which accounts for 21% of lightning activities. Furthermore, in this monsoon season, the overhead flash density of 16.36 flashes km-2 year-1 was recorded while the maximum lightning flash density of 53.36 flashes km-2 year-1 had occurred at 7°09'30"N/79°48'57"E and 7°09'31"N/ 79°59'48"E which was 7.95 km and 12.79 km away from BIA. The minimum number of lightning activities (9%) have been recorded in the northeast monsoon season during the considered time period. According to the annual variation of lightning activities, the overhead annual flash density of 8.19 flashes km-2 year-1 had been recorded while the maximum flash density of 25.41 flashes km-2 year-1 had been recorded at 7°04'06"N/ 79°59'49"E which was 4.88 km away from the airport area.
Furthermore, most of the lightning activities had occurred in the month of April over the airport area and according to diurnal variation of lightning activities, maximum lightning flashes of 21.88% flashes have occurred in 19.00-20.00 Local Time (LT) and afternoon hours are highly vulnerable with lightning flashes than the other time periods in a day.
An average flash density of 8.13 flashes km-2 year-1 was recorded within the airport area from 1998 to 2014 (maximum= 10.08 flashes km-2 year-1, minimum = 7.01 flashes km-2 year-1 and standard deviation = 0.85 flashes km-2 year-1). According to the international seasons, the maximum overhead flash density of 71.14 flashes km-2 year-1 and overall maximum lightning activities over the airport and surrounded area have been recorded from March to May. During this seasonal period, the northern hemisphere is in spring and the southern hemisphere is in autumn. On the other hand, domestic and international passenger movements have been increased throughout the last few years. Therefore, these findings are crucial to take appropriate and adequate safety precautions to ensure the safety of both international, domestic passengers and working crew at the airport in order to mitigate lightning accidents in the airport area.
Moreover, according to thunder data observed by the Meteorological Department of Sri Lanka covering the study area, a maximum number of thunder days had occurred in the month of April. Both the variation pattern of the thunder days and lightning flashes percent follow the same variation during the considered time period, henceforth, it could confirm the accuracy of the obtained variation patterns of the lightning activities in this study based on the LIS satellite data. It is also recommended that it is rigorously important to concern with high lightning-active regions and time periods during the taking off and landing of flights to minimize lightning accidents in the airport area.
Authors wish to thank the Global Hydrology Resource Centre (GHRC), Marshall Space Flight Centre (MSFC), Huntsville, USA for their assistance in providing the LIS satellite data and Katunayake weather station of Metrological Department of Sri Lanka located at Bandaranaike International Airport for providing thunder data. Facilities provided by the Department of Physics, University of Colombo, are also acknowledged.
[1] Cummins, K.L., Member, S., Murphy M.J. (2009). An overview of lightning locating systems: History, techniques, and uses, with an in-depth look at the U. S. NLDN. IEEE Trans. Electromagn. Compat., 51(3): 499-518. https://doi.org/10.1109/TEMC.2009.2023450
[2] Valine, W.C., Krider E.P. (2002). Statistics and characteristics of cloud-to-ground lightning with multiple ground contacts. J. Geophys. Res., 107(D20): 1-11. https://doi.org/10.1029/2001JD001360
[3] Holle, R.L., Demetriades, N.W.S., Nag A. (2014) Lightning warnings with NLDN cloud and cloud-to-ground lightning data. 2014 International Conference on Lightning Protection (ICLP), pp. 315-324. https://doi.org/10.1109/ICLP.2014.6973143
[4] Potts, R.J. (2009). A thunderstorm and lightning alert service for airport operation. Proceedings in Meteorology & Air Transportation, pp. 112-121.
[5] Yu, S., Xu, W., Shi. Z. (2018). Study on application of random bidirectional discharge model in risk assessment of lightning disaster at airport. 2018 34th International Conference on Lightning Protection (ICLP), pp. 1-4. https://doi.org/10.1109/ICLP.2018.8503466
[6] He, Y., Lindbergh, S., Graves, C., Rakas, J. (2021). Airport exposure to lightning strike hazard in the contiguous United States. Risk Analysis, 41(2). https://doi.org/10.1111/risa.13630
[7] Tarimer, I., Kuca, B. (2013). An overview on the protection measures for air-port protection in high density lightning regions. Elektronika Ir Elektrotechnika, 19(10): 29-32. https://doi.org/10.5755/j01.eee.19.10.5832
[8] Tarımer, I., Kuca, B., Kisielewicz, T. (2012). A case study to risk assessment for protecting airports against lightening. Elektronika Ir Elektrotechnika, 117(1): 49-52. https://doi.org/10.5755/j01.eee.117.1.1052
[9] Holton, J.R., Curry, J.A., Pyle J.A. (2015). Encyclopedia of Atmospheric Sciences. Academic Press.
[10] Taszarek, M., Kendzierski, S., Pilguj, N. (2020) Hazardous weather affecting European airports: Climatological estimates of situations with limited visibility, thunderstorm, low-level wind shear and snowfall from ERA5. Weather Clim. Extrem., 28: 100243. https://doi.org/10.1016/j.wace.2020.100243
[11] Steiner, J.A.C.M., Boulder, N.C.A.R., Deierling, W., Nelson, E., Stone, K., Johnson, D., Bass, R. (2013). Lightning safety at airports—material for thunder. 16th Conference on Aviation, Range, and Aerospace Meteorology.
[12] Maduranga, U.G.D., Edirisinghe, M., Gamage, L.V. (2019). Spatiotemporal variability of lightning flash distribution over Sri Lanka. International Letters of Chemistry, Physics and Astronomy, 82: 1-13. https://doi.org/10.18052/www.scipress.com/ILCPA.82.1
[13] Jeyanthiran, V., Edirisinghe, M., Fernando, M., Cooray, V. (2008). Study of lightning activity over Sri Lanka. 29th International Conference on Lightning Protection, Uppsala, Sweden.
[14] Sonnadara, U., Jayawardena, W., Fernando, M. (2019). Climatology of lightning flash activities over Sri Lanka. Theor. Appl. Climatol., 137: 3173-3182. https://doi.org/10.1007/s00704-019-02808-w
[15] Maduranga, U.G.D., Edirisinghe, M., Gamage, L.V. (2018). Annual variation trend of lightning flash activities over Sri Lanka. World Scientific News, 114: 256-264.
[16] Edirisinghe, M., Maduranga, U.G.D. (2021). Distribution of lightning accidents in Sri Lanka from 1974 to 2019 using the DesInventar database. ISPRS Int. J.Geo-Inf., 10(3): 117. https://doi.org/10.3390/ijgi10030117
[17] GHRC: Lightning Imaging Sensor (LIS) Instrument overview. https://lightning.nsstc.nasa.gov/lis/overview_lis_instrument.html, accessed on Jun. 5, 2018.
[18] Graves, R., Conover, S., Jones, H., Hardin, S., Harrison, D., Drewry, S., Nair, M., Goodman, M., Blakeslee, M. (2009). A ten year record of space based lightning measurements. American Geophysical Union. http://adsabs.harvard.edu/abs/2009AGUFMAE32A..07C.
[19] Christian, H.J., Blakeslee, R.J., Goodman, S.J., Mach, D.A., Stewart, M.F., Buechler, D.E., Koshak, W.J., Hall, J.M., Boeck, W.L., Driscoll, K.T., Boccippio, D.J. (1999). The lightning imaging sensor. NASA Conf. Publ., pp. 1-4. https://ntrs.nasa.gov/citations/19990108789.
[20] Douglas, M., Boccippio, D.J., Driscoll, K., Hall, J., Buechler, D.E. (1998). LIS/OTD Software Guide. Global Hydrology and Climate Center, 142. https://ghrc.nsstc.nasa.gov/pub/doc/lis/LISOTD_UserGuide.pdf.
[21] Boccippio, D.J., Goodman S.J., Heckman, S. (2000) Regional differences in tropical lightning distributions. J. Appl. Meteorol., 39(12): 2231-2248. https://doi.org/10.1175/15200450(2001)040<2231:RDITLD>2.0.CO;2
[22] TRMM Lightning Imaging Sensor (LIS) Data Sets, NASA. https://lightning.nsstc.nasa.gov/data/data_lis.html, accessed on Jun. 5, 2018.
[23] Civil Aviation Authority (CAA) of Sri Lanka. Annual Report – 2003-2018. Civil Aviation Authority of Sri Lanka, Sri Lanka. 2004-2019. https://www.caa.lk/en/downloads/annual-reports.
[24] Federal Aviation Administration. https://www.faa.gov/, accessed on Nov. 18, 2020.
[25] IATA. Iata.org. https://www.iata.org/, accessed on Nov. 18, 2020.
[26] Cooper, M.A., Holle, R.L. (2012). Lightning safety campaigns - USA experience. 2012 International Conference on Lightning Protection (ICLP), pp. 1-7. https://doi.org/ 10.1109/ICLP.2012.6344289
[27] Zimmermann, C., Cooper, M.A., Holle, R.L. (2002) Lightning safety guidelines. Ann Emerg Med., 39(6): 660-664. https://doi.org/10.1067/mem.2002.124439
[28] Holle, R.L., López, R.E., Howard, K.W., Vavrek, J., Allsopp, J. (1995) Safety in the presence of lightning. Seminars in Neurology, 15(4): 375-380. https://doi.org/10.1055/s-2008-1041047