Amna Hussain Sabree Ali
© 2021 IIETA. This article is published by IIETA and is licensed under the CC BY 4.0 license (http://creativecommons.org/licenses/by/4.0/).
OPEN ACCESS
The current study aims to use the descriptive experimental approach as an applied tool for spatial development in its modern sense in the proposed new city project in Samawah, and to benefit from the development potential. The method of digital analysis of the developmental possibilities was used using the modern geographic information system (GIS), the SWOT strategic analysis model, and the spatial interaction of the real situation to reach the appropriate strategy for comprehensive development, the direction of expansion, and the appropriate spatial signature of the new city. The development strategy (SO) was proposed through a spatial model based on the strengths and opportunities of the development potential under consideration, to aid in the appropriate planning decision-making process to integrate and implement a new city with a sustainable social green economy.
Samawah city, strategic analysis model (SWOT), spatial interaction, potential development method, digital indicators, green economic
Several studies define sustainable development as “development that responds to the needs of the present without jeopardizing future generations' ability to meet their needs.” This definition implicitly focuses on two key ideas: the concept of needs, specifically the basic needs of the most disadvantaged social classes, which need special attention, and the concept of limited ability. Growth, in general, has three major dimensions: economic, social, and environmental. on the other side.
The problem is the possibility of achieving comprehensive spatial development for the city of Samawah as an applied case to provide basis for green economic, social, and environmental activities and to benefit from the developmental potential and energy of urban expansion and build a new attractive and influential city in the region and the surrounding areas in order to determine the direction of urban expansion and achieve comprehensive sustainable development.
New methods of analyzing developmental potential and spatial interaction help to understand and analyze the dynamics and strategies as well as support decision makers in effective planning in order to have a clear understanding of the current weaknesses and threats caused by urbanization processes and allow prediction of future problems.
Pasqualini et al. [1] suggested a technique for producing maps based on publicly accessible data to help in decision-making. Ferretti and Pomarico [2] identified potential ecological networks and support spatial planning. Cominoa and Ferretti [3] developed a spatial planning support system based on indicators. Tsangas et al. [4] employed a set of indicators such as SWOT analyse to assess the sustainability of the new sector. Bevilacqua et al. [5] reported that a SWOT analysis provides interesting insights toward building this conceptual framework.
Jeleski et al. [6] employed a SWOT analysis to classify factors that influence the smart management of RES potential, specifically household decisions about switching to renewable energy sources. Namugenyi et al. [7] designed a new SWOT Model to analyse, documents and model the unified metadata, their visualization and interpretation in new knowledge domains.
Therefore, the purpose of the current study is to present an integrated framework of analysis, evaluation according to a comprehensive set of indicators. In other words, the study aims to reach the selection of appropriate strategies (strategic position) to achieve the vision and goal, depending on the current state of development potentials, and the quantitative analysis extracted from the development potential Matrix. The current study employs development factors in the target area, i.e. Samawah city, using the GIS program as well as a SWOT analyses, and spatial interaction.
Sustainable development is not only concerned with the environment, but also with the economic and social aspects, and these dimensions intersect and are interconnected with one another. Furthermore, it is not possible to deal with it in isolation from each other because it operates in an interconnected environment characterized by precision, coordination, and rationalization because they all devote my values and sustainable development approaches based on social justice, as illustrated in Figure 1.
In this way, development investment must prioritize the long-term security of the assets that support basic economic services. Using green technology and modern infrastructure, resource efficiency, upgrades, the conservation of ecological assets, the maintenance of public spaces, and the development and enhancement of social capital will be the new investment priorities. Accordingly, this is what sustainable development strives to achieve.
On the other hand, the green economy is very important in terms of maintaining a sustainable environment. In other words, it strives for long-term growth that promotes social justice while still ensuring economic stability. Simultaneously, by implementing sustainable projects such as clean manufacturing, renewable energy, and equitable use of resources and capabilities, growing jobs and economic growth rates, as well as increasing income for low-income families and working to close the wealth-poverty gap. Furthermore, investments contribute to the alleviation of rural poverty and the reduction of rural migration to cities.
Figure 1. Sustainable development
3.1 Indicators
With the increasing importance of moving towards achieving sustainable development for a better level of social, environmental and economic life, and in the face of increasing and exacerbating environmental risks, to achieve a common vision and a set of values for the protection and sustainability of the community’s environment, as well as to identify ways to inspire governments and international organizations to do what is appropriate to preserve and enhance the environment. Therefore, many international agreements have been issued to protect and promote the environment, and to achieve well-being and societal justice for the present and future generations. The real start was the start of interest in the human environment in general, which resulted in the United Nations General Assembly establishing the United Nations Environment Program (UNEP). This led to interest in environmental affairs and international cooperation in protecting the environment of society in general, and to suggesting long-term environmental strategies to achieve sustainable development.
3.2 Challenges
The move to a green economy is fraught with difficulties (clean energy) [8-10]. Generally, in the field of construction policies, there is a lack of strict planning. On the other hand, the shift in employment from one sector to another is considered as another challengers [11, 12]. As a boost in employment in one sector is offset by a reduction in employment in another, especially during the transitional period. As a result, unemployment rises in society and can be concentrated in a single population category. Furthermore, transitioning to a green economy and renewable energy is a costly choice that does not result in fair and automatic economic and environmental benefits [13]. However, this change can have a negative impact on other aspects of growth [14, 15].
The study area is one of the most important cities in the Al-Muthanna Governorate, which is the second largest of Iraq’s governorates in terms of area, but it is the least in terms of population. Its population in 2018 reached about 775 thousand people, according to the estimates of the Ministry of Planning, and currently it is about one million people, and the population density is (16.4 individuals/km2). Al-Muthanna Governorate is one of the southern governorates in terms of geographical location and the middle of the Euphrates administratively. It extends over an area of 51,000 km2. It consists of five districts and seven aspects. It is bordered to the north by the Najaf and Diwaniyah governorates, and to the east by the Dhi Qar governorate. The governorate is characterized by the presence of Sawa Lake, which is one of the most beautiful lakes in the world. The world and the ancient city of Warka, which is the oldest human civilization known to man, dates back to the fifth millennium BC.
4.1 Location of case study
The study area is situated southwest of Samawah's central business district beyond the city's basic master plan. It covers 3100 hectares within the lands of the district (5) Umm al-Tulul and the Western Sharakah District (16) and constitutes 38.75% of the total area of central Samawa, which is 8000 hectares. It extends between two latitudes (07.29-42.31) north and a linear length (46.37-43.5). Samawah city as shown in Figure 2.
4.2 Indicators of actual reality and development potential
The study area is characterized by multiple and diverse development potentials, including renewable energy and natural resources, the possibility of benefiting from wind energy, and the possibility of its contribution to the supply of electricity to remote areas. Also, the presence of a crude oil refinery, as it is the largest warehouse for raw materials used in the cement industry in the world.
The strategic crude oil carrier line passes through its territory, and a railway station is available, it is the latest in Iraq. The Al-Muthanna governorate in general and the study area in particular are agricultural areas, but the lack of rainfall led to a decrease in the water level in the Euphrates River, which greatly reduced agricultural production. The most important crops that are grown are wheat, barley and rice, as well as being surrounded by palm groves. In each of the districts of Samawah, Al-Khader, and Al-Rumaitha, it is characterized by a distinguished production of dates. Industrially, there are two cement production plants in the governorate, the most famous of which is the Al-Muthanna Cement Factory. There are deposits of sodium salts used in the production of table salt in abundance on the western side of the city of Samawa, near Lake Sawa, which is a lake that formed naturally thousands of years ago. Lake Sawa covers an area of about 10 square kilometres, surrounded by sand on all sides, it is a distinguished tourist investment target, and an outlet for the city that suffers from the lack of recreational facilities in it.
On the other hand, and according to the structural scheme of Samawa, the green belts along the northern and southern edges of the agricultural area can be considered as another aspect of the potential. The roads to the south of the study area are part of the development of the transport and trade roads connecting Samawah to the borders of the Kingdom of Saudi Arabia, as shown in Figure 3.
Figure 2. Administrative borders of Muthanna Governorate / Al Samawah City
Figure 3. The borders with Saudi Arabia, transport and trade lines
5.1 Analysis
The method is summarized on the analysis of development factors in the study area using the GIS program, as follows:
Inventory and arranging the table for the development potential and what are the available capabilities, and then determining the main and secondary development factors and their weights, which was determined by the researcher based on information from specialists in Al-Muthanna Governorate, as shown in Table 1.
(a) Final summation of the multiplication process for development factors and their weights in Factor groups and for all the development factors that are determined as a reality. The result is the final numbers that are called the development potentials in each Grid of the original map of the study area.
(b) The number of squares of development potentials for the study area reached (16) squares. These squares were classified and abbreviated as a final result according to the value of the factor and the total potentials of the sectors and each analytical square, by collecting these capabilities and then multiplying them by the main factor to extract the factor value for each of the sub-factors and for all the squares. Then extract the final weight for each of the major and minor factors Table 2.
(c) All the numbers that appeared in all the boxes were studied and the value of the highest numbers that indicated the available development sites and appropriate alternatives were determined, and within the development capabilities available in the study area.
After collecting all of the numbers from all of the boxes found within the study area and comparing them with the possibilities shown in Figure 4. In comparison to the other regions, it became apparent that the Southern region has a lot of potential. This makes it a stronger alternative to the spatial signing of the green development project for the new city in order to build a green economic foundation that attracts people, creates housing and work opportunities, and helps to close the poverty and unemployment gap, and achieves sustainable development.
5.2 Strategic analysis Model (SWOT) and spatial interaction
The use of this model is one of the important tools used in analyzing the nature of the strategic decision taken for the most important weaknesses and strengths in the internal environment, and the opportunities and threats to the external environment of the study area.
Consequently, reaching the selection of suitable strategies (strategic position) to achieve the vision and goal. Table 3 shows the strategic analysis model for the internal and external environment.
For the purpose of applying the (SWOT) matrix, the factors of the SWOT analysis and their qualitative effects were transformed into factors and effects of quantitative value through the following:
(a) Adopting the relative weight of each factor of the internal and external environment between (0, 1), noting that the sum of the relative weight of any factor does not exceed its value than the correct one. (The probability value).
(b) Giving a probability ranking for each factor of the internal and external environment from (1) to (5) according to their importance as shown in Table 4.
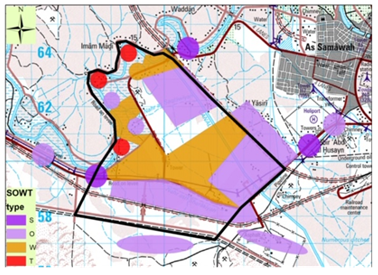
(c) Extracting the weight by multiplying the relative weight of each factor by the degree of probability importance through what has been determined with regard to strengths, weaknesses, opportunities and threats in the event of strategic decision-making. Table 5 shows the weight of those factors to reach an appropriate strategic decision while Figure 5 shows the locations of strength, weakness, opportunities, and threats as a current reality.
Table 1. Development potential matrix
|
Main factors |
Sub-factors |
Weights |
Total |
|
The economic factor |
Agricultural resources |
5 |
(5+4+2) = 11 |
|
Industrial resources |
4 |
||
|
Tourism Investments |
2 |
||
|
Social factors |
Social Justice |
2 |
4 |
|
Transportation and accessibility |
1 |
||
|
Social homogeneity |
1 |
||
|
Environmental factors |
Environmental pollution |
5 |
11 |
|
Renewable energy |
4 |
||
|
Green and recreational spaces |
2 |
||
|
Urban factors (urban) |
Harmony with the urban fabric |
2 |
4 |
|
Scope of positive influence |
1 |
||
|
Possibility of future expansion |
1 |
Table 2. The weighting value of the development potential (squares)
|
|
1 |
2 |
3 |
4 |
|
A |
88 |
125 |
35 |
0 |
|
B |
102 |
170 |
137 |
52 |
|
C |
161 |
113 |
166 |
129 |
|
D |
68 |
115 |
114 |
63 |
Figure 4. Potential analysis
Table 3. A strategic analysis model for the internal and external environment
|
Internal environment assessment
Assessment of the external environment |
Evaluate the internal performance of the institution |
||
|
|
The most important strengths |
The most important weaknesses |
|
|
The most important opportunities |
Required: 1- Maximize the use of opportunities 2- Maximize the exploitation of strengths (Development strategy) (S-O) |
Required: 1- Maximize the use of opportunities 2- Minimize the use of vulnerabilities (Therapeutic strategy) (W-O) |
|
|
Evaluate the external environment in which the institution operates |
The most important threats |
Required: 1-Reduce the threats 2- Maximize your strengths (Defensive strategy) (S-T) |
Required: 1-Reduce the threats 2- Minimize the use of vulnerabilities (Contractionary strategy) (W-T) |
Table 4. Probabilistic ranking of factors
|
Probabilistic importance |
very important |
Important |
Medium importance |
Less than medium importance |
Poor importance |
|
Class |
5 |
4 |
3 |
2 |
1 |
Figure 5. Strategic analysis (SWOT)
In order to reach the appropriate decision-making and strategy as the best developmental alternative that achieves the goal and confirms the hypothesis, Table 6 was reached. Table 6 represents the spatial interaction of the internal and external environment in the quadratic analysis.
It is obvious from an analysis of the results obtained from Table 6 that the results obtained are positive and in the amount of (0.1) meaning there is no development gap. There are also strengths rather than weaknesses, in addition to the availability of development opportunities and in numbers greater than threats. That is, the strategy required in this case is the development strategy to implement a new city with a socially green economy capable of achieving development and expansion and sustainable development.
Table 5. The weight of the strengths and weaknesses of the internal environment and the opportunities and threats to the external environment
|
Internal environment factors |
||||
|
Analysis of strengths |
||||
|
No. |
The details |
Relative weight |
Probabilistic Ranking |
Weight of Weighting |
|
S1 |
The total area available for the site and the proposed new city |
0.30 |
5 |
(0.30 *5) = 1.5 |
|
S2 |
Huge potentials help to establish renewable energy projects, in addition to agricultural, industrial and tourism potentials |
0.15 |
5 |
0.75 |
|
S3 |
Ease of access and trade routes |
0.05 |
2 |
0.10 |
|
Total |
0.50 |
|
2.35 |
|
|
Weakness analysis |
||||
|
No. |
The details |
Relative weight |
Probabilistic Ranking |
Weight of Weighting |
|
W1 |
Lack of experience and skill of local authorities in investing projects with renewable energies and signing them spatially. |
0.15 |
3 |
(0.15*3) = 0.50 |
|
W2 |
Weakness in the criteria for signing projects, in addition to the issue of their insufficiency. |
0.10 |
3 |
0.30 |
|
W4 |
The shortage of financial services and allocations. |
0.25 |
4 |
1 |
|
Total |
0.5 |
|
1.80 |
|
|
Total internal environment |
(0.5+0.5) =1 |
|
(2.35+1.80)=4.15 |
|
|
External environmental factors |
||||
|
Opportunities |
||||
|
No. |
The details |
Relative weight |
Probabilistic Ranking |
Weight of Weighting |
|
O1 |
The establishment of the new city project will provide job opportunities and reduce unemployment. |
0.10 |
3 |
(0.10*3)=0.30 |
|
O2 |
There is government support and direction to establish green smart cities. |
0,30 |
4 |
1.20 |
|
O3 |
The new city's position inside the targeted areas for implementing a modern waste collection system. |
0.05 |
2 |
0.10 |
|
O4 |
Development of a transportation and trade corridor connecting Samawah to the borders of the Kingdom of Saudi Arabia in order to facilitate commercial and social exchange and boost the economy. |
0.05 |
4 |
0.20 |
|
Total |
0.5 |
|
1.70 |
|
|
Threats |
||||
|
No. |
The details |
Relative weight |
Probabilistic Ranking |
Weight of Weighting |
|
T1 |
Clan disputes over agricultural contracts |
0.20 |
3 |
(0.2*3) = 0.60 |
|
T2 |
The security situation and political stability |
0.24 |
3 |
0.72 |
|
T3 |
The presence of excesses and randomness |
0.035 |
3 |
0.10 |
|
T4 |
The inadequacy of the focal and community infrastructure services |
0.025 |
2 |
0.05 |
|
Total |
0.5 |
|
1.47 |
|
|
Total external environment |
1 |
|
(1.70+1.47)=3.17 |
|
Table 6. Spatial interaction of strategic quadruple analysis
|
Spatial interaction of internal and external environment factors |
External environment |
Subtraction |
|||
|
Opportunities |
Threats |
||||
|
1.70 |
1.47 |
(1.70-1.47)=0.23 |
|||
|
Internal environment |
Strength points |
2.35 |
Development strategy S-O |
|
|
|
Weaknesses |
1.80 |
||||
|
Subtraction |
(2.35-1.80)=0.55 |
||||
Based on a survey of the developmental potentials and a study of the reality of the study area and its geographical surroundings, in addition to a quantitative analysis of the potentials in the study area and the analysis (SWOT), we came to the reality of the availability of all kinds of developmental potentials. This inference can be shown by the discussion of the findings of the study.
According to the results of Table 1 that extracted from the sum of the product of the main factor coefficients by the coefficients and weights of the sub factors, the superiority of the economic factor and Environmental factors, where the ranking was (11) degrees. This followed by social factors and Urban factors (urban) which achieved (4) degrees. The economic factors are represented by the agricultural, industrial and tourism resources, and the environmental factors from sources of renewable energies and the availability of green spaces in light of the determinants of environmental pollution standards. Whereas the social factors and urban factors are represented transportation networks in addition to the range of positive impact.
The probability of urban expansion therefore emerged and was based on the effects of the weighting value of the potential squares derived from the potential matrix. Accordingly, it became apparent that the proposed direction of urban expansion for the new city in the southern region was based on the planning requirements for the spatial signature of the GIS programme, is showed the concentration of development potentials in it based on what is specified from the numerical values in Table 2.
Table 5 shows the indicators extracted from the results of the SWOT probability analysis and spatial interaction. Accordingly, the elements of the internal environment were at a rate of 4.15% (the weight of the strengths, which appeared by (2.35) + the weight of the weaknesses, which appeared by (1.80%)). This confirms the availability of the development potential of the study area, which constitutes an attractive force for development. As for the elements of the external environment, they were at a rate of (3.17%) (The weight for the details of the opportunity points was (1.70%) + the weight for the details of the threat points was (1.47%)). This gives a greater opportunity to take advantage of opportunity points in development investment.
From the analysis of the strategic model of the reality of the situation and the spatial interaction, the results were drawn, as in Table 6. Table 6 illustrated the process of spatial interaction through the intersection of rows and columns for the internal and external environment factors. Where it was found that the outcome of the subtraction process for the rows that represent the most important points of opportunities and threats in the external environment was (0.23%). This percentage indicates the percentage of horizontal spatial interaction of development factors with their regional surroundings represented by government support for the establishment of new sustainable cities. Also, the possibility of regional connection to networks Transportation, development and foreign trade.
As for the subtraction of the columns for the most important strengths and weaknesses in the internal environment, which appeared at a rate of (0.55%). It shows the percentage of vertical spatial interaction of development factors represented by the local development potentials within the structure of the study area. By comparing the results of the numerical ratios of the subtraction process for the internal environment factors and the external environment factors, the strengths of the development potentials in the internal environment are higher than the weaknesses by 55%. On the other hand, by comparing of the results of the numerical ratios of the subtraction process for the external environment factors, where it appeared that the points of development opportunities are higher than threat Score by 23%. Nevertheless, it was found that there is a strategic gap of (0.78%) resulting from the subtraction process based on the following equation:
$\text { Strategic Gap }=\text { (Opportunities }+\text { Strengths }) \text { - (Threats + Weaknesses) }$ (1.70+2.35) – (1.47+1.80) = 0.78 (1)
Accordingly, in order to make the appropriate planning decision, the required strategy (as a developmental alternative) in this case is (the S-O developmental strategy) to exploit the developmental opportunities by relying on the strengths. In addition, to apply digital indicators of development potentials in the study area, and strategic analysis and spatial interaction in order to bridge the gap to achieve spatial balance to reach sustainable development.
Based on the preceding debate, we arrived at the following major conclusions:
(i) According to the results, there is no doubt about the availability of renewable energy sources such as solar energy and wind energy in the target region, but what is more relevant is the availability of regulations and laws that promote this.
(ii) The move to a green economy has the potential to achieve sustainable development by making the best use of any available space and eradicating poverty by employing unemployed people and attracting labor for the projects needed to build the new city.
(iii) Renewable energy is critical for environmental protection because it is non-polluting and clean, and its usage is growing, reducing the use of conventional energy sources.
(iv) By analyzing the results obtained, operational guidelines on where and how land use can be restricted in order to ensure sustainable land use in the area under consideration, which is distinguished by exceptional and multidimensional values, can be created.
(v) The SWOT analysis results allowed the identification of the most vulnerable components of the area under consideration (weaknesses) that require defense intervention and monitoring, as well as environmental and physical factors with the highest human intervention effect (Threats) and the most valuable areas (Strengths and Opportunities) within the region under investigation.
The results of the research and the spatial analysis applied in this study have made clear the possibility of providing the conditions for the green economy principle. The development strategy to introduce and implement a new city with a social green economy capable of achieving development and expansion and sustainable development is also needed. In addition, the importance of holding educational and technical workshops to assist all target sectors, decision-makers and policy makers in the implementation of green economy processes and technologies.
Through the results of the research, the following recommendations have become necessary:
1. The political and economic decision-makers should set up an economic reform program according to a timetable in order to develop the economy in the target area. This plan contributes to creating sustainable development and making use of the development potentials and energies in the region in order to build an agricultural and industrial base for environmentally friendly projects. on the other hand, it can be used later to build other development projects and thus increase the gross domestic production and create goods to fill the deficit in the reality of the city’s condition, as well as the need for the rest of the economic sectors and to maximize Its resources. In addition to establishing interconnected projects, especially between the industrial and agricultural sectors.
2. The developmental priorities of agriculture for which the comparative advantage and nature of water resources are available mainly, and the requirements for operating water storage projects and operating irrigation and reclamation projects in the governorate.
3. Providing enabling conditions to enhance agricultural activity and directing it towards a green economy, which is one of the priorities of the development strategy can achieve this point by establishing a green economy support office. Also, achieving the principles of sustainable development and improving human well-being, equity and justice Social and according to the following criteria:
4. Create a website that includes the following:
[1] Pasqualini, V., Oberti, P., Vigetta, S., Riffard, O., Panaïotis, C., Cannac, M., Ferrat, L. (2011). A GIS-based multicriteria evaluation for aiding risk management Pinus pinaster Ait. Forests: A case study in Corsican Island, Western Mediterranean region. Environmental Management, 48(1): 38-56. https://doi.org/10.1007/s00267-011-9674-8
[2] Ferretti, V., Pomarico, S. (2013). Ecological land suitability analysis through spatial indicators: An application of the Analytic Network Process technique and Ordered Weighted Average approach. Ecological Indicators, 34: 507-519. https://doi.org/10.1016/j.ecolind.2013.06.005
[3] Comino, E., Ferretti, V. (2016). Indicators-based spatial SWOT analysis: Supporting the strategic planning and management of complex territorial systems. Ecological Indicators, 60: 1104-1117. https://doi.org/10.1016/j.ecolind.2015.09.003
[4] Tsangas, M., Jeguirim, M., Limousy, L., Zorpas, A. (2019). The application of analytical hierarchy process in combination with PESTEL-SWOT analysis to assess the hydrocarbons sector in Cyprus. Energies, 12(5): 791. https://doi.org/10.3390/en12050791
[5] Bevilacqua, C., Anversa, I.G., Cantafio, G., Pizzimenti, P. (2019). Local clusters as “building blocks” for smart specialization strategies: A dynamic SWOT analysis application in the case of San Diego (US). Sustainability, 11(19): 5541. https://doi.org/10.3390/su11195541
[6] Jeleński, T., Dendys, M., Tomaszewska, B., Pająk, L. (2020). The potential of RES in the reduction of air pollution: The SWOT analysis of smart energy management solutions for Krakow Functional Area (KrOF). Energies, 13(7): 1754. https://doi.org/10.3390/en13071754
[7] Namugenyi, C., Nimmagadda, S.L., Reiners, T. (2019). Design of a SWOT analysis model and its evaluation in diverse digital business ecosystem contexts. Procedia Computer Science, 159: 1145-1154. https://doi.org/10.1016/j.procs.2019.09.283
[8] Kothari, A., Demaria, F., Acosta, A. (2014). Buen Vivir, degrowth and ecological Swaraj: Alternatives to sustainable development and the green economy. Development, 57(3): 362-375. https://doi.org/10.1057/dev.2015.24
[9] Nurse, K. (2006). Culture as the fourth pillar of sustainable development. Small States: Economic Review and Basic Statistics, 11: 28-40.
[10] McDermott, M., Mahanty, S., Schreckenberg, K. (2013). Examining equity: A multidimensional framework for assessing equity in payments for ecosystem services. Environmental Science & Policy, 33: 416-427. https://doi.org/10.1016/j.envsci.2012.10.006
[11] Lavrinenko, O., Ignatjeva, S., Ohotina, A., Rybalkin, O., Lazdans, D. (2019). The role of green economy in sustainable development (case study: the EU states). Entrepreneurship and Sustainability Issues, 6(3): 1113. http://doi.org/10.9770/jesi.2019.6.3(4)
[12] Luomi, M. (2015). The international relations of the green economy in the gulf: Lessons from the UAE's state-led energy transition. https://ora.ox.ac.uk/objects/uuid:4577fbdc-dca5-492d-9a16-561a6a7e1bb2.
[13] Furchtgott-Roth, D. (2012). The elusive and expensive green job. Energy Economics, 34: S43-S52. https://doi.org/10.1016/j.eneco.2012.08.034
[14] Lebedev, Y., Anufriev, V., Lebedeva, T., Kaminov, A., Yachmenyova, A. (2015). Professional training of future green economy specialists and strategic priorities for sustainable subsurface management. Procedia-Social and Behavioral Sciences, 214: 657-666. https://doi.org/10.1016/j.sbspro.2015.11.664
[15] Mishra, P.K. (2017). Green economy: A panacea for sustainable development and poverty reduction. Journal of International Economics, 8(1): 19-28.