Derradji Mederreg | Mohamed Salmi | Maouedj Rachid | Hijaz Ahmad | Giulio Lorenzini* | Younes Menni | Houari Ameur
© 2021 IIETA. This article is published by IIETA and is licensed under the CC BY 4.0 license (http://creativecommons.org/licenses/by/4.0/).
OPEN ACCESS
Details on the wind potential during a period of about thirteen years in Algeria is given in the present work. The inspection is performed for sixteen regions covering almost all the territory of the country. The density of the mean wind power is determined for the different regions. The maps of annual and seasonal wind energy resources are also established. The characteristics of the wind velocity, as well as the potential of wind power, are determined by the Weibull distribution. From the given results, the highest values of annual mean wind speed and the annual mean wind power density are found in Adrar (P10 = 283.12 W/m2 and P50 = 646.91 W/m2), while the lowest values are observed in Skikda (P10 = 40.61 W/m2 and P50 = 115.51 W/m2, respectively).
wind potential in Algeria, resources of wind, windy regions, Weibull distribution, wind speed, wind power density
The quantity of available energy for the reserves of fossil fuel changes seasonally and daily. However, and for the wind, the determination of its resources remains really difficult, since its power is affected by topography, contrary to the solar energy. In addition, the characteristics and distribution of the wind-engines have a significant impact on the wind conversion in the same region. In the literature, some scientific studies assessed the Algerian potential of wind. The design of systems and techniques to covert the wind energy in this country was also discussed by some authors. Amon other works, Himri et al. [1, 2] presented details on the wind power in the south of Algeria. Maouedj et al. [3-5] interested in various regions of Algeria. Aksas et al. [6] analyzed wind energy at Batena (Algeria) during the period of 1999-2008. Benmedjahed et al. [7-11] reviewed the potential of wind energy in some regions of Algeria. Only few studies [12-15] participated in the map actualization of this country by adding other sites and other parameters in the assessment of wind resources. Other experimental on the wind energy in different regions of Algeria may be found in Refs. [16-22].
The objective of this survey is to explore the resources of the Algerian wind by using the meteorological data, the temperature and direction of the wind. An effort was made to evaluate the energy potential of various regions and to conduct a classification of these regions.
Sixteen regions were considered in this study. Their geographical positions are given in Figure 1 and Table 1. Data for the explored regions were given from the Algerian Meteorological National Office [12, 23].
Figure 1. Position of the meteorological stations in Algeria [4]
Table 1. Geographical positions of the various regions under investigations [4, 12, 23]
|
|
Sites |
Longitude (°) |
Latitude (°) |
Altitude (m) |
Topographic Situation |
|
01 02 03 |
Skikda Algiers Oran |
06° 57’ E 03° 15’ E 00°37’ W |
36°52’N 36° 43’N 35° 38’N |
9 25 99 |
Coastal zone |
|
04 05 06 |
Tebassa Chlef Tlemcen |
08°08’E 01°21’E 01°19’W |
35° 26’N 36° 10’N 34° 56’N |
816 112 810 |
North of the Tellien mountains |
|
07 08 09 |
Djelfa Tiaret El Bayadh |
03° 15’ E 01° 20’ E 01° 01’ E |
34° 41’N 35° 23’N 33° 41’N |
1144 1023 1305 |
Highlands |
|
10 11 12 13 14 15 16 |
In Amenas InSalah Tindouf Adrar Béchar Ghardaia Tamanrasset |
09° 38’ E 02° 28’ E 08°08’ W 00°17’ W 02°15’ W 03° 49’ E 05° 31’ E |
28° 38’N 27° 12’N 27° 40’N 27° 53’N 31° 38’N 32° 23’N 22° 47’N |
562 243 402 264 806 450 1378 |
Sahara |
The following classification in obtained based on the analysis of the sites altitude:
1st Gpoup (H ≤ 100 m): Constantine, Ghardaïa, In Amenas, Mascara, Tindouf, and Tlemcen.
2nd Gpoup (100 ≤ H ˂ 400 m): Algiers, Oran, and Skikda.
3rd Gpoup (400 ≤ H ˂ 700 m): Adrar, Chlef, and In-Salah.
4th Gpoup (700 ≤ H ˂ 1000 m): Bechar, B.B Arriredj, Tebassa, and Tiaret.
5th Gpoup (H ≥ 1000 m): Djelfa, El Bayadh, Setif, and Tamanrasset.
For the studied sites, the altitude above the sea level changes between 9 m in Skikda and 1378 m in Tamanrasset.
3.1 Weibull technique
The distribution of wind velocity is usually modelled by the Weibull distribution model [24, 25]:
$f(V)=\left(\frac{k}{c}\right) \cdot\left(\frac{V}{c}\right)^{k-1} \cdot \exp \left[-\left(\frac{V}{c}\right)\right]^{k}$ (1)
for (k > 0, V > 0, c >1).
where v: wind velocity, k: shape factor, c: Weibull scale factor.
The cumulative density is:
$F(V)=\int_{0}^{\alpha} f(V) . d V=1-e^{-\left(\frac{V}{C}\right)^{k}}$ (2)
This function may be utilized to determine the time for which the wind is within a certain range of velocity (v1 and v2) [26]:
$P\left(v_{1} \prec v \prec v_{2}\right)=F\left(v_{2}\right)-F\left(v_{1}\right)$ (3)
$P\left(v_{1} \prec v \prec v_{2}\right)=\exp \left(-\left(\frac{v_{1}}{c}\right)^{k}\right)-\exp \left(-\left(\frac{v_{2}}{c}\right)^{k}\right)$ (4)
The probability for the wind exceeding Vx in its speed is [27, 28]:
$P\left(v \geq v_{x}\right)=1-\left[1-\exp \left(-\left(\frac{v_{x}}{c}\right)^{k}\right)\right]=\exp \left(-\left(\frac{v_{x}}{c}\right)^{k}\right)$ (5)
The mean wind velocity (Vm) is [27, 28]:
$V_{m}=\int_{0}^{\infty} f(V) \cdot d V=c \cdot \Gamma\left(1+\frac{1}{k}\right)$ (6)
The most frequent wind speed (VE) is [27-30]:
$V_{E}=c \cdot\left(1+\frac{2}{k}\right)^{\frac{1}{k}}$ (7)
The wind speed carrying maximum energy is [27-30]:
$V_{F}=c \cdot\left(1-\frac{1}{k}\right)^{\frac{1}{k}}$ (8)
The variance s2 of the data is [27, 30]
$\sigma^{2}=\int_{0}^{\infty}(V-\prec V \succ) \cdot f(V) \cdot d V=c^{2} \cdot\left[\left(1+\frac{2}{k}\right)-\Gamma^{2}\left(1+\frac{1}{k}\right)\right]$ (9)
The standard-deviation of s is then described as [27-30]:
Stadard deviation $=\sqrt{\text { Variance }}$ (10)
The average cubic velocity is [29, 30]:
$\left\langle V^{3}\right\rangle=\int_{0}^{\infty} V^{3} \cdot P(V) \cdot d V=c^{3} \cdot \Gamma\left(1+\frac{3}{k}\right)$ (11)
$\Gamma(x)=\int_{0}^{\infty} \exp (-t) \cdot t^{x-1} \cdot d t$ with $x>0$ (12)
3.2 Evaluation of the wind power
The power in moving air is the flow rate of kinetic energy per time [31]:
$P=\frac{E}{t}=\frac{1 / 2 . m . v^{2}}{t}$ (13)
The density of wind power (Pd) is the power per unit area [31]:
$P_{d}=\frac{P}{A}=\frac{1}{2} . \rho . v^{3}$ (14)
ρ0: air density, (1.225 kg/m3).
A: area swept by the rotor blades (A = p.R2), [m2].
Theoretically, the maximum power is [32, 33]:
$P_{e x t}=\frac{1}{2} . C_{p}(\lambda, \beta) \rho A . V^{3}$ (15)
Cp (l, β): power coefficient, which is the aerodynamic performance of the wind turbine, where Cp_max = 0.59, l the speed ratio, and β the blade pitch angle.
The density of wind power Ewdp (kwh/m2/year) is:
$E_{w d p}=3.1678 . v^{3}$ (16)
According to [34-38], the power curve of a wind turbine may be determined as:
$P(v)= \begin{cases}0 & \text { if } \quad v \prec v_{C} \\ P_{R}\left(\frac{V^{k}-V_{C}^{k}}{V_{R}^{k}-V_{C}^{k}}\right) & \text { if } \quad v_{C} \leq v \leq v_{R} \\ P_{R} & \text { if } \quad v_{R} \leq v \leq v_{F} \\ 0 & \text { if } \quad v \succ v_{F}\end{cases}$ (17)
PR: rated electrical power;
vC: the cut-in wind velocity;
vR: rated wind velocity;
vF: furling wind velocity; and
k: Weibull shape parameter.
The average power output is [29, 34, 39-41]:
$P_{\text {avrg }}=\int_{0}^{\infty} P(v) . f(v) . d v=\int_{v_{c}}^{v_{F}} P(v) . f(v) . d v$ (18)
$P_{\text {avrg }}=\int_{v_{C}}^{v_{R}} P_{R} .\left(\frac{v^{k}-v_{C}^{k}}{v_{R}^{k}-v_{C}^{k}}\right) . f(v) . d v+\int_{v_{R}}^{v_{F}} P_{R} . f(v) . d v$ (19)
$P_{a r g}=P_{R}\left(\frac{\exp \left[-\left(\frac{v_{C}}{c}\right)^{k}\right]-\exp \left[-\left(\frac{v_{R}}{c}\right)^{k}\right]}{\left(\frac{v_{C}}{c}\right)^{k}-\left(\frac{v_{R}}{c}\right)^{k}}-\exp \left[-\left(\frac{v_{F}}{c}\right)^{k}\right]\right)$ (20)
Pavrg can be expressed as:
$P_{\text {avrg }}=P_{R} . C_{F}$ (21)
where, CF is the capacity factor.
The statistical information of sites temperatures allowed the following classification:
T ˂ 16℃: Constantine, and B.B Arriredj;
16 ≤ T ≤ 21℃: Algiers, Tiaret, Tamanrasset, Skikda, Oran, Chlef, Tlemcen, Setif, El Bayadh, Djelfa, and Mascara; and
21℃ ≤ T: Tebassa, Adrar, Bechar, Ghardaïa, In Salah, In Amenas, and Tindouf.
Table 2 summarizes the calculated Weibull parameters (k, c) and different velocities Vm, V3, s2, VE, VF for various sites at 10 m height. Besides, Tables 3 and 4 present the calculated parameters at 30 m and 50 m, respectively, by using the methods of vertical extrapolation of Weibull parameters and wind.
Table 2. Details on the Weibull distribution and velocities for various sites at 10 m height
|
N° |
Sites |
k (-) |
c (m/s) |
Vm (m/s) |
<V3> (m/s)3 |
$\sigma$2 (-) |
VE (m/s) |
VF (m/s) |
|
01 02 03 04 05 06 07 08 09 10 11 12 13 14 15 16 |
Skikda Algiers Oran Tebessa Chlef Tlemcen Djelfa Tiaret El Bayadh In Amenas [4] InSalah [4] Tindouf [4] Adrar [4] Béchar [4] Ghardaia [4] Tamanrasset [4] |
1.57 2.03 1.26 1.55 1.82 2.12 1.71 1.74 1.62 1.87 1.68 1.90 2.15 1.35 1.65 1.46 |
3.30 5.00 4.10 4.10 4.50 4.70 4.40 6.30 5.30 5.40 5.80 5.40 7.20 4.80 5.60 4.00 |
2.96 4.43 3.81 3.69 4.00 4.16 3.92 5.61 4.75 4.79 5.18 4.79 6.38 4.40 5.01 3.62 |
066.30 163.62 201.34 129.98 135.17 130.25 137.50 393.80 260.86 225.84 323.21 221.61 462.23 274.11 298.97 134.72 |
11.31 13.10 34.58 18.11 14.04 10.39 15.85 31.00 26.69 18.84 28.90 18.08 23.54 37.73 28.31 20.55 |
3.36 3.62 5.88 4.26 3.75 3.22 3.98 5.57 5.17 4.34 5.38 4.25 4.85 6.14 5.32 4.53 |
5.57 7.01 8.72 7.00 6.76 6.43 6.92 9.78 8.71 7.97 9.25 7.88 9.78 9.41 9.06 7.22 |
Table 3. Details on the Weibull distribution and velocities for various sites at 30 m height
|
N° |
Sites |
k (-) |
c (m/s) |
Vm (m/s) |
<V3> (m/s)3 |
$\sigma$2 (-) |
VE (m/s) |
VF (m/s) |
|
01 02 03 04 05 06 07 08 09 10 11 12 13 14 15 16 |
Skikda Algiers Oran Tebessa Chlef Tlemcen Djelfa Tiaret El Bayadh In Amenas [4] InSalah [4] Tindouf [4] Adrar [4] Béchar [4] Ghardaia [4] Tamanrasset [4] |
1.74 2.25 1.39 1.71 2.01 2.34 1.89 1.92 1.79 2.07 1.86 2.10 2.38 1.49 1.82 1.61 |
4.40 6.41 5.36 5.36 5.83 6.06 5.71 7.90 6.76 6.87 7.33 6.87 8.92 6.18 7.10 5.24 |
3.92 5.68 4.89 4.78 5.17 5.37 5.07 7.01 6.01 6.09 6.51 6.08 7.91 5.58 6.31 4.70 |
134.16 313.58 358.15 248.56 262.04 256.89 263.64 685.51 468.19 416.19 568.54 410.43 809.00 477.96 530.89 254.62 |
15.12 16.69 42.90 23.52 18.26 13.56 20.49 37.66 33.10 23.55 35.19 22.72 28.19 46.16 34.95 26.54 |
06.83 08.50 10.18 08.43 08.22 07.89 08.37 11.46 10.28 09.52 10.85 09.45 11.53 10.94 10.67 08.65 |
2.69 4.94 2.15 3.21 4.14 4.78 3.83 5.39 4.28 4.99 4.84 5.05 7.09 2.93 4.58 2.87 |
Table 4. Details on the Weibull distribution and velocities for various sites at 50 m height
|
N° |
Sites |
k (-) |
c (m/s) |
Vm (m/s) |
<V3> (m/s)3 |
$\sigma$2 (-) |
VE (m/s) |
VF (m/s) |
|
01 02 03 04 05 06 07 08 09 10 11 12 13 14 15 16 |
Skikda Algiers Oran Tebessa Chlef Tlemcen Djelfa Tiaret El Bayadh In Amenas [4] InSalah [4] Tindouf [4] Adrar [4] Béchar [4] Ghardaia [4] Tamanrasset [4] |
1.83 2.36 1.47 1.80 2.12 2.47 1.99 2.03 1.89 2.18 1.96 2.21 2.50 1.57 1.92 1.70 |
5.04 7.21 6.08 6.08 6.58 6.83 6.46 8.79 7.58 7.70 8.19 7.70 9.86 6.96 7.94 5.95 |
4.48 6.39 5.50 5.41 5.83 6.06 5.73 7.79 6.73 6.82 7.26 6.82 8.75 6.25 7.04 5.30 |
188.58 429.89 466.92 338.16 357.41 353.86 360.28 888.97 616.74 558.41 746.34 551.82 1056.17 622.03 695.98 342.91 |
17.36 18.80 46.52 26.38 20.36 15.11 22.99 40.48 36.11 26.02 38.40 25.16 30.58 50.29 38.05 29.45 |
07.55 09.35 10.91 09.21 09.00 08.68 09.16 12.32 11.11 10.38 11.73 10.31 12.47 11.74 11.52 09.40 |
3.27 5.71 2.80 3.87 4.87 5.54 4.55 6.29 5.09 5.81 5.69 5.86 8.04 3.65 5.41 3.53 |
Table 5. Details on the annual-mean-wind-power distribution for various sites at 10, 30 and 50 m heights
|
N° |
Sites |
Groups |
P10 (w/m2) |
P30 (w/m2) |
P50 (w/m2) |
Pext10 (w/m2) |
Pext30 (w/m2) |
Pext50 (w/m2) |
Ewpd10 (kwh/m2/ year) |
Ewdp30 (kwh/m2/year) |
Ewdp50 (kwh/m2/year) |
|
01 02 03 04 05 06 07 08 09 10 11 12 13 14 15 16 |
Skikda Algiers Oran Tebessa Chlef Tlemcen Djelfa Tiaret El Bayadh In Amenas [4] InSalah [4] Tindouf [4] Adrar [4] Béchar [4] Ghardaia [4] Tamanrasset [4] |
A A B A A A A C B B C B C C C A |
040.61 100.22 123.32 079.61 082.79 079.78 084.22 241.20 159.78 138.33 197.97 135.73 283.12 167.89 183.12 082.51 |
082.17 192.07 219.36 152.25 160.50 157.34 161.48 419.88 286.77 254.92 348.23 251.39 495.52 292.75 325.17 155.95 |
115.51 263.31 285.99 207.12 218.91 216.74 220.67 544.49 377.75 342.03 457.13 337.99 646.91 380.99 426.29 210.03 |
023.96 059.13 072.76 046.97 048.85 047.07 049.69 142.31 094.27 081.61 116.80 080.08 167.04 099.06 108.04 048.68 |
048.48 113.32 129.42 089.83 094.69 092.83 095.27 247.73 169.19 150.40 205.46 148.32 292.35 172.72 191.85 092.01 |
068.15 155.35 168.73 122.20 129.16 127.88 130.20 321.25 222.88 201.80 269.71 199.41 381.67 224.79 251.51 123.92 |
0210.03 0518.31 0637.80 0411.76 0428.18 0412.61 0435.57 1247.47 0826.35 0715.42 1023.88 0702.01 1464.27 0868.34 0947.09 0426.76 |
0424.98 0993.38 1134.54 0787.41 0830.10 0813.77 0835.15 2171.58 1483.14 1318.41 1801.02 1300.18 2562.77 1514.08 1681.76 0806.59 |
0597.40 1361.82 1479.11 1071.23 1132.20 1120.98 1141.30 2816.08 1953.73 1768.94 2364.26 1748.06 3345.75 1970.47 2204.73 1086.29 |
As remarked in Tables 2-4, the yearly Weibull shape parameter k is ranging from a minimum k10 = 1.26 and k50 = 1. 47 at, respectively, 10 and 50 m of heights for the site of Oran, until maximum k10 = 2.15 and k50 = 2.50, respectively, at 10 and 50 m heights for the area of Adrar.
The yearly Weibull scale parameter is ranging from a minimum c10 = 3.30 m/s and c50 = 3.04 m/s at, respectively, 10 and 50 m heights for the site of Skikda, until a maximum c10 = 7.20 m/s and c50 = 9.86 m/s at, respectively, 10 and 50 m heights for the site of Adrar.
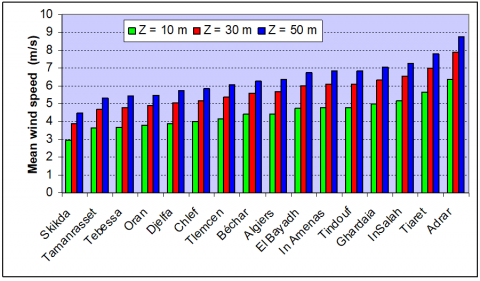
The lowest values of annual mean wind speed are found in Skikda (V10 = 2.96 m/s and V50 = 4.48 m/s), while the most significant amounts are observed in Adrar (V10 = 6.38 m/s and V50 = 8.75 m/s).
Table 5 summarizes the annual-mean-wind-power for the studied sites at 10, 30, and 50 m of height. From this table, the highest values of annual mean wind speed and the annual mean wind power density are found in Adrar (P10 = 283.12 W/m2 and P50 = 646.91 W/m2), while the lowest values are observed in Skikda (P10 = 40.61 W/m2 and P50 = 115.51 W/m2, respectively).
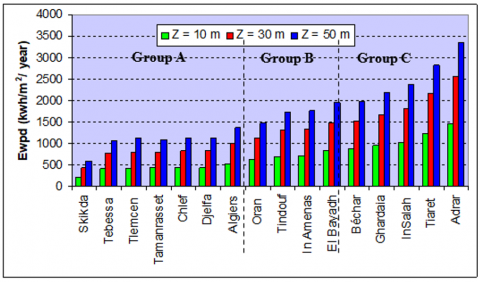
Figure 2 presents a classification of the studied Algerian sites from the lowest to the highest average wind speeds. Besides, Figure 3 shows the calculated annual wind energy for the reviewed Algerian sites and is classified into three groups.
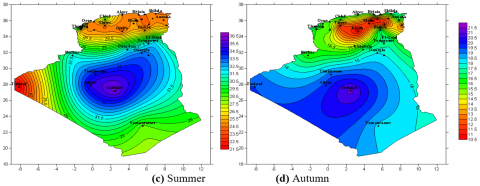
Figures 4 and 5 reveal a significant change in the seasonal average values of temperature and wind velocity, respectively, from one season to another and from a site to other.
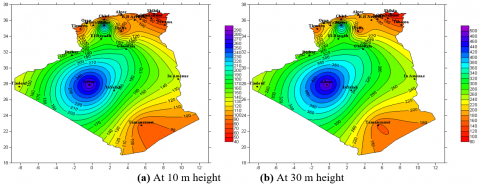
Figures 6 and 7 present the maps of the wind resource and wind power density, respectively. A global view on the resources of wind energy in Algeria is provided in these figures. Besides, the regions where a significant resource of wind may exist are clearly indicated. These maps are really useful for the users of this kind of energies.
Figure 2. Mean velocity of the wind for various sites
Figure 3. Annual wind energy for the various groups
Figures 4. Seasonal average temperature over the Algerian territory
Figure 5. Seasonal average wind speed over the Algerian territory
Figure 6. Plot of the mean velocity of wind in Algeria, Vm at 10 m of height
Figure 7. Plot of the power density of wind in Algeria, Vm at 10 m of height
The analysis of the results in Figures 6 and 7 (for example at 10 m height) allowed the following classification:
Group A, including Algiers, Skikda, Tébessa, Chlef, Tlemcen, Djelfa and Tamanrasset, with an annual wind power ranging in 40.61 ≤ P10 ≤ 100.22 W/m2. The regions of this group are suitable for installation with low power, such as the water pumping.
Group B, including, Oran, El Bayadh, In Amenas and Tindouf, with an annual wind power between 123.32 ≤ P10 ≤ 159.78 w/m2. These regions are characterized by an excellent potential of wind.
Group C, including Tiaret, In Salah, Adrar, Béchar and Ghardaïa, has annual mean specific wind power: 167.89 ≤ P10 ≤ 283.12 w/m2. This group has very good to excellent wind potential (for wind farms and electricity production).
At the height of 10 m, the shape factor k is changing from 1.26 (at Oran) to 2.15 (at Adrar). While the scale factor c is changing from 3.30 m/s (at Skikda) to 7.20 m/s (at Adrar). The most significant amounts of the annual wind velocity and power density are observed in Adrar (Vm = 6.38 m/s and P10 = 283.12 W/m2). However, the lowest amounts are observed in Skikda (Vm = 2.96 m/s and P10 = 40.61 W/m2, respectively).
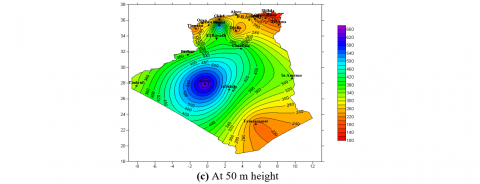
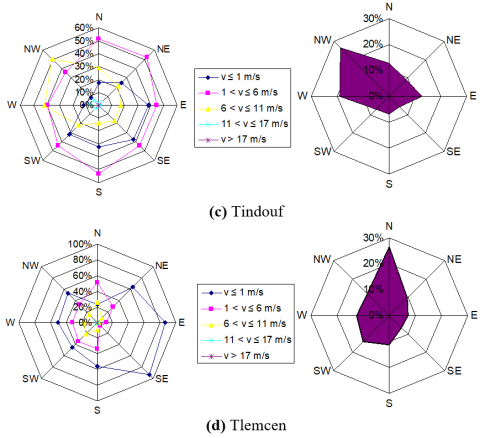
Figure 8 presents the wind rose for four sites located in different regions in Algeria.
The study of statistical information of the wind direction allowed the following classification:
Group 1 West W: Chlef, In Amenas, In Salah, Tebassa and Tiaret.
Figure 8. Charts of wind roses for various regions
Group 2 North N: El Bayadh, Skikda and Tlemcen.
Group 3 East E: Tamanrasset.
Group 4 North-West: Djelfa, Ghardaïa and Tindouf.
Group 5 North -East: Adrar and Oran.
Group 6 South-West: Algiers and Béchar.
The wind rose analysis showed that the dominant wind directions for the studied sites are the North and the West (Figure 8). Other power systems [42-51] may be inteegrated in the future.
The wind resources of sixteen Algerian sites were determined in this paper. The annual average values of wind-velocity and power density were provided for each site. The main findings are summarized as follows:
The yearly Weibull shape parameter k is ranging from a minimum k10 = 1.26 and k50 = 1. 47 at, respectively, 10 and 50 m of heights for the site of Oran, until maximum k10 = 2.15 and k50 = 2.50, respectively, at 10 and 50 m heights for the area of Adrar.
The yearly Weibull scale parameter is ranging from a minimum c10 = 3.30 m/s and c50 = 3.04 m/s at, respectively, 10 and 50 m heights for the site of Skikda, until a maximum c10 = 7.20 m/s and c50 = 9.86 m/s at, respectively, 10 and 50 m heights for the site of Adrar.
The lowest values of annual mean wind speed are found in Skikda (V10 = 2.96 m/s and V50 = 4.48 m/s), while the most significant amounts are observed in Adrar (V10 = 6.38 m/s and V50 = 8.75 m/s).
The highest values of annual mean wind speed and the annual mean wind power density are found in Adrar (P10 = 283.12 W/m2 and P50 = 646.91 W/m2), while the lowest values are observed in Skikda (P10 = 40.61 W/m2 and P50 = 115.51 W/m2, respectively).
A significant change in the seasonal average wind velocity and temperature from a season to another and a site to another.
The most dominant wind directions for the studied sites were North and the West.
The regions of group A are the suitable for wind applications with low power, like the water pumping and electricity production through small turbines. However, the regions of groups B and C are suitable for the application with high power.
[1] Himri, Y., Rehman, S., Draoui, B., Himri, S. (2008). Wind power potential assessment for three locations in Algeria. Renewable and Sustainable Energy Reviews, 12(9): 2495-2504. https://doi.org/10.1016/j.rser.2007.06.007
[2] Himri, Y., Himri, S., Stambouli, A.B. (2010). Wind power resource in the south-western region of Algeria. Renewable and Sustainable Energy Reviews, 14(1): 554-556. https://doi.org/10.1016/j.rser.2009.07.018
[3] Maouedj, R., Bousalem, S., Benyoucef, B. (2009). Etude des performances d'un système de conversion eolienne. Application au site D'Adrar. Physical & Chemical News, (45): 91-100.
[4] Maouedj, R., Bouchouicha, K., Boumediene, B. (2011). Evaluation of the wind energy potential in the Saharan sites of Algeria. In 2011 10th International Conference on Environment and Electrical Engineering, pp. 1-4. IEEE. https://doi.org/10.1109/EEEIC.2011.5874582
[5] Maouedj, R., Barbaoui, B., Benmedjahed, M., Mammeri, A., Saba, D., Ghaitaoui, T., Laribi, S. (2018). Wind energy resource assessment at three sites in the Algerian highlands. In 2018 6th International Renewable and Sustainable Energy Conference (IRSEC), pp. 1-6. https://doi.org/10.1109/IRSEC.2018.8702275
[6] Aksas, M., Gama, A. (2011). Assessment of wind and solar energy resources in Batna, Algeria. Energy Procedia, 6: 459-466. https://doi.org/10.1016/j.egypro.2011.05.053
[7] Benmedjahed, M., Maouedj, R., Mouhadjer, S. (2017). Wind potential assessment of M'sila in algerian highlands regions; modeling of wind turbine noise. Energy Procedia, 119: 642-649. https://doi.org/10.1016/j.egypro.2017.07.090
[8] Benmedjahed, M., Maouedj, R. (2019). Assessment of Acoustic impact for the wind farm in Algeria. In 2019 1st Global Power, Energy and Communication Conference (GPECOM), pp. 316-320. https://doi.org/10.1109/GPECOM.2019.8778498
[9] Benmedjahed, M., Maouedj, R. (2018). Technical and economic analysis of wind turbine system for isolated location at Adrar in Algeria. In 2018 6th International Renewable and Sustainable Energy Conference (IRSEC), pp. 1-4. https://doi.org/10.1109/IRSEC.2018.8702948
[10] Benmedjahed, M., Maouedj, R. (2018). Wind power assessment in Algeria; methods development. In 2018 International Conference on Wind Energy and Applications in Algeria (ICWEAA), pp. 1-6. https://doi.org/10.1109/ICWEAA.2018.8605049
[11] Benmedjahed, M., Maouedj, R., Mouhadjer, S., Dahbi, A., Saba, D., Toiheri, T. (2020). Wind energy source assessment for four locations in the Adrar Region (Southern Algeria). ICIST '20: Proceedings of the 10th International Conference on Information Systems and Technologies, pp. 1-6. https://doi.org/10.1145/3447568.3448535
[12] Hammouche, R. (1990). Atlas vent de l’Algérie/ONM. Algiers: Office des publications Universitaires (OPU).
[13] Merzouk, N.K. (2006). Evaluation du gisement énergétique éolien contribution à la détermination du profil vertical de la vitesse du vent en Algérie. Thèse de Doctorat. Ecole Nationale Supérieure Polytechnique.
[14] Boudia, S.M. (2013). Optimisation de l’évaluation temporelle du gisement énergétique éolien par simulation numérique et contribution à la réactualisation de l’atlas des vents en Algérie. Thèse de Doctorat. Université de Tlemcen. https://www.pnst.cerist.dz/detail.php?id=71253/.
[15] Maouedj, R., Mammeri, A., Draou, M.D., Benyoucef, B. (2014). Performance evaluation of hybrid photovoltaic-wind power systems. Energy Procedia, 50: 797-807. https://doi.org/10.1016/j.egypro.2014.06.098
[16] Benmedjahed, M., Maouedj, R., Mouhadjer, S., Menni, Y., Ameur, H., Dahbi, A., Saba, D., Touahri, T. (2021). Analysis of the wind resources in Saharan Atlas of Algeria: Adrar region as a case study. Iranian (Iranica) Journal of Energy and Environment, 12(2): 155-160. https://doi.org/10.5829/ijee.2021.12.02.08
[17] Bouzidi, B. (2011). Viability of solar or wind for water pumping systems in the Algerian Sahara regions–case study Adrar. Renewable and Sustainable Energy Reviews, 15(9): 4436-4442. https://doi.org/10.1016/j.rser.2011.07.108
[18] Maouedj, R., Mammeri, A., Draou, M.D., Benyoucef, B. (2015). Techno-economic analysis of a standalone hybrid photovoltaic-wind system. Application in electrification of a house in Adrar region. Energy Procedia, 74: 1192-1204. https://doi.org/10.1016/j.egypro.2015.07.762
[19] Maouedj, R., Benmdjahed, M., Saba, D., Mamemri, A., Barbaoui, B., Bezari, S. (2019). Experimental analysis of a stand-alone wind-photovoltaic hybrid system in the Sahara Desert. European Journal of Electrical Engineering, 21(1): 93-97. https://doi.org/10.18280/ejee.210114
[20] Bedoud, K., Ali-Rachedi, M., Lakel, R. (2016). Assessment and analysis of wind energy generation and power control of wind turbine system. Synthèse: Revue des Sciences et de la Technologie, 32: 147-162.
[21] Abderrahim, A., Boudia, M.M., Ghellai, N., Menni, Y., Ameur, H. (2020). Determination of wind potential in some regions of Algeria. Iranian (Iranica) Journal of Energy & Environment, 11(3): 193-197. https://doi.org/10.5829/ijee.2020.11.03.03
[22] Capderou, M. (1988). Atlas solaire de l'Algérie. Tome 2, Aspect Energétique. http://hdl.handle.net/123456789/124106.
[23] Merzouk, N.K. (2000). Wind energy potential of Algeria. Renewable Energy, 21(3-4): 553-562. https://doi.org/10.1016/S0960-1481(00)00090-2
[24] Darwish, A.S.K., Sayigh, A.A.M. (1988). Wind energy potential in Iraq. Journal of Wind Engineering and Industrial Aerodynamics, 27(1-3): 179-189. https://doi.org/10.1016/0167-6105(88)90034-7
[25] Chang, T.J., Wu, Y.T., Hsu, H.Y., Chu, C.R., Liao, C.M. (2003). Assessment of wind characteristics and wind turbine characteristics in Taiwan. Renewable Energy, 28(6): 851-871. https://doi.org/10.1016/S0960-1481(02)00184-2
[26] Justis, C.G. (1982). Traduit et adapté par JL Plazy, “Vent et performances des éoliennes’’, 16 édition SCM, Paris.
[27] Jamil, M., Parsa, S., Majidi, M. (1995). Wind power statistics and an evaluation of wind energy density. Renewable Energy, 6(5-6): 623-628. https://doi.org/10.1016/0960-1481(95)00041-H
[28] Elamouri, M., Amar, F.B. (2008). Wind energy potential in Tunisia. Renewable Energy, 33(4): 758-768. https://doi.org/10.1016/j.renene.2007.04.005
[29] Gary, L. (2006). Johnson Wind Energy Systems Manhattan KS.
[30] Koeppl, G. W. (1982). Putnam's Power from the Wind. New York: Van Nostrand Reinhold.
[31] Bagiorgas, H.S., Assimakopoulos, M.N., Theoharopoulos, D., Matthopoulos, D., Mihalakakou, G.K. (2007). Electricity generation using wind energy conversion systems in the area of Western Greece. Energy Conversion and Management, 48(5): 1640-1655. https://doi.org/10.1016/j.enconman.2006.11.009
[32] Petru, T., Thiringer, T. (2002). Modeling of wind turbines for power system studies. IEEE Transactions on Power Systems, 17(4): 1132-1139. https://doi.org/10.1109/TPWRS.2002.805017
[33] Muljadi, E., Pierce, K., Migliore, P. (1998). Control strategy for variable-speed, stall-regulated wind turbines. In Proceedings of the 1998 American Control Conference. ACC (IEEE Cat. No. 98CH36207), 3: 1710-1714. https://doi.org/10.1109/ACC.1998.707298
[34] Powell, W.R. (1981). An analytical expression for the average output power of a wind machine. Solar Energy, 26(1): 77-80. https://doi.org/10.1016/0038-092X(81)90114-6
[35] Chedid, R., Akiki, H., Rahman, S. (1998). A decision support technique for the design of hybrid solar-wind power systems. IEEE Transactions on Energy Conversion, 13(1): 76-83. https://doi.org/10.1109/60.658207
[36] Stevens, M.J.M., Smulders, P.T. (1979). The estimation of the parameters of the Weibull wind speed distribution for wind energy utilization purposes. Wind Engineering, 132-145. https://www.jstor.org/stable/43749134
[37] Pallabazzer, R. (2004). Previsional estimation of the energy output of windgenerators. Renewable Energy, 29(3): 413-420. https://doi.org/10.1016/S0960-1481(03)00197-6
[38] Hu, S.Y., Cheng, J.H. (2007). Performance evaluation of pairing between sites and wind turbines. Renewable Energy, 32(11): 1934-1947. https://doi.org/10.1016/j.renene.2006.07.003
[39] Nfaoui, H., Bahraui, J., Darwish, A.S., Sayigh, A.A.M. (1991). Wind energy potential in Morocco. Renewable Energy, 1(1): 1-8. https://doi.org/10.1016/0960-1481(91)90095-7
[40] El-Mallah, A., Soltan, A.M. (1989). A nomogram for estimating capacity factors of wind turbines using site and machine characteristics. Solar & Wind Technology, 6(5): 633-635. https://doi.org/10.1016/0741-983X(89)90103-3
[41] Torres, J.L., Prieto, E., Garcia, A., De Blas, M., Ramirez, F., De Francisco, A. (2003). Effects of the model selected for the power curve on the site effectiveness and the capacity factor of a pitch regulated wind turbine. Solar Energy, 74(2): 93-102. https://doi.org/10.1016/S0038-092X(03)00144-0
[42] Alawee, W.H., Al-Sumaily, G.F., Dhahad, H.A., Thompson, M.C. (2021). Numerical analysis of non-Darcian mixed convection flows in a ventilated enclosure filled with a fluid-saturated porous medium. Thermal Science and Engineering Progress, 24: 100922. https://doi.org/10.1016/j.tsep.2021.100922
[43] Xiong, P.Y., Almarashi, A., Dhahad, H.A., Alawee, W.H., Abusorrah, A.M., Issakhov, A., Abu-Hamdeh, N.H., Shafee, A., Chu, Y.M. (2021). Nanomaterial transportation and exergy loss modeling incorporating CVFEM. Journal of Molecular Liquids, 330: 115591. https://doi.org/10.1016/j.molliq.2021.115591
[44] Essa, F.A., Alawee, W.H., Mohammed, S.A., Abdullah, A.S., Omara, Z.M. (2021). Enhancement of pyramid solar distiller performance using reflectors, cooling cycle, and dangled cords of wicks. Desalination, 506: 115019. https://doi.org/10.1016/j.desal.2021.115019
[45] Yao, S.W., Alawee, W.H., Dhahad, H.A., Issakhov, A., Bui, X.V. (2021). Convective transportation of ferrofluid through a chamber. Applied Nanoscience, 1-13. https://doi.org/10.1007/s13204-021-01728-4
[46] Rihan, A.A., Mohamed, T.A., Alawee, W.H. (2021). Physical simulation for the flow in straight and rectangular loop manifolds. Journal of Engineering, 27(3): 15-32. https://doi.org/10.31026/j.eng.2021.03.02
[47] Li, J., Alawee, W.H., Rawa, M.J., Dhahad, H.A., Chu, Y.M., Issakhov, A., Abu-Hamdeh, N.H., Hajizadeh, M.R. (2021). Heat recovery application of nanomaterial with existence of turbulator. Journal of Molecular Liquids, 326: 115268. https://doi.org/10.1016/j.molliq.2020.115268
[48] Ghadhban, S.A., Alawee, W.H., Dhahad, H.A. (2021). Study effects of bio-inspired flow filed design on Polymer Electrolyte Membrane fuel cell performance. Case Studies in Thermal Engineering, 24: 100841. https://doi.org/10.1016/j.csite.2021.100841
[49] Alawee, W.H., Mohammed, S.A., Dhahad, H.A., Abdullah, A.S., Omara, Z.M., Essa, F.A. (2021). Improving the performance of pyramid solar still using rotating four cylinders and three electric heaters. Process Safety and Environmental Protection, 148: 950-958. https://doi.org/10.1016/j.psep.2021.02.022
[50] Xiong, P.Y., Almarashi, A., Dhahad, H.A., Alawee, W.H., Issakhov, A., Chu, Y.M. (2021). Nanoparticles for phase change process of water utilizing FEM. Journal of Molecular Liquids, 334: 116096. https://doi.org/10.1016/j.molliq.2021.116096
[51] Ge-JiLe, H., Alawee, W.H., Dara, R.N., Issakhov, A., Selim, M.M., Hajizadeh, M.R. (2021). Influence of Lorentz and permeability on migration of nanoparticle. International Journal of Modern Physics C. https://doi.org/10.1142/S0129183121501047