Muhammad Hermansyah* | Imam Santoso | Susinggih Wijana | Sucipto | Ahmad Fudholi
© 2021 IIETA. This article is published by IIETA and is licensed under the CC BY 4.0 license (http://creativecommons.org/licenses/by/4.0/).
OPEN ACCESS
The improvement of tapioca production system is one of the solutions to improve the economy of rural communities through the development of cassava inventory as an inexpensive tapioca raw material that can be obtained throughout the year, using appropriate management and strategies. This study aims to determine the order of priority criteria that are influential in determining the steps to improve production system performance. The method used is analysis PLS using six criteria, namely local potential, empowerment capital, social community, empowerment process, community empowerment, the ability of actors. The empirical results of the study show that the highest R-square value is the empowerment process at 61.0 percent. This value indicates that local potential, empowerment capital, social community, and the ability of the actors are able to contribute to the explanation of the empowerment process by 61.1 percent, while 38.9 percent is influenced by other variables. The R-square value on the community empowerment variable is lower than the R-square value for the empowerment process, which is only 42.4 percent. This shows that the variables of local potential, empowerment capital, social community, the ability of empowerment actors, and the empowerment process do not adequately explain community empowerment. From the results of the exploration of the overall influence factors with the PLS analysis mentioned above, it is used to invite people to understand themselves and formulate ideas for developing Gaplek SMEs in the form of a vision with a strategy for achieving them. Based on the empirical results of research through testing the accepted hypothesis with the intervening variable having a significant positive relationship, appropriate mentoring is carried out to focus on the mentoring process with the Participatory Rural Appraisal approach.
Gaplek SMEs, facilitation, PRA, PLS
Cassava products as raw material for tapioca are very much needed by many companies, the potential for cassava as a processed product for the majority of rural communities is not well managed and even tends to ignore standard operating procedures in the production process, even though if processed properly, let alone use environmentally friendly production processes and good principles production [1]. The environmentally friendly production process should also become a model for long-term business implementation, especially if the performance and development strategy can be improved by prioritizing the criteria for proper business empowerment as a community effort [2]. Traditional business performance that is managed in an appropriate and measurable manner can support efforts to achieve targets for individual and corporate business development.
Pasuruan Regency has several flour processing companies such as PT Kappa Carrangeenan Nusantara located in Kejayan, PT Wonokoyo Confeedmil Corporindo, PT Cargil, PT Agro Mulia and many other small companies that also use cassava raw materials. The average raw material requirement for cassava raw materials per company is 10-20 tons per day, which can reach 2000 tons per day and 60,000 tons per month. The high demand for cassava in Pasuruan is a separate opportunity for the cassava producer community, people need to be made aware that cassava has a large enough market share, even though some people do not know the economic improvement strategy of the potential of cassava due to the lack of available information and the difficulty of finding reliable cassava collectors [2].
Improvement of the tapioca production system of the village community's business is one of the efforts to improve the economy through the strategy of developing the UKM Gaplek as a business opportunity for farmers and rural communities who process cassava plantation products [3]. However, currently there is no support for these efforts, community businesses still rely on the old traditional model and minimal support from various parties including local governments [1]. Even though the need for improvement in the production system is very important in order to achieve productivity, consumer satisfaction, preserved natural resources and assisted human needs, but if the repair process is not carried out, it will have an impact on the reluctance of the business community in business development and end in the bankruptcy of the business community [4]. This need requires technical conditioning through improved production systems and government support as relevant support for business development through regulation and integrated government planning, such as medium-term development plans and government development work plans [5].
This development requires performance that is supported by all parties and if it is not carried out then within a certain period it will have an impact on the stagnation of the tapioca producing business community and its derivatives, so that tapioca companies will always depend on other areas or even continuous imports which are feared by the implementation of village strengthening through SMEs will never be achieved [6]. For this reason, research is needed that is able to provide concrete choices for cassava chips in an orderly and calculative manner to maintain their existence with the support of the government and the business world. Research based on empirical results of empowerment that is integrated with government policies, to support this effort, strategic steps are needed that can support the objectives of these development efforts [7]. This effort is based on empowerment criteria by calculating the attributes and alternative decisions that will be used to identify ways to increase the efficiency and effectiveness of development strategies through structuring the Gaplek SMEs in an integrated manner with regular government programs, so that it can be used as a business development model such as the Gaplek SMEs in Pasuruan [8].
The development of cassava SMEs through improving the tapioca production system requires precise measurement of product design, market acceptance, understanding competitors, when to invest, how to strategy and institutionalize it. The development of Gaplek SMEs requires steps and courage in making measured and precise decisions to achieve their development goals, so a narrative of patterns and stages of proper decision making is needed, along with criteria, elements in the hierarchy of business development [2]. The results of the decision-making hierarchy criteria are then elaborated through assessing and comparing between elements to get the desired priority as part of the planned development strategy [9].
Business development is usually designed by photographing conditions and problems in a comprehensive manner, especially those related to potential interests and zoning, this is related to the collective work process as well as empowerment activities by paying attention to every factor that influences it [9]. Formulate every factor that is used as the basis for the formation of market potential or as a center for Gaplek SMEs, including the main problem that actually occurs. The main aspect that becomes the focus of attention is identifying and mapping potential locations and efforts will be made to lead to the development of Gaplek SMEs. Identification and mapping of the projected interactions are then continued by prioritizing existing problems to find out the important factors that are key in the development plan and how the development strategy is implemented with the right empowerment model [10]. The development strategy of the Gaplek SMEs is carried out by paying attention to the variables and problems that arise and then they are examined to become empowerment variables.
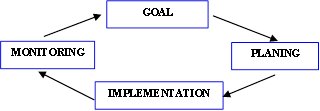
Empowerment of Gaplek SMEs in Pasuruan is not enough with the institutionalization of its business through a kind of SMEs Center, but it needs structuring which in its implementation requires the involvement of community empowerment workers with opportunities for successful development of Gaplek SMEs through the potential for integration of sustainable government programs such as regular development planning [2]. The community needs to be facilitated with easier distribution access with the empowerment of Gaplek SMEs and the establishment of a Gaplek SMEs Center and the provision of capital loans for Gaplek SMEs with low interest rates and in line with government planning. The technique used with several plans resulted from extracting ideas from the community through mapping and social analysis which was followed by the implementation of facilitation of activities agreed upon by the village apparatus and community using the Participatory Rural Appraisal (PRA) approach assistance model which in its implementation carries the concept of planning, to help understand it, there is no mistake to remember the planning cycle as in Figure 1 [10]:
Figure 1. Planning cycle for the development of gaplek SMEs
Understanding the planning cycle, namely as a planning goal and planning tool, the cycle explanation will place the planning activities as follows: a) The welfare of the Gaplek SMEs community through the SMEs Center as a Goal. b) Method of Institutionalizing Gaplek SMEs as Planning. c) Implementation of data collection, mapping, social analysis through PRA and other supporters until the final recommendation as Implementation. d) Measuring and evaluating the results of the implementation of data collection, mapping and social analysis through PRA until the final recommendation for improvement as Monitoring.
The institutionalization of the Gaplek SMEs as a planning tool, the cycle explanation places the planning activities as follows: 1) The goal of developing the Gaplek SMEs as a goal. 2) The strategy for developing the SMEs Gaplek Center is recommended as a Planning. 3) Implementation of development as Implementation. 4) Measuring and evaluating the results of the implementation of development in accordance with development objectives as monitoring. Based on the underlying factors, it takes local potential, empowerment capital, social community, the ability of empowerment actors, the empowerment process and community empowerment. These six factors are the basis for community development, this requires a model specification, namely by designing the outer model, creating a measurement model whose function is to define how each indicator block relates to its latent variables. Designing the inner model, creating a structural model whose function is to connect between latent variables [11]. Furthermore, a Path diagram is made from modeling, namely compiling a structural model by connecting endogenous latent variables and exogenous variables, and compiling a measurement model by connecting indicators and latent variables [11].
Convert the path diagram into a specific equation, so that it can be seen what the value of the influence is between the latent variable and the indicator. After the model is completely specified into the equation, the next step is to estimate the parameters of the endogenous variable (y) and the exogenous variable (x) because this study will examine the relationship between latent variables in PLS operation, and test the relationship between the variables, among others [12]: 1) Significance test Outer weight functions to see the most dominant influence of the relationship between indicators and latent variables (local potential, empowerment capital, social community, the ability of empowerment actors, the empowerment process and community empowerment) by creating a value score for these latent variables based on weight from the indicator which has been compared with other indicators. 2) The outer loading significance test, its function is to see the most dominant relationship based on the value of the path diagram between indicators and latent variables (local potential, empowerment capital, social community, the ability of empowerment actors, the empowerment process and community empowerment).
After testing the relationship between the variables, the evaluation of the Goodness of Fit Criteria is carried out as follows: a) Evaluation of the Reflexive Measurement Model (Outer model), which is carried out in this model aims to measure the score assessed based on the correlation calculated with a covergent validity greater than 0.50, the indicator has a high correlation [13], discriminant validity is greater than 0.50, so the latent variable has become a good comparison for the model [11], and composite reliability as a measure used for latent variables in the reflexive indicator model with an AVE value of more than 0.60 [14]. b) Evaluation of the Structual Measurement Model (Inner model), in this model its function is to see the significance value of latent variables using the R-square (R2). After knowing the value of R2, to see the predictive size of endogenous latent variables with reflexive indicators, the Q-square (Q2) is used [15].
After the evaluation, the statistical hypothesis testing in PLS analysis is used with the bootstrapping method, the function of the bootstrapping method is to take samples from each indicator, the data taken is the average data whose value is not far from the initial data [14]. The results of the PLS modeling are used to invite people to understand themselves and formulate ideas for developing Gaplek SMEs in the form of a strategy to achieve them through a PRA process [10].
Based on the tools and plans that are in the process, the identification of added value increases is carried out to determine the benefits of the potential used in the development of Gaplek SMEs. The highest added value increase is seen if local potential, empowerment capital, social community, empowerment processes, community empowerment, the ability of community empowerment actors by inviting the community to understand themselves and formulating ideas for developing Gaplek SMEs in the form of a vision with achievement strategies as the goals of planning and planning tools, this requires testing the validity and reliability as a research instrument as follows:
3.1 Validity test results
Testing the research instrument from the validity test, the results show that all research instruments have a value that meets the requirements where the significance value of r is smaller than r count (0.05) and the correlation value is more than 0.5 [16]. The validity value of the highest local potential variable (X1) with a score of 0.875, the highest empowerment capital variable (X2) with a score of 0.947, the highest community social variable (X3) with a score of 0.956, the highest empowerment process variable (X4) with a score of 0.871, the community empowerment variable (X5) with the highest score of 0.895, the variable of the empowerment actor's ability (Y1) with the highest score of 0.847. From the results of the validity test, the lowest result is the result of each statement item whose accuracy level is not good, but can still be used as a data collection tool.
3.2 Reliability test results
Testing the research instruments in terms of reliability, the results showed that all the research instruments used were reliable, provided that the alpha croanbach value was greater than 0.6 [17]. In Table 1 all variables already have a croanbach alpha value greater than 0.6, which means that the reliability test is carried out to test the extent to which the measurement provides stable results when re-measured. Reliability testing is needed for matters relating to social psychology such as attitudes, behaviors and trends in answering a research questionnaire [18].
Table 1. Reliability calculation test results
|
Variable |
Number of Item |
α |
Description |
|
Local Potential (PL) Empowerment Capital (MP) Social Society (SM) The Empowerment Process (PP) Community Empowerment (KB) Perpetrator Ability (KP) |
6 6 5 7 5 5 |
0.808 0.817 0.840 0.795 0.879 0.865 |
Reliable Reliable Reliable Reliable Reliable Reliable |
Source: Data Analysis Results
Furthermore, the analysis used in the community empowerment model with the PRA model took samples in the area of cassava processing assistance through testing the structural equation model using Partial Least Square (PLS) software. This test takes into account the validity and reliability of the data which is carried out by means of convergent and discriminant validity. Convergent validity can be assessed by looking at the reliability of the indicator, composite reliability, and average variance extracted. Meanwhile, discriminant validity is by comparing the root value of the Average Variance Extracted (AVE) of each construct with other correlations.
Based on the results of the analysis, it can be concluded that all the constructs in this study, namely local potential, empowerment capital, social community, the ability of empowerment actors, the empowerment process and community empowerment have a root AVE value greater than the correlation between constructs, which means that all constructs are in the estimated model. meet the criteria for discriminant validity. The indicators used through the questionnaire are more detailed with a loading factor for each indicator of the construct of local potential, empowerment capital, social community, the ability of actors, the empowerment process and community empowerment.
Outer model is often called (outer relation or measurement model) defines how each indicator block relates to its construct. The inner model was evaluated using the R-square, t test, and the significance of the structural path parameter coefficients. Outer Model with reflective indicators is evaluated by convergent and discriminant validity of the indicators and composite reliability for block indicators. The size of the reliability indicator is good if the value is greater than 0.70, while the loading factor of 0.50 to 0.60 can still be maintained for a model that is in the development stage with a loading factor above 0.60 which is expected to produce a more fit model.
Based on this potential, indicators that have a loading factor smaller than 0.60 and are not significant are excluded from the analysis. The number of initial indicators proposed is 24 indicators, but after testing convergent validity I, there are 16 representative indicators and eight indicators are not representative, the model is re-estimated by removing eight indicators that are not representative. The result of convergent validity II test shows that there is still 1 indicator whose code is below 0.60 and there are 15 indicators that are above 0.60. The use of 15 representative indicators in the convergent validity II test was re-estimated, so that the results of convergent validity III were obtained which indicated that the 15 indicators were valid, because all of them had a statistically significant t value at p <0.05 with a loading factor above 0.60. After testing convergent validity I, II and III, the test results show no loading factor value that is smaller than 0.60.
From testing convergent validity 1 to 3, it can be concluded that in essence the indicators for each construct on convergent validity are all significant, because they have a statistical t value greater than 1.96 and a loading factor greater than 0.60. This shows that the constructs of local potential, empowerment capital, community social, the ability of empowerment actors, the empowerment process and community empowerment are valid. The results of this study are that to improve community empowerment can be achieved through steps taken by each variable:
Local potential variables in this study are manifested in the form of indicators of production media, educational media, health media, economic media, communication media, and transportation media. The results of the Confirmatory factor analysis test show that there is only one indicator that is significant and has a loading factor of more than 0.60, namely the educational media indicator (PLB), while other indicators have a loading factor below 0.60. Confirmatory analysis of local potential shows that educational media is a representative measure of local potential.
The variable of empowerment capital in this study was originally measured by three indicators, namely the level of creativity (MPA), level of education (MPB), and ability to innovate (MPC). This indicator variable refers to the theory which explains that empowerment capital can be increased through the level of creativity, education and the ability to innovate. The test results of confirmatory factor analysis show that two indicators are significant at p <0.005, but there is one indicator that has a loading factor of less than 0.60, namely the education level indicator (MPB), while the indicator that has a loading factor above 0.60 there are two indicators. Namely the level of creativity (MPA) and ability to innovate (MPC). Indicators of the level of creativity and the ability to innovate are valid measures of empowerment capital.
The social variables in this study were initially measured by 5 indicators, namely the level of social / work networks, mutual trust, obedience to norms, concern for others, and involvement in social organization activities. This indicator variable refers to previous research which states that social society includes trust, network existence, ease of cooperation, and also includes goodwill [19]. After testing the confirmatory factor analysis, all indicators are significant at p <0.005 and show that there are two indicators that have a loading factor of less than 0.60, namely proactive indicators (SMB) and new business creation (SME). Whereas those who have a loading factor above 0.60, there are three indicators, namely social / work networks (SMA), obedience to norms (SMC) and concern for others (SMD), this indicates that the community already has a social/work network and in activities-the activity is very concerned about norms and concern for others.
Indicator variables that measure the ability of empowerment actors were originally proposed by three indicators, namely the level of knowledge / cognitive, attitude / affective, and level of skills / psychomotor. Measuring the ability of empowerment actors refers to previous research conducted by Tjokrowinoto [20] which emphasizes abilities that are considered relevant to the quality of empowerment actors. The integrated capacity of empowerment actors in increasing development success must be accompanied by a strong commitment. The success of empowerment actors can be realized through increasing active community participation. The results of the confirmatory factor analysis test show that there are three indicators that have a loading factor of less than 0.60, confirmatory analysis of the constructs of the empowerment actors' abilities states that increased knowledge / cognitive and skills / psychomotor abilities are representative indicators to measure the ability of empowerment actors. This means that the efforts of the actors' ability to create empowerment can be achieved, if the community can increase their level of knowledge so that they can strengthen their ability to carry out development in expanding social / work networks that can produce community empowerment.
Empowerment Process, there are four indicator variables that measure the empowerment process, namely problem analysis (PPA), planning (PPB), implementation (PPC) and evaluation (PPD). The test results of confirmatory factor analysis show that all indicators have a statistically significant value and have a loading factor of more than 0.60. The indicator variable that gives the biggest contribution in explaining the empowerment process is the evaluation indicator. The indicator variable that gives the second contribution in explaining the empowerment process is the implementation indicator variable. Meanwhile, the indicator variable that contributed to the last ranking was the problem analysis variable. Confirmatory analysis of the empowerment process construct states that these four indicators are representative indicators to measure the empowerment process.
The community empowerment variable in this study was originally measured by three indicators, namely the level of community decisions, the level of independence, and the ability to utilize business for the future. After testing the confirmatory factor analysis, all indicators are significant at p <0.005 and indicate that all indicators have a loading factor above 0.60. This indicates that the community already has the ability to make decisions that lead to the independence of the community who can take advantage of the business for the future. When the level of community independence increases, it is possible to strengthen the culture in increasing the desire to increase the opportunity to take advantage of opportunities that lead to optimizing community participation for the purpose of joint development to achieve prosperity.
Confirmatory analysis of the community empowerment construct states the ability to make decisions, independence, and the ability to use business for the future are representative indicators to measure community empowerment. The results of hypothesis testing with Partial Least Square on the research model which is the structural equation of hypothesis 1 to hypothesis 12 can be explained in Table 2.
Table 2. Test results
|
Indikator |
Path |
t- |
Information |
|
Cooef |
Score |
||
|
Local Potential |
|
|
|
|
Empowerment Capital |
0.345 |
2.574 |
*Received |
|
Social Society |
|
|
|
|
Local Potential |
0.262 |
2.078 |
*Received |
|
Empowerment Capital |
0.434 |
3.2/ 3 |
*Received |
|
The empowerment process |
|
|
|
|
Local Potential |
0.007 |
0.064 |
*Not accepted |
|
Empowerment Capital |
0.295 |
2.258 |
*Received |
|
Social Society |
0.148 |
1.163 |
*Not accepted |
|
Perpetrator Abilities |
0.506 |
4.458 |
*Received |
|
Community empowerment |
|
|
|
|
Local Potential |
0.188 |
1.326 |
*Not accepted |
|
Empowerment Capital |
0.070 |
0.484 |
*Not accepted |
|
Social Society |
0.083 |
0.669 |
*Not accepted |
|
The empowerment process |
0.503 |
3.044 |
*Received |
|
Perpetrator Abilities |
-0.053 |
0.258 |
*Not accepted |
Source: Data Analysis Results
These results mean that there are main steps that can be taken in order to increase community empowerment:
First is local potential. To be able to increase empowerment, local potential development must be done. The role of local potential is expected to change the quality of humans to be more creative in increasing their ability to innovate. Communities can take advantage of future businesses if they carry out an analysis related to seizing business opportunities with an emphasis on the importance of expanding social networks.
Second is the development of empowerment capital. The role of empowerment capital becomes the basis for developing empowerment and becomes a mediation for increasing community empowerment from local potential. Therefore, improving the quality of the community from local potential is a prerequisite for increasing creativity and innovation. The community will be more optimal in developing empowerment if it is supported by a process of improving the quality of its human beings. The role of the empowerment actor will increase the competence of both knowledge and expertise to be able to determine the implementation of activities in creating a competitive society.
The third is development of empowerment. To create an empowered society, apart from being determined by the ability to conduct evaluation and planning, it is also determined by the ability to innovate. Openness between communities will facilitate access to information that is important in making innovations that are different from others, so as to create excellence. The need to appreciate innovation and new ideas in society, as a driving factor for taking risks that aim to increase excellence in the business sector. To assess the inner model or structural model, which is to see the relationship between constructs, one indicator of the path model's predictive strength is to test the Rsquare value for endogenous constructs. R-square is used to assess the dependent construct in the structural model. R-square is interpreted the same as multiple regression analysis indicating the amount of variance in the construct described by the path model [21]. The results of the evaluation of the structural model using the R-square are as shown in Table 3.
Table 3. Value of R-square
|
Variable |
R-Square |
|
Local Potential |
|
|
Empowerment Capital |
0.089 |
|
Social Society |
0.444 |
|
Perpetrator Abilities |
|
|
The Empowerment Process |
0.610 |
|
Community Empowerment |
0.24 |
Sumber: Hasil Analisis Data
The empirical results of the study show that the highest R-square value is the empowerment process at 61.0 percent. This value indicates that local potential, empowerment capital, social community, and the ability of the actors are able to contribute to the explanation of the empowerment process by 61.1 percent, while 38.9 percent is influenced by other variables. Meanwhile, the R-square on the community empowerment variable is lower than the R-square for the empowerment process, which is only 42.4 percent. This shows that the five variables, namely local potential, empowerment capital, community social, the ability of empowerment actors, and the empowerment process do not adequately explain community empowerment.
3.3 Hypothesis testing
The significance of the estimated parameters provides very useful information about the relationship between the research variables. The basis used in testing the hypothesis is the value contained in the output result for inner weight. Table 4 provides the estimated output for structural model testing.
Table 4. Inner weights result
|
|
Original Sample Estimate (O) |
Mean of Subsamples (M) |
Standard Deviation (STEDEV) |
T-Statistics (|O/STERR|) |
|
KP -> PP |
0.521 |
0.550 |
0.099 |
5.263* |
|
PP -> MP |
0.445 |
0.502 |
0.126 |
3.523* |
|
MP -> KM |
0.613 |
0.670 |
0.128 |
4.778* |
|
KP -> MP |
0.287 |
0.252 |
0.186 |
1.541 |
|
KP -> KM |
0.083 |
0.040 |
0.171 |
0.485 |
In PLS, statistical testing of each hypothesized relationship is carried out using a simulation. In this case the bootstrap method is carried out on the sample. Bootstrapping testing is also intended to minimize the problem of abnormal research data. The test results with bootstrapping from the PLS analysis are as follows:
Testing Hypothesis 1 (Actor's Ability has a direct and positive relationship with Empowerment Capital), the results of testing the first hypothesis show that the relationship between the variable of actor ability (KP) and empowerment capital (MP) shows a path coefficient value of 0.521 with a t value of 5.263. This value is greater than t table (1,960). This result means that the actor's ability has a positive and significant relationship to empowerment capital, which means that it is in accordance with the first hypothesis where the actor's ability encourages commitment to empowerment capital. This means that hypothesis 1 is accepted.
Testing Hypothesis 2 (Empowerment capital is directly and positively related to the Empowerment Process), the results of testing the second hypothesis show that the relationship between the variable empowerment capital (MP) and the empowerment process (PP) shows a path coefficient value of 0.445 with a t value of 3.523. This value is greater than t table (1,960). This result means that empowerment capital has a positive and significant relationship to the empowerment process which means that it is in accordance with the second hypothesis where empowerment capital encourages the empowerment process. This means that hypothesis 2 is accepted.
Testing Hypothesis 3 (The process of empowerment is directly and positively related to community empowerment), the results of testing the third hypothesis show that the relationship between the empowerment process variable (PP) and community empowerment (KM) shows a path coefficient value of 0.613 with a t value of 4.778. This value is greater than t table (1,960). This result means that the empowerment process has a positive and significant relationship to community empowerment attitudes, meaning that it is in accordance with the third hypothesis where the empowerment process encourages community empowerment. This means that hypothesis 3 is accepted.
Testing Hypothesis 4 (Actor's Ability is directly and positively related to the Empowerment Process), the results of testing the fourth hypothesis indicate that the relationship between the variable of the actor's ability (KP) and the empowerment process (PP) shows a path coefficient value of 0.287 with a t value of 1.541. This value is smaller than t table (1,960). This result means that the actor's ability has a positive but insignificant relationship to the empowerment process, which means that it is not in accordance with the fourth hypothesis where the actor's ability directly encourages the empowerment process. This means that hypothesis 4 is rejected.
Testing Hypothesis 5 (Actor's Ability is directly and positively related to Community Empowerment), the results of testing the fifth hypothesis show that the relationship between the variable of the actor's ability (KP) and the attitude of community empowerment (KM) shows a path coefficient value of 0.083 with a t value of 0.485. This value is smaller than t table (1,960). This result means that the actor's ability has a positive but insignificant relationship to community empowerment, which means that it is not in accordance with the fifth hypothesis where the actor's ability directly encourages community empowerment. This means that Hypothesis 5 is rejected.
Testing Hypothesis 6 (Actor's Ability is positively related to the Empowerment Process through Community Empowerment and Social Capital), testing the sixth hypothesis to test the indirect effect of the actor's ability on the empowerment process through community empowerment and social capital is carried out by first knowing the test results on the influence empowerment and social capital of the community towards the empowerment process. Testing the effect of mediation is carried out using the Sobel formula. The results of testing the effect of empowerment and social capital on the empowerment process show the path coefficient value of 0.445. The t value is 3.523. This value is greater than t table (1,960). This result means that community empowerment and social capital have a significant positive effect on the empowerment process. Testing of the effect of the mediation between the intervening variables and the dependent variable is done by calculating the Sobel formula. The results of the two tests are summarized with the result of the t test value = 2.924. The t test value of 2.924 is greater than 1.96, which means that the mediation parameter is significant. Thus, the model of the indirect effect of the variable of the actor's ability on the empowerment process through empowerment and social capital can be accepted. This means that hypothesis 6 is accepted.
Testing Hypothesis 7 (Actor's Ability is positively related to Community Empowerment through Empowerment Capital, Community Social and the Empowerment Process). The seventh hypothesis testing is done by looking at the influence of the empowerment process (PP) on community empowerment (KM). Testing Hypothesis 7 was firstly carried out by looking at the results of testing the effect of the empowerment process on attitudes towards community empowerment. The results of testing the effect of the empowerment process on community empowerment obtained a path coefficient of 0.613 with a t test value of 4.778. This value is greater than 1.96. Thus it is found that the empowerment process has a significant effect on community empowerment. By re-applying the Sobel formula in testing the effect of mediation on empowerment capital (MP) and the empowerment process (PP) as a mediation for the effect of the ability of actors (KP) on community empowerment (KM), the results of the test value t = 2.473. The t value of 2.473 is greater than 1.96, which means that the mediation parameter is significantly positive. Thus, the effect of the actor's ability on community empowerment with empowerment capital, community social and the empowerment process as an intervening variable has a significant positive relationship, hypothesis 7 is accepted
3.4 Implementation of participatory rural appraisal
From the results of the exploration of the overall influence factors with the PLS analysis mentioned above, it is used to invite the public to understand themselves and to formulate ideas for developing Gaplek SMEs in the form of a vision with a strategy for their achievement. Based on the highest empirical results of research, the assistance that is carried out focuses on the mentoring process with the PRA approach as follows [22]: a) Coordination with apparatus, community leaders, religious leaders, village youth leaders for the implementation of the Gaplek SMEs development program. b) Village government coordination, both administratively and in the field. c) Drafting of village community social mapping assistance. d) Drafting of village community social analysis assistance. e) Making a draft of the results of the results of the village social analysis. f) Drafting assistance for the discussion of the Gaplek SMEs development program. g) Drafting capacity building training, encouraging strengthening and institutionalization. h) The drafting of the RKTL for mentoring to be implemented in Gaplek SMEs. i) Facilitating community capacity building activities and encouraging the institutionalization of training results.
The implementation of participatory mentoring activities through the stages of preparation, implementation of field activities and monitoring evaluation with the Participatory Rural Appraisal (PRA) approach is translated into inseparable parts through [23]: a) Preparation includes an exploratory visit (survey) to determine the location and identify strategic developments Gaplek SMEs. This data collection and mapping is carried out through data collection of all Gaplek SMEs that have the potential to be targeted. After the data collection has been carried out, it is continued by making a potential map as a work basis, mapped based on agreed indicators, usually indicators are used with a description of the number and distribution according to their conditions. Furthermore, a social analysis is carried out by taking into account the results of the mapping that has been carried out using a SWOT analysis according to the needs of the development program. b) The implementation of field activities by developing basic functions such as village communities and Islamic boarding schools also receive the same portion in expanding community businesses, facilitating coordination among stakeholders, so that they are able to achieve the targets set. The implementation of this activity includes three stages as follows:
Phase 1: Activity of Establishing a Cassava SMEs Center, this stage begins after an approach to the business community to be able to explore ideas and potentials, including a basis for building commitment in garnering support and facilitation for the development of Gaplek SMEs. Furthermore, in collaboration and self-help, data collection activities are carried out for problem identification, potential inventory and targeting through the process of monitoring ideas that are running regularly in the village through the Village Medium Term Development Plan (RPJMDesa) and the Village Development Work Plan (RKPDesa). The results of data collection and exploration of SME development ideas for these target conditions are mapped according to the description above and finalized through agreement on village proposals in the Village Development Planning Consultation workshop (Musrenbang Desa), primarily the priority targets of the analysis results. In the workshop, the committee was appointed as well, a work plan and program was drawn up. It was hoped that it could be completed until at the final stage the team prepared an activity report.
Phase 2: Coaching activities for the Gaplek SMEs Center, the stage of coaching by implementing an activity plan, mainly starting with an economic activity plan to invite the community to develop businesses in mutual cooperation or joint ventures. In accordance with the results of the mapping and social analysis of SMEs, conduct training activities by continuing to form groups and participate in activities. The SMEs development team began to invite experts, especially trainers from related agencies and began looking for sources of funding for the activities of its members in the economic sector.
Phase 3: Development of the Gaplek SMEs Center, in this stage the SMEs Development Team invites its members to identify the potential that has been implemented to then follow up with village assistance and facilitation. If the program that has been designed cannot be completed properly, then the program can be continued by the SME development team who performs service to SME regularly in turn according to the agreed programming commitments. c) Monitoring and Evaluation is carried out during field operational activities. In stage 1 with the implementation of data collection, preparation for workshops and preparation of plans after carrying out social mapping and analysis of assisted village SMEs, stage 2 with assistance in implementing activities and stage 3 with facilitation to assess Team Performance, including participation in work implementation, built communication with officials and the community village, community self-help, cooperation and mutual assistance.
The empirical results of the study show that the highest R-square value is the empowerment process at 61.0 percent. This value indicates that local potential, empowerment capital, social community, and the ability of the actors are able to contribute to the explanation of the empowerment process by 61.1 percent, while 38.9 percent is influenced by other variables. The R-square value on the community empowerment variable is lower than the R-square value for the empowerment process, which is only 42.4 percent. This shows that the variables of local potential, empowerment capital, social community, the ability of empowerment actors, and the empowerment process do not adequately explain community empowerment. The results of the exploration of all influencing factors with the PLS analysis above are used to invite the public to understand themselves and to formulate ideas for developing Gaplek SMEs in the form of a vision with a strategy of achieving it.
[1] Hermansyah, M., Pratikto, P., Soenoko, R., Setyanto, N.W. (2013). Hazard analysis and critical control point (HACCP) produksi maltosa dengan pendekatan good manufacturing practice (GMP). Journal of Engineering and Management in Industrial System, 1(1): 14. https://doi.org/10.21776/ub.jemis.2013.001.01.3
[2] Hermansyah, M., Santoso, I., Wijana, S., Ahmad Fudholi, S. (2020). Gaplek based tapioca production system using fuzzy analytical hierarchy process (Fuzzy AHP) approach. International Journal of Advanced Science and Technology, 29(5): 5594-5606.
[3] Wijana, S., Effendi, U., Rahayu, E. (2006). Analisis Kelayakan Proses Produksi Tapioka dari Gaplek pada Skala Industri UKM., Jurnal Agritek. https://jtp.ub.ac.id/index.php/jtp/article/view/289.
[4] Wildan Ghozali, M., Hermansyah, M. (2016). Pengukuran Waktu Baku Proses Finishing Line Volpak Produksi Lannate Sp 25 Gram Philipina Guna Meningkatkan Produktivitas. Journal Knowledge Industrial Engineering, 3(3).
[5] Widiantoro, A., Hermansyah, M. (2019). Pengendalian kualitas produksi unit plate heat exchanger (PHE) pada proses welding koneksi dengan pendekatan pdca untuk meningkatkan performansi cycle time. Journal Knowledge Industrial Engineering, 6(2): 53.
[6] Sucipto, S., Rahman, F.S., Mustaniroh, S.A. (2018). Analisis penilaian konsumen terhadap kinerja kantin perguruan tinggi. Industria: Jurnal Teknologi dan Manajemen Agroindustri, 7(2): 97. https://doi.org/10.21776/ub.industria.2018.007.02.4
[7] Aprilianto, H.C., Kumalaningsih, S., Santoso, I. (2018). Penerapan jaringan syaraf tiruan untuk peramalan penjualan dalam mendukung pengembangan agroindustri coklat di kabupaten blitar. Jurnal Ilmiaah HABITAT, 29(3): 131. https://doi.org/10.21776/ub.habitat.2018.029.3.16
[8] Mulyo, A.E., Hermansyah, M. (2018). Penerapan TPM dengan menggunakan overall equipment efectiveness (OEE) dan six big losses pada mesin reverse osmosis Di bagian utility PT. Widatra Bhakti Journal Knowledge Industrial Engineering, 75.
[9] Septifani, R., Santoso, I., Pahlevi, Z. (2018). Analisis risiko produksi frestea menggunakan fuzzy failure mode and effect analysis (Fuzzy FMEA) dan fuzzy analytical hierarchy process (Fuzzy AHP). Proceedings of National Colloquium Research And Community Service, p. 14.
[10] Muhammad, H. (2018). Pendampingan masyarakat kampung olahan hasil tambak berbasis jaringan komunikasi. Soeropati, 1(1): 25.
[11] Ghoa, I. (2008). Structural equation modeling: Metode alternatif dengan partial least square (pls). Badan Penerbit Universitas Diponegoro, p. 17.
[12] Abd-El-Fattah, S.M., Fakhroo, H.A. (2012). The relationship among paternal psychological control and adolescents’ perfectionism and self-esteem: A partial least squares path analysis. Psychology, 3(5): 285. https://doi.org/10.4236/PSYCH.2012.35061
[13] Haenlein, G.F.W. (2004). Goat milk in human nutrition. Small Ruminant Research., 51(2): 155-163. https://doi.org/10.1016/j.smallrumres.2003.08.010
[14] Wang, J., Yang, J., Yu, K., Lv, F., Huang, T., Gong, Y. (2010). Locality-constrained Linear Coding for image classification. Institute of Electrical and Electrobics Engineers, p. 3362. https://doi.org/10.1109/CVPR.2010.5540018
[15] Springel, V., White, S.D.M., Jenkins, A., Frenk, C.S., Yoshida, N., Gao, L., Navarro, J., Thacker, R., Croton, D., Helly, J., Peacock, J.A., Cole, S., Thomas, P., Couchman, H., Evrard, A., Colberg, J., Pearce, F. (2005). Simulations of the formation, evolution and clustering of galaxies and quasars. Nature, 435: 629-636. https://doi.org/10.1038/nature03597
[16] Henseler, J., Ringle, C.M., Sinkovics, R.R. (2009). The use of partial least squares path modeling in international marketing. Emerald Insight, 20: 277-319. https://doi.org/10.1108/S1474-7979(2009)0000020014
[17] Kusaeri, A., Hermansyah, M., Bashor, H. (2016). Analisis pemilihan supplier menggunakan pendekatan metode analytical hierarchy process Di PT. XX. Journal Knowledge Industrial Engineering, 3(2): 51-61.
[18] Iskandar, D., Hermansya, M. (2020). Sistem pendukung keputusan pemilihan karyawan terbaik menggunakan metode analytical hierarchy process. Journal Knowledge Industrial Engineering, 90. http://jurnal.yudharta.ac.id/v2/index.php/jkie.
[19] Setiawan, A., Santoso, I., Putri, S.A. (2018). Pengaruh motivasi, budaya organisasi dan kepuasan kerja terhadap kinerja karyawan bagian pengolahan dengan metode partial least squares (PLS). Jurnal Teknologi Pertanian.
[20] Tjokrowinoto, M. (2002). State of the art ilmu administrasi Negara. Jurnal Ilmu Sosial dan Ilmu Politik. https://doi.org/10.22146/jsp.11086
[21] Chin, L., Liégeois, N., DePinho, R.A., Schreiber-Agus, N. (1996). Functional interactions among members of the Myc superfamily and potential relevance to cutaneous growth and development. J Investig Dermatol Symp Proc, 1(2): 128-135.
[22] Zakaria, Z., dan Nur Khoirullah, R.I.S. (2018). Modifikasi konsep participatory rural appraisal untuk pembekalan kuliah kerja nyata mahasiswa. Jurnal Aplikasi Ipteks Untuk Masyarakat, 7(1). https://doi.org/10.24198/dharmakarya.v7i1.14592
[23] Ridwan, I., Dollo, A., Andriyani, A. (2019). Implementasi pendekatan participatory rural appraisal pada program pelatihan. Journal of Nonformal Education and Community Empowerment, 3(2): 88-94. https://doi.org/10.15294/pls.v3i2.34913