Arun Nagarkatti* | Ajit Kumar Kolar
OPEN ACCESS
The use of coal will continue to meet the power demands for the next few decades in India. In this paper, the quantitative number called sustainability index (SI) for coal power plants is estimated on a life cycle basis by using a sequential combination of Analytic Hierarchy Process and Technique for Order of Preference by Similarity to Ideal Solution. Coal-based power plants along with gas, nuclear, hydro, solar photovoltaic, wind, and biomass-based power generation technologies are considered. The SI is estimated considering five dimensions of an energy system, namely, resource, energy, environment, economic and social, and fourteen criteria under these dimensions. A brief life cycle analysis of coal power plants is carried out to quantify all the fourteen criteria. The results show that the coal power plant ranks last among seven power plants and hence, SI has to be improved by using Advanced Coal Technologies (ACT). The development of indigenous ACT will increase efficiency, energy security, and decrease resource consumption as well as emissions. Further, the development of indigenous Carbon Capture Systems will avoid the CO2 emissions from the power plants. This study will help policymakers in developing a technology roadmap for optimal energy-mix in the country.
Indian coal power plants, life cycle assessment, analytic hierarchy process, technique for order of preference by similarity to ideal solution, multi-criteria decision making, sustainability index, advanced coal technologies
In modern society, electricity has become an essential part of our life. Electricity is required for the country’s economic growth and sustainable development. United Nations Development Programme (UNDP) has set 17 Sustainable Development Goals (SDGs) which came into effect in 2016 [1]. These SDGs aim to protect the earth and ensure the well-being of all the people. The 7th goal of SDGs refers to clean and affordable energy. The frequently quoted definition for sustainable development is from the Brundtland Report published in 1987, which states “Sustainable development is a development that meets the needs of the present without compromising the ability of future generations to meet their own needs” [2]. The real sustainability is ensuring electricity access to all. In April 2018, India has declared that 100% of the villages are electrified [3]. As per the Government of India (GoI) definition of village electrification, a village is considered as electrified if at least 10% of the households and all the public places in the village are electrified. But there are at least 100 million people in a rural area who do not have access to electricity.
An energy system should be assessed on a life cycle basis, which includes both energy source and technology. A sustainable energy system must qualify 5 A requirements, i.e., Accessibility, Availability, Acceptability, Affordability, and Assurance. These 5 A requirements lead to the selection of dimensions of the sustainability matrix in the present study. These dimensions are resources, energy, environment, economic, and social. It is important to assess sustainability quantitatively rather than providing qualitative statements. In this paper, efforts are made to develop a quantitative number for the sustainability of power generation systems. This study will be useful for the policymakers, academicians, industrialists, environmentalists, and other stakeholders for the selection of appropriate technology for power generation. In order to provide electricity to all and meet the ever-increasing demand for energy, new power generation systems have to be installed. This will help to build a sustainable power generation roadmap for the nation.
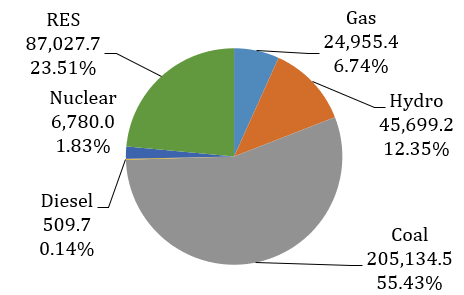
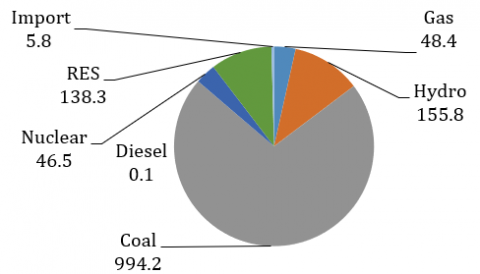
In India, electricity is produced from multiple energy sources. These include coal, oil, gas, nuclear, large hydro, and renewable (solar, wind, small hydro, and biomass) energy sources (RES). As per the Central Electricity Authority (CEA), the total installed capacity in India is 370,107 MW as of 31.03.2020 [3]. Figure 1 shows the installed capacity of various power generation systems. Figure 2 shows the electricity generated from various power generation sources during 2019-20. The total electricity generated is about 1389 billion kWh [3]. The per capita electricity consumption in India is about 1,122 kWh in 2016-17 [3] whereas the world’s per capita electricity consumption as given by International Energy Agency (IEA) was about 3,110 kWh during the same period [4]. This means India’s per capita electricity consumption is just 36% of the world’s average. The share of electricity from coal power plants in India is about 72.8%. Even though the installed capacity is about 56.4%, about just less than 3/4th of the total electricity is generated from coal-based power plants. Coal-based power plants play a significant role in the Indian Energy sector. Coal-based power plants are the backbone for the Indian power sector and this trend will continue in the coming decades. Hence, it is important to study the sustainability of coal-based power plants in India.
Figure 1. Source wise installed capacity (in MW)
Figure 2. Source wise power generation (in billion kWh)
India has abundant coal resources but there is a limited supply of oil and gas. It is estimated that there are 315 billion tonnes of coal available in India, of which 143 billion tonnes are proven. The total domestic coal production was about 676.48 million tonnes (MT) during 2017-18 [5]. As per the World Coal Association (WCA), India ranks second in the production of coal in the world in the year 2016, while first place was occupied by China [6]. The Press Information Bureau (PIB) has published that India imported coal about 208 MT majorly from Indonesia, South Africa, and Australia during 2017-18 [7].
The average gross calorific value of domestic coal is low and they are in the range of 13-17 MJ/kg. Domestic coal has a low carbon content of about 30 – 40% and a high ash content of about 35 – 45%. These two properties make Indian coal a low grade. But the domestic coal is of high quality as this contains less than half a percentage of sulphur. India is importing high-grade coal having a calorific value of 23-25 MJ/kg from various countries.
In India, there are about 191 coal-based power stations as of 31.03.2018 [3]. Currently, more than three fourth of installed capacity is subcritical power plants having typical steam parameters as 166.7 bar/537℃/537℃. All the recent installations in the country are supercritical coal power plants. Typical steam parameters of National Thermal Power Corporation (NTPC) supercritical power plants are 242.2 bar/ 537℃/ 565℃ [8]. The national plant load factor (PLF) for coal-based power plants was about 60.72% during 2017-18 [3] and the average PLF of NTPC coal-based power plants was 78.87% during the same time [3]. One of the biggest advantages of coal-based power plants is that they have a high Energy Return on Investment (EROI). The typical EROI of coal power plants ranges from 30-35 and it ranks third, while nuclear and hydropower plants occupy first and second places respectively. On the other hand, coal-based power plants are the highest point-source emitter of CO2. As per the CEA report, the weighted average specific emissions for coal-based power plants were 970 g CO2/kWh during 2017-18 [3]. It is estimated in the same report that the total emissions from the Indian power sector were about 922 MT CO2. The emissions from Mundra Ultra Mega Power Plants are as low as 810 g CO2/kWh. Some of the old power plants emit more than 1,240 g CO2/kWh. The other pollutants from coal power plants are NOx, SOx, particulate matter, and traces of mercury. These emissions are harmful to human beings as well as to the environment. The pollutants from the coal power plants should be reduced to minimize the externalities caused by coal-based power plants.
Few studies are available on Life Cycle Analysis (LCA) of Indian coal power plants. Agrawal et al. [9] assessed life cycle greenhouse gas (GHG) emissions from the coal-based power plant (1200 MW) in India using imported coal. Authors have neglected about construction and decommissioning phase, and have considered only the operation phase. The study is limited to GHG emissions and other aspects like water consumption, land usage, energy return on investment, economic, and social aspects are not considered. Even the recent study by Mallapragada et al. [10] is limited to life cycle GHG emissions from the Indian coal-based power plant.
Regarding the methodology for sustainability assessment, Wang et al. [11] reviewed Multi-Criteria Decision Making (MCDM) methods at four stages for a sustainable energy system. These four stages were the selection of criteria, assigning weights to the criteria, evaluation of the criteria, and aggregation. The criteria for energy systems were selected from the technical, environmental, economic, and social dimensions. Wang et al. listed and explained various weighting methods (equal weights, subjective, objective and combination weighting) for assigning weights to the criteria. They have also explained different MCDM methods available in the literature. The aggregation step is required when various MCDM methods yield multiple solutions for prioritizing alternatives. Kumar et al. [12] recently reviewed multi-criteria decision making (MCDM) methods for sustainable renewable energy development.
Subramanian and Ramanathan [13] reviewed 291 peer-reviewed articles on applications of the AHP in operation management. The AHP was proposed by Saaty in 1980 [14]. Application of AHP also included in the evaluation of energy systems. Assigning weights is usually subjective. The AHP is a highly structured method and reduces subjectivity by making a pairwise comparison. Behzadian et al. [15] reviewed 269 articles on the application of the TOPSIS method, a MCDM method used to evaluate, assess and rank alternatives. TOPSIS was proposed by Hwang and Yoon in the year 1981 [16]. About 14 scholarly papers were published in the field of energy management since the year 2000.
Further, many studies are available on the sustainability of power generation systems. Chatzimouratidis and Pilavachi [17] estimated ten power plants based on economic & technological, and sustainable aspects using scoring for indicators from the database and the AHP method.
The results show that the renewable energy power systems perform better. Stein [18] has ranked the power generation system in the United States using software called Super Decisions, which is based on AHP. Xu et al. [19] evaluated four 600 MW coal-based power plants in China using the Analytic Hierarchy Process (AHP) and Grey Relational Analysis (GRA) for evaluation of power plants. The results show that the power plants with better environmental indicators have performed better. Campos-Guzmán et al. [20] reviewed approaches for the sustainability analysis of renewable energy systems. About 171 articles were studied, of which only 16 articles were based on LCA and MCDM method for sustainability analysis. The authors concluded that the combination of LCA and MCDM method was found to be the best tool for sustainability analysis. Further, the combination of LCA and AHP was used most frequently due to its simplicity and robustness for sustainability analysis. Also, results showed that there are no studies regarding the combination of LCA and MCDM from India.
From the literature review, it can be seen that the estimation of sustainability index has many ways. These sustainability indices are dependent on many factors. These are data-specific, stakeholder specific, region-specific, method-specific, and so on. Also, there are limited studies on LCA based sustainability analysis of coal power plants in the literature. Further, there are minimal studies on India specific sustainability assessment of power generation systems in the literature. Hence, to bridge this gap the present study is carried out. For the first time, the LCA of Indian coal power plants is carried out considering raw materials, water, land, energy, economics, emissions, and waste generated.
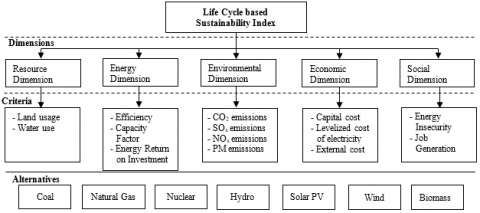
In this paper, the sustainability index (SI) is estimated on a life cycle basis with the aid of the Analytic Hierarchy Process (AHP) and Technique for Order of Preference by Similarity to Ideal Solution (TOPSIS). Figure 3 outlines the overall framework of the present study.
Figure 3. Overall framework of the present study to estimate the Sustainability Index
This section presents the methodology for the estimation of the SI of a coal power plant. A flowchart for estimation of SI is shown in the Figure 4.

Figure 4. Flowchart for estimation of SI
There are three major steps for estimation of sustainability index for any energy system as described by Wang et al. [11]. These three steps are selection of criteria, assigning weights to the criteria and evaluation of criteria. In this study, LCA is integrated in the method for quantification of these criteria. The following are the steps used to estimate the SI of coal power plants.
Step 1: The first step is to select the dimensions and respective criteria. These criteria will be selected based on the availability of data for all the power plants and can be compared on similar platforms. Here, five dimensions and 14 criteria are selected for the study. Table 1 summarises the dimensions and respective criteria considered in the present study.
Step 2: The next step is to quantify all the 14 criteria for the coal power plant on a life cycle basis. Hence, a brief LCA is carried out to obtain the required data. The details of the LCA are given in section 3.
Step 3: The third step is to choose alternatives and build a sustainability matrix. The sustainability matrix consists of quantified data of all 14 criteria for all the alternatives considered.
Step 4: The dimensions and criteria are assigned weights. These weights are given based on the importance of the scenario. This step is subjective weighing and lies in the interest of the stakeholders. Various scenarios are studied by changing the weights and the corresponding results obtained are analyzed. Analytic Hierarchy Process (AHP) is also used to assign weights for the dimensions and criteria.
Table 1. Dimensions and their respective Criteria
|
SN |
Dimension |
Criteria |
|
1 |
Resource |
Water consumption; Area usage. |
|
2 |
Energy |
Efficiency; Capacity Factor; Energy Return on Investment. |
|
3 |
Environmental |
CO2 emissions; NOx emissions; SOx emissions; Particulate matter emissions. |
|
4 |
Economic |
Capital cost; Levelized Cost of Electricity; External cost. |
|
5 |
Social |
Energy insecurity; Job Generation. |
The AHP is a method based on a pairwise comparison model, used to determine the weights for dimensions and criteria in the present study. The AHP method was proposed in 1980 by Saaty [14]. Table 2 shows the nine-point scale proposed by Saaty for pairwise comparisons. It gives relative importance among evaluation criteria. For example, if the weight is 5 between two criteria X and Y, then it means X is “strongly preferred” than Y. In the same case, when Y and X are compared the weight will be reciprocal of the weight of X and Y, i.e., 1/5. The step-by-step procedure is given below.
Table 2. Nine-point scale for pairwise comparison
|
Weight |
Interpretation |
|
1 |
Equally preferred |
|
3 |
Moderately preferred |
|
5 |
Strongly preferred |
|
7 |
Very strongly preferred |
|
9 |
Extremely preferred |
Step i: Evaluation matrix Amxm is constructed using the above mentioned pair-wise comparison method and Table 2 for all dimensions and their respective criteria of sustainability.
|
|
a11 |
a12 |
. |
. |
a1m |
|
|
a21 |
a22 |
. |
. |
a2m |
|
Amxm = |
. |
. |
|
|
. |
|
|
. |
. |
|
|
. |
|
|
am1 |
am2 |
|
|
amm |
Step ii: Each element aij of the matrix Amxm is normalized using Eq. (1). Each element aij is then divided by the sum of all elements in ith row. The resulting matrix is the normalized matrix  .
.
|
|
(1) |
Step iii: Elements are added along its rows to obtain  as shown in Eq. (2).
|
|
(2) |
Step iv: The resulting matrix is  matrix which is given in Eq. (3).
|
|
(3) |
Step v: Each element of matrix is normalized by using Eq. (4).
|
|
(4) |
Step vi: Resulting matrix  is the weight matrix as shown in Eq. (5). It can be seen that the sum of all elements (weights) in the matrix is equal to 1.
|
|
(5) |
The weight vector gives the weights for the all selected criteria.
Step 5: Using the sustainability matrix and weights from step 4, TOPSIS is used to estimate the SI of coal power plants. It is a MCDM method that deals with making decisions for the selection of the best solution among various alternatives. It is also used to rank alternatives. TOPSIS was proposed by Hwang and Yoon in 1981 [16]. In this method, two ideal solutions are formed. These two ideal solutions are called positive ideal solution and negative ideal solution. The positive ideal solution is formed by taking all the most desired characteristics from the alternatives. Similarly, the negative ideal solution is formed by taking the least desired characteristics from the alternatives considered. The most preferred alternative will be nearest to the positive ideal solution and farthest from the negative ideal solution. It can be noted that all the alternatives will be in between positive and negative ideal solutions. The brief procedure can be found below.
Step i: Construct decision matrix D. Decision matrix D contains various alternatives are placed along the rows and various criteria along the columns as shown. Here D is a ‘m x n’ matrix having ‘m’ number of alternatives (A) and ‘n’ number of criteria (C). xij indicates a quantified number for ith alternative (Ai) and jth criteria (Cj).
|
|
|
C1 |
C2 |
. |
. |
. |
Cn |
|
|
A1 |
x11 |
x12 |
. |
. |
. |
x1n |
|
|
A2 |
x21 |
x22 |
. |
. |
. |
x2n |
|
Dmxn = |
. |
. |
. |
|
|
|
. |
|
|
. |
. |
. |
|
|
|
. |
|
|
Am |
xm1 |
xm2 |
|
|
|
xmn |
Step ii: Normalize each element xij of the decision matrix D using Eq. (6).
|
|
(6) |
Step iii: Input weight vector W containing weights for all criteria as given in Eq. (7).
|
|
(7) |
Step iv: Construct a weighted decision matrix by multiplying normalized values and their respective weights using Eq. (8).
|
|
(8) |
Step v: From the weighted decision matrix, determine the positive ideal solution (  ) and negative ideal solution (
  ) using the following equations. Eq. (9) and Eq. (10) show positive and negative ideal solution vector, respectively.
|
|
(9) |


|
|
(10) |


Step vi: Evaluate the separation measure for each alternative from the positive ideal solution (  ) and the negative ideal solution (
  ) using Eq. (11) and Eq. (12) respectively. The separation measure gives the relative distance between an alternative and the positive ideal solution. Similarly, it gives the relative distance between an alternative and the negative ideal solution.
|
|
(11) |
|
|
(12) |
Step vii: Evaluate relative closeness measure to the ideal solution for each alternative using Eq. (13).
|
|
(13) |
Closeness measure  will be 1 for the positive ideal solution ( ) and 0 for the negative ideal solution ( ). Closeness measure for all alternatives lies between 0 and 1. This relative closeness measure is SI. Higher closeness measure is preferred, as it is closer to the positive ideal solution.