Achmad T. Nugraha* | Gunawan Prayitno | Lailatul A. Khoiriyah
© 2021 IIETA. This article is published by IIETA and is licensed under the CC BY 4.0 license (http://creativecommons.org/licenses/by/4.0/).
OPEN ACCESS
The identification of superior commodities is one of the initial stages of the development of the agro-policy area. This study aims to identify the leading agricultural commodities, land suitability, and the Pasuruan Regency's economic performance. Determination of superior commodities using Location Quotient (LQ) analysis, shift-share analysis, land suitability analysis, potency and problem analysis, and final analysis of district government policy. We found that coffee is the most widely produced plantation commodity in Pasuruan Regency. The shift-share analysis shows that coffee and tobacco grow faster than any other commodity. The land suitability analysis shows that coconut, coffee, cane, and tobacco could be planted in all Pasurua Regency areas. The Government should support coffee's economic performance in the provision of seed, training, organization of coffee events, and sale of coffee processing technology. However, several areas need to be addressed, including cooperative enterprises, agricultural terminals, and business certainty. Besides, cooperation with other industries is also needed to develop international markets.
land suitability, economic performance, location quotient, shift-share
In developing countries, agriculture plays an important role in development. In Indonesia, particularly in the early stages of development [1] the agriculture sector has significant contribution. In four forms of contribution to national economic growth and development, agriculture is also a potential economic sector: product contribution, market contribution [2], contribution from production factors, and the contribution from foreign exchange [3]. The primary role of the farming sector in economic development [4] resides in various ways: supporting economic development and providing national jobs, providing the citizens or residents of a country with food needs, foreign exchange employees, driving industry growth, poverty alleviation and the welfare of rural communities [5, 6].
The link between the farming and domestic growth drivers is linked to production and consumption and income, and investments in the non-agricultural sector. In the agricultural sector, surplus money is a source of investment funds in other sectors. Secondly, it is a raw material or input source for other industries, especially agro-industry and trade. Third, by increasing market demand for output as a source of diversification of production in other sectors [7].
In the current agricultural sector, there is an emerging problem of industrialization of the rural society [8] and the transformation of the agrarian economic structure, i.e., transforming the rural community's economic structure into an industrial society [9]. If ignored, the agricultural community's problem will harm the agriculture sector, e.g., the reduction in GDP of the agriculture sector and the labor absorption from the agriculture sector [10].
Increasing the agricultural sector's contribution can be achieved by simultaneously increasing agricultural productivity, increasing the standard of living of farmers, reducing poverty, increasing the absorption of the domestic market for industrial products, and stimulating trade activities [11]. The development of superior commodity agriculture, can improve the well-being of the community by increasing the value added of the product [12]. The establish the referrals of plantation commodity development could improve regional development [13], enhance food production and ensure that natural resources are managed in the best way possible for long-term sustainability in agriculture [14-16]. The development of optimal commodities could improve farmers' income and the welfare of rural regional inhabitants. The next step is to develop the industrial sector to process the potential product to become a finished product or semi-finished product to improve the added value.
Besides, future management must utilize land suitability information to determine land conditions and potential land suitability [17]. Land use that does not consider aspects of land suitability will cause environmental degradation in such a way that it is contrary to the principle of sustainable development, which requires the creation of a sustainable environment so that it does not harm the interests of future generations [18]. Efforts to develop superior commodities must refer to a particular commodity's comparative and competitive advantages [19, 20].
Pasuruan Regency is one of East Java's centers for the production of planting commodities. This makes Pasuruan Regency's agricultural potential in the agribusiness of the eastern Java province. The development of agropolitan areas has become an essential strategy for developing rural areas in the Pasuruan Regency in 2010-2030 [21]. The development of agricultural areas, based on this policy, includes the establishment of sustainable agriculture in food production areas, the development of commodities in each field, the development of the intensification and use of the right technology, development of agricultural and agricultural production centers, and base on the transformation of sustainable agricultural food functions [22]. In Pasuruan Regency, people grow coffee in the Kejayan region, fruit in the Pasrepan region, fish in the Puspo region, nuts and vegetables in the Tosari region, and livestock Wonorejo region, and rice in the Purwodadi region.
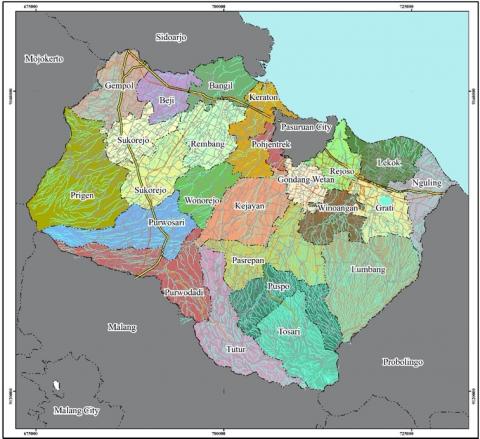
For its growth, the agro-political region of Pasuruan Regency needs to concentrate on developing superior commodities to be produced right at the target commodities. Therefore, this study would describe the superior goods produced in the agro-political region of Pasuruan Regency (Figure 1).
2.1 Location and time of study
Research has been carried out in the districts producing the most coffee and processing coffee to a more excellent selling value. The districts are the Tutur District, Prigen District, Purwodadi District, and Purwosari District. The four sub-districts have a role or hierarchy in the production of coffee commodities at Pasuruan Regency. Pureodadi and Purwosari Districts serve as coffee producers. The Prigen District operates as a coffee processor and markets processed coffee products on the local market, and Tutur District markets processed coffee products on the international market. The study was performed between March and May 2020.
2.2 Types of data and data collection techniques
The data type in this study includes two data, namely secondary data and primary data. Primary data, interviews, and observations, collected through primary surveys. The head of a farmer group owning a Pasuruan coffee processing company was interviewed. There were four farmers' groups that carried out the business, namely the heads of farmers' groups in Tutur, Prigen, Purwosari, and Purwodadi. Secondary data are obtained by requesting the Agriculture Office of the Pasuruan Regency additional documents, such as production data, land area, and coffee products marketing.
Figure 1. Pasuruan regency administration map
2.3 Data analysis
2.3.1 LQ (Location Quotient) analysis
Simple goods have been studied using the measurement of Location Quotient (LQ). LQ tests the relative concentration or extent of economic activities' specialization through a comparative approach [23].
LQ analysis contrasts the relative production of the sector in the same area and the sector's relative production compared to the broader coverage area as a benchmark of comparative advantage in the region [24]. This technique essentially offers a relative contrast between a sector's capacity in an area with the same capacity in the reference area [25]. Later, the LQ coefficient can be in the form of the number of employees per economic sector, output, or other units used as parameters [26]. The formula for LQ analysis can be seen in Eq. (1).
$L Q=\frac{S i / N i}{S / N}=\frac{S i / S}{N i / N}$ (1)
where:
Si: Number of workers in economic activity sector I in the area under investigation
S: The number of workers in all sectors of economic activity in the area under investigation
Ni: Number of sectors of economic activity I in the wider reference area, of which the area under investigation is a part
N: The number of all workers on the broader reference area
From the LQ calculation, the resulting general criteria are:
2.3.2 Shift-share analysis
Shift share analysis is an analytical technique that can identify several factors that influence differences in growth and economic performance in several different regions [27]. With shift-share, the development of sectors can be seen compared to other sectors and compare the economic rate in a region [23]. The Shift Share formula is shown in equation (2).
St=Vjt – (Vt/Va)Vja (2)
where:
Vjt=Volume of food crops (tonnes) in the region (district) at the end of the year
Vt=Volume of crops (tonnes) of food in the region (province) at the end of the year
Va=Volume of crops (tonnes) of food in the region (province) in the initial year
Vja=Volume of crops (tonnes) of food in the region (district) in years
The shift-share analysis results show how much faster the growth of the sector in the first regional level is compared to the growth of the sector in the second regional level (comparison area). If a sector's share of growth is negative, it means that it is not growing as fast in the first region as it is in the second region (comparison area).
2.3.3 Land suitability analysis
Land suitability analysis is used to determine if a land contains the resources necessary to cultivate certain crops [23]. Land expansion and extension for commodity development require land suitability analysis to determine the best development areas [28, 29]. The land suitability method used in these sampling calculations is based on FAO's recommendation. Land suitability is based on climate and soil, identified from the site's height as the higher the elevation, the colder and wetter it is [30, 31]. After analyzing the data, the steps for analyzing the data consisted of matching the plant criteria with the research area conditions [13, 32]. The land suitability evaluation criteria used in this study can be found in Table 1 and Table 2.
Table 1. Guidelines for land suitability classification for Robusta coffee
|
Parameter |
S1 |
S2 |
S3 |
N |
|
Altitude (masl) |
200-700 |
0-200 |
700-1200 |
>1200 |
|
Air Temperature (Celsius) |
22-25 |
25-28 |
19022 |
<19 |
|
Slope |
<8 |
8-16 |
16-30 |
>30 |
|
Rainfall (mm) |
2000-3000 |
1750-2000 |
1500-1750 |
<1500 |
|
Number of Dry Months (Months) |
2-3 |
3-5 |
5-6 |
>6 |
Source: Modifikasi and Djaenuddin et al. (2003) in [32]
Table 2. Guidelines for land suitability classification for Arabica coffee
|
Parameter |
S1 |
S2 |
S3 |
N |
|
Altitude (masl) |
700-1600 |
1600-1750 |
1750-2000 |
>2000 |
|
Air Temperature (Celsius) |
16-22 |
15-16 |
14-15 |
<14 |
|
Slope |
<8 |
8-16 |
16-30 |
>30 |
|
Rainfall (mm) |
1200-1800 |
1000-1200 |
2000-3000 |
>3000 |
|
Number of Dry Months (Months) |
1-4 |
<1 |
5-6 |
>6 |
3.1 Characteristics of coffee commodities in Pasuruan Regency
Coffee cultivation is done in Pasuruan with Robusta and arabica. Arabica coffee grows in areas above 1000 meters above sea level, with temperatures between 16-20 degrees Celsius (Primary survey, 2020). Robusta coffee thrives at an elevation of 400-700 meters above sea level, with a 21-24 degrees Celsius temperature and a warm-dry season of 3-4 months. Connoisseurs are eager for robusta coffee. Robusta coffee is the most highly produced type and most popular in the market. This year, 70% of the total area of the coffee farms in Pasuruan is planted with Robusta, and the remaining area is planted with Arabica coffee types. The commodity area for coffee is as Table 3.
There were 104 coffee farmers groups with 4,200 farmer families in Pasuruan. Most coffee production comes from 8 districts in the Pasuruan Regency, with most of the production coming from Purwodadi District, Puspo District, Tosari District, Lumbang District, Pasrepan District, and Purwosari District. Products like coffee beans and coffee powder are used in processing. Coffee production in each region is summarized in the Table 4.
Table 3. The area of coffee land for each district
|
District |
Areas (ha) |
Robusta (ha) |
Arabica (ha) |
|
Purwodadi |
936,02 |
655,214 |
280,806 |
|
Tutur |
1152,58 |
806,806 |
345,774 |
|
Puspo |
1653,68 |
1157,576 |
496,104 |
|
Tosari |
370,95 |
259,665 |
111,285 |
|
Lumbang |
441,25 |
308,875 |
132,375 |
|
Pasrepan |
248,30 |
173,81 |
74,49 |
|
Purwosari |
117,01 |
81,907 |
35,103 |
|
Prigen |
425,78 |
298,046 |
127,734 |
|
Total |
5345,57 |
3741,899 |
1603,671 |
Source: Pasuruan Regency in figures [33]
Table 4. The results of coffee production in each district
|
Districts |
Production (ton) |
|
Purwodadi |
47,64 |
|
Tutur |
643,02 |
|
Puspo |
157,20 |
|
Tosari |
45,02 |
|
Lumbang |
88,98 |
|
Pasrepan |
63,53 |
|
Purwosari |
135,25 |
|
Prigen |
180,86 |
|
Total |
1365,43 |
Source: Pasuruan Regency in figures [33]
3.2 Economic potential analysis
3.2.1 Location Quotient (LQ) analysis
Based on the LQ calculation for the plantation sector (Table 5), the commodity determined to have the highest LQ value is coffee (LQ>1). On the one hand, coconut, sugar cane, and tobacco are not yet significant products in the Pasuruan Regency (LQ<1).
Table 5. The LQ value of plantation commodities in Pasuruan Regency
|
Commodities |
District Production Results (Xij) |
Provincial Production Results (Xin) |
LQ |
|
Coconut |
5.604 |
263.347 |
0,89 |
|
Coffee |
6.768 |
113.125 |
2,49 |
|
Cane |
3.991 |
194.903 |
0,85 |
|
Tobacco |
99 |
114.490 |
0,04 |
|
Total |
16.462 |
685.865 |
|
Source: Analysis results, 2020
In Pasuruan Regency, coconut, coffee, sugar cane, and tobacco are all grown. A result of LQ>1 is a leading commodity, while a result of LQ<1 is not a leading one. Xij is the yield produced by the regency, Xj is the yield produced by the district. Xin means the district's total production of the commodity, while Xn means the province's total production. Overall, the quantity of plantation production totaled 16,462 tons in the district, while in the province, plantation production totaled 685,865 tons. The leading coffee plantation commodity enjoys an LQ value of 2.49, namely that of coffee.
3.2.2 Shift share analysis
Based on the calculation of shift-share in the plantation sector, it can be seen that the commodities that have a positive value (+) are coffee and tobacco (Table 6).
Table 6. Value of shift-share of plantation commodities in Pasuruan Regency
|
Commodities |
2017 |
2018 |
Shift Share |
||
|
Region |
Prov. |
Region |
Prov. |
||
|
Coconut |
6.652 |
244.05 |
5.604 |
263.34 |
-1.574 |
|
Coffee |
3.510 |
66.661 |
6.768 |
113.12 |
811 |
|
Cane |
23.835 |
1.066.62 |
3.991 |
194.90 |
-364 |
|
Tobacco |
58 |
126.075 |
99 |
114.49 |
46 |
Source: Analysis results, 2020
Based on the shift-share analysis results, it can be seen that there are two commodities with a positive value (+), namely coffee and tobacco. This means that the sector's growth at the first regional level is faster than that of the sector in the second region (comparison area). Moreover, there are two (four) commodities with a negative value (-), namely coconut and sugar cane. Thus, it can be concluded that these two commodities cannot trigger growth in the agricultural sector because they have slow growth.
3.3 Determination of superior commodities
Based on the results of the calculation of LQ, Shift-share, and the Government's policies for the development of the Pasuruan Regency Agropolitan Area, it is known that the main commodity is coffee (Table 7). The Government supported the coffee commodity in the form of the issue of Regent Circular No. 1 of 2019 concerning Friday as Coffee Drinking Day in Pasuruan Regency.
Table 7. Main commodity of Pasuruan Regency
|
Commodities |
LQ Analysis Results |
Shift Share Analysis Results |
Government Support |
|
Coconut |
0,89 |
-1.574 |
No |
|
Coffee |
2,49 |
811 |
Yes |
|
Cane |
0,85 |
-364 |
No |
|
Tobacco |
0,04 |
46 |
No |
Source: Analysis results, 2020
3.4 Land suitability analysis
The coffee commodity grown in Pasuruan Regency consists of two varieties, arabica coffee, and robusta coffee. The analysis of the land suitability classification is based on the two tables above. In carrying out this analysis, the parameters of air temperature, rainfall, and the number of dry months were considered the same for the four sub-districts. The following data were obtained from the overlay analysis carried out using ArcGIS (Table 8), Figure 2 (Robusta coffee) and Figure 3 (Arabica coffee).
Table 8. Result of land suitability analysis
|
Types of Coffee Varieties |
Land Suitability Class |
Areas (Ha) |
|
Robusta coffee (Figure 2) |
S1 (Perfectly Fit) |
4868 |
|
S2 (Sufficiently Fit) |
477 |
|
|
S3 (Somewhat Appropriate) |
3138 |
|
|
S4 (Mismatch) |
4584 |
|
|
Total area |
13067 |
|
|
Arabica coffee (Figure 3) |
S1 (Perfectly Fit) |
1009 |
|
S2 (Sufficiently Fit) |
30 |
|
|
S3 (Somewhat Appropriate) |
180 |
|
|
S4 (Mismatch) |
1568 |
|
|
Total |
2786 |
Source: Analysis results, 2020
1. S1 class
Class S1 is a very suitable class (highly suitable). The land included in category S1 does not have high limits for sustainable use. In other words, S1 land has only insignificant limiting factors and does not affect productivity. Land classified as S1 for robusta coffee and Arabica coffee in four sub-districts in the Pasuruan district covers 4,868 hectares and 1,009 hectares, respectively.
2. S2 class
An S2 class is an entirely appropriate class (moderate suitable). The land included in category S1 has a relatively large barrier to maintaining the management level that needs to be carried out. This limiting factor will affect productivity and profit and increase the input required. Land classified as S2 for robusta coffee and Arabica coffee in four sub-districts of Pasuruan Regency covered 477 hectares and 30 hectares, respectively.
3. S3 Class
The S3 class is marginally suitable or is referred to as somewhat appropriate in the table above. The land included in category S3 has huge boundaries to maintain the management level that must be carried out. This limiting factor will affect productivity and profit and increase the input required. Land classified as S3 for robusta coffee and Arabica coffee in four sub-districts in the Pasuruan district covered 3.138 hectares and 180 hectares, respectively.
4. Class N
Class N is the wrong class (Not suitable). The land included in category N has the most significant barrier between the other three classes, so it is not easy to maintain the management level that must be carried out. These limiting factors hinder the success of sustainable land use over the long term. Land classified as S3 for Robusta coffee and Arabica coffee in four sub-districts in the Pasuruan district covered 4,584 hectares and 1,568 hectares, respectively.
Figure 2. Robusta coffee land suitability map in Pasuruan Regency
Figure 3. Map of Arabica coffee land suitability in Pasuruan Regency
3.5 Analysis of the potential of coffee commodities and sub-system problems
The coffee commodity is analyzed based on the potential and the problems that have arisen due to real conditions in the field. Potential and problem analysis (Table 9) is explained by the coffee commodity sub-system, starting with the upstream sub-system, the agricultural sub-system, the downstream sub-system, the marketing sub-system, and other support service sub-systems.
Table 9. Results of the analysis of the potential and problems of the coffee commodity sub-system
|
Subsystem |
Potency |
Problem |
|
Upstream subsystem |
- Government assistance in providing superior plant seeds independently - The availability of fertilizer is enough - Technology for groups of farmers |
- The minimum used of organic fertilizers - The small/limited capital loans - Only a few groups of farmers have access to technology |
|
Farming subsystem |
- There is easy for the coffee plant and take care of the coffee - The farmers know how to prepare the land - No need for intensive fertilization - There is a different type of coffee under geographical conditions |
-The coffee mixed plantation has a risk of disease. -The coffee planting is so dense and difficult to get maximum sunlight. -There is no pest repellent technology |
|
Downstream subsystem |
- The region has ‘Kapiten’ coffee - They are still the good price of coffee for Arabica or Robusta (domestic and abroad market) |
-Lack of relationship and communication between farmers -The "Kapiten" brand not for all product in Pasuruan Regency |
|
Marketing subsystem |
- The potency of marketing abroad: Japan and Brunei Darussalam. - Potency for the domestic market |
- There is no specific type of coffee for the demographic coffee market. - Export limitations |
|
Other supporting service sub systems |
- The good physical infrastructure to support distribution from the central regency. - Government support for coffee development. - The is Friday as "Coffee Day" and labelled it 'Kapiten' in Pasuruan Government. |
|
3.6 The concept of developing of sub-system the coffee commodity
3.6.1 Upstream sub-system
The upstream sub-system's goal is to develop the Pasuruan Regency coffee commodity as a leader in coffee quality and make it a high-quality commodity. In the development of the upstream sub-system, we provide and superior plant seeds. Farmers in this area tend to cultivate their seeds. If farmers were trained, they would be able to produce superior coffee seeds. Also, the development of coffee seeds by Puslitkoka results from the company's research. Additionally, training for fertilizer processing was also conducted, and improvements in coffee quality were made, particularly in organic coffee beans. Farmers use resources from the capital and government support to develop their coffee plantations. Development can be supported by collaborating with third parties to increase the quality of government capital assistance through funds, seeds, fertilizers, and tools to produce coffee.
3.6.2 Farming sub-system
The concept of agricultural development of coffee commodities through organic fertilization during the farming process supports coffee production quality. The process of treating coffee plants that are still using pesticides and insecticides at a price that continues to increase, it is necessary to subsidize pesticides and insecticides and assistance from the Government for coffee production equipment so that coffee maintenance remains optimal.
3.6.3 Downstream sub-system
The focus of the coffee commodity is the domestic and international marketing of the crop. An example of how coffee is marketed overseas is to the Sumber Makmur Abadi Farmer Group in Prigen in North Sumatra. There is a problem of a lack of relationship and communication between farmers, which also hinders them. The development of downstream coffee commodities is directed to establish cooperative relationships between farmers groups in Pasuruan Regency. The processing to marketing of coffee products is the same for all consumers without any final quality imbalance.
3.6.4 Marketing sub-system
There is no single market for coffee in Pasuruan Regency. The marketing chain for coffee products in Pasuruan Regency consists of direct purchases by consumers who hear about and purchase coffee from the producers. Producers do not sell themselves to the market because, depending on the market, coffee grounds are produced in minimal quantities only. Market coffee processing will give farmers a better income because they will not depend exclusively on orders. With the market, producers/sellers can reduce intermediaries that currently dominate the commodity coffee market. Also, it is planned to reach a broader market. The Government must work with farmer groups to include all products in the "KAPITEN" branding so that the marketing reach of all products is broader. When farmers are impeded, there are constraints in obtaining export permits. With a specialized institution, it is necessary to have a process to process export permits.
3.6.5 Other supporting service sub-systems
The development of a support service sub-system is an effort undertaken to help agriculture and commodities. This support can take the form of finances, infrastructure and facilities, cooperation and assistance, and assistance or aid from the local Government.
One of society's potentials that have not been optimally utilized is the traditional social institutions that have taken root in the community. The existing development is limited to farmer groups. The excellent development can be improved again by forming associations and cooperatives to harness the efforts of farmers.
Based on the results of the LQ analysis of coffee commodities, it indicates that coffee represents the leading commodity in the market. The result of the eight-way bulk coffee shift-share was 811, a fast growth. Coffee development is also supported by the Regent's policy, a local branch of the national administration. Regarding Friday and coffee drinking in Pasuruan Regency beginning from 2019. The research delineation area for the coffee commodity development projects in Pasuruan Regency includes four sub-districts and the main Pasuruan City.
The location of Pasuruan Regency is appropriate for growing robusta and arabica coffee plantations. The Government has supported coffee production in Pasuruan Regency, but it is not quite ideal yet. The Government assists in seed supply, training, organizing coffee events and selling coffee processing technology. Nevertheless, there are still multiple areas that need to be addressed, including cooperative enterprises, agricultural terminals and business certainty. Cooperation with other industries is also needed to develop international markets.
We are thanks to the Agribusiness Department of UIN Syarif Hidayatullah Jakarta and the Department of Regional and Urban Planning Brawijaya University for the support to this research.
[1] Prayitno, G., Subagiyo, A. (2018). Membangun Desa. Malang: UB Press.
[2] Ba, M.N. (2016). Strategic agricultural commodity value chains in Africa for increased food: The regional approach for food security. Agricultural Sciences, 7(9): 549-585. https://doi.org/10.4236/as.2016.79055
[3] Wijaksana, G., Safri, M., Parmadi, P. (2017). Kontribusi dan elastisitas subsektor dalam sektor pertanian di Kabupaten Tebo. Jurnal Paradigma Ekonomika, 12(2): 77-86. https://doi.org/10.22437/paradigma.v12i2.3943
[4] Meijerink, G., Roza, P. (2007). The role of agriculture in development. Markets, Chains and Sustainable Development Strategy and Policy Paper, no. 5. Stichting DLO: Wageningen: Wagenigen UR. http://www.boci.wur.nl/UK/Publications/.
[5] Praburaj, L., Design, F., Nadu, T. (2018). Role of agriculture in the economic development of a country. Shanlax International Journal of Commerce, 6(3): 1-5. https://doi.org/10.5281/zenodo.1323056
[6] Salas López, R., Gómez Fernández, D., Silva López, J.O., Rojas Briceño, N.B., Oliva, M., Terrones Murga, R.E., Barrena Gurbillón, M.Á. (2020). Land Suitability for Coffee (Coffea arabica) Growing in Amazonas, Peru: Integrated Use of AHP, GIS and RS. ISPRS International Journal of Geo-Information, 9(11): 673. https://doi.org/10.3390/ijgi9110673
[7] Muta'ali, L., Kinasih, S.S.K., Sumini. (2012). Daya dukung lingkungan untuk perencanaan pengembangan wilayah. Badan Penerbit Fakultas Geografi (BPFG), Universitas Gadjah Mada.
[8] Bertrand, A.L., Osborne, H.W. (1959). The impact of industrialization on a rural community. Journal of Farm Economics, 41(5): 1127-1134. https://doi.org/10.2307/1235254
[9] Ismanto, K., Huda, M., Maulida, C. (2013). Transformasi masyarakat petani Mranggen menuju masyarakat industri. Jurnal Penelitian, 9(1). https://doi.org/10.28918/jupe.v9i1.129
[10] Hanafie, R. (2010). Pengantar ekonomi pertanian. Penerbit Andi.
[11] https://ec.europa.eu/agriculture/sites/agriculture/files/consultations/cap-modernising/soc_background_final_en.pdf.
[12] Dai, S.I. (2019). Development of superior commodities in the agricultural sector in an effort to improve the economy (Pengembangan Komoditas Unggulan Sektor Pertanian Dalam Upaya Peningkatan Perekonomian). Gorontalo Development Review, 2(1): 44-58. https://doi.org/10.32662/golder.v2i1.466
[13] Suryani, L., Sitorus, S.R., Minibah, K. (2016). An analysis of superior plantation commodities and referral development in bungo regency, Jambi Province. Jurnal Litiri, 21(4): 175-188. https://doi.org/10.21082/littri.v21n4.2015.175-188
[14] Ferreira, J. (1995). Sustainable Agriculture and Rural Development. https://www.academia.edu/8162070/Sustainable_Agriculture_and_Rural_Development_in_Fien_ed_Teaching_for_a_Sustainable_World_UNEP_and_Griffith_University_Nairobi_and_Brisbane.
[15] Aristin, N.F., Normelani, E., Purnomo, A. (2016). Identification of main commodities as regional development bondowoso regency. In lst International Conference on Geography and Education (ICGE 2016), pp. 185-188. https://doi.org/10.2991/icge-16.2017.37
[16] Hiola, S.K.Y. (2019). Leading commodities of food crops and plantation subsector in Pinrang district. Agriekonomika, 8(1): 7-13. https://doi.org/10.21107/agriekonomika.v8i1.4999
[17] Nugraha, A.T., Prayitno, G., Maulidi, C., Jahra, S.L., Limantara, L.M. (2019). Patchouli plant development in Trenggalek regency. International Journal, 16(53): 95-100. https://doi.org/10.21660/2019.53.67606
[18] Nowar, W., Baskoro, D.P.T., Tjahjono, B. (2015). Analisis Kesesuaian Lahan Komoditas Unggulan dan Arahan Pengembangannya di Wilayahkabupaten Cianjur. Tataloka, 17(2): 87-98. https://doi.org/10.14710/tataloka.17.2.87-98
[19] Saner, R., Yiu, L., Bhatia, A. (2009). Commodity Development Strategies in the Integrated Framework. Printed in Denmark by Phoenix Design Aid. United Nations Development Programme. http://www.csend.org/publications/development-int-rel/48-commodity-development-strategies-in-the-integrated-framework.
[20] Tjahja, A.N., Prayitno, G., Wardana, N.W.S. (2019). Analysis of land carrying capacity for the development of leading commodities in Kulon Progo Regency, Indonesia. International Journal of Geomate, 16(53): 171-176. https://doi.org/10.21660/2019.53.37276
[21] Pasuruan, B.K. (2010). Rencana Tata Ruang Wilayah Kabupaten Pasuruan 2009-2029. http://jdih.pasuruankab.go.id/index.php/hukum/detail/rencana-tata-ruang-wilayah-rtrw-kabupaten-pasuruan-tahun-2009-2029.html.
[22] Pasuruan, K. (2018). RPJMD Kabupaten Pasuruan 2018-2023 (Regional Development Plan 2018-2033), 1-419.
[23] Mulya, S.P., Panuju, D.R., Ambarwulan, W., Hamzah, U. (2019). Multicriteria land index for determining primary commodity in agricultural landuse planning. In IOP Conference Series: Earth and Environmental Science, 284(1): 012006. https://doi.org/10.1088/1755-1315/284/1/012006
[24] Tarigan, R. (2016). Regional Development Planning. Jakarta: Bumi Aksara.
[25] Gunawan, G., Cahyono, A.E., Santoso, A. (2018). Local superior commodities, regional specializations and regional economic contributions. The Journal of Distribution Science, 16(9): 35-41. https://doi.org/10.15722/jds.16.9.201809.35
[26] Yulianti, N., Firmansyah, R., Sundari, S. (2020). Analisis potensi sektor unggulan kota balikpapan dalam mempersiapkan ibu kota baru dari perspektif ekonomi pertahanan. Moneter: Jurnal Keuangan dan Perbankan, 8(1): 1-13. https://doi.org/10.32832/moneter.v8i1.3679
[27] Taniu, S., Yakup, A.P., Novriansyah, M.A. (2020). Shift share analysis to determine regional economic performance of Gorontalo. Gorontalo Development Review, 3(2): 102-113.
[28] Prayitno, G., Sari, N., Hasyim, A.W., Nyoman, S.W. (2020). Land-use prediction in Pandaan District pasuruan regency. International Journal of Geomate, 18(65): 64-71. https://doi.org/10.21660/2020.65.4173
[29] Soewandita, H. (2008). Studi kesuburan tanah dan analisis kesesuaian lahan untuk komoditas tanaman perkebunan di Kabupaten Bengkalis. Jurnal sains dan teknologi Indonesia, 10(2): 128-133. https://doi.org/10.29122/jsti.v10i2.796
[30] Kandari, A.M., Kasim, S., Limi, M.A., Karim, J. (2015). Land suitability evaluation for plantation forest development based on multi-criteria approach. Journal Agriculture, Forestry and Fisheries, 4(5): 228-238. https://doi.org/10.11648/j.aff.20150405.15
[31] Umar, I., Widiatmaka, W., Pramudya, B., Barus, B. (2017). Evaluasi Kesesuaian Lahan untuk Kawasan Permukiman dengan Metode Multi Criteria Evaluation di Kota Padang. Journal of Natural Resources and Environmental Management, 7(2): 148-154. https://doi.org/10.29244/jpsl.7.2.148-154
[32] Pariamanda, S., Sukmono, A., Haniah, H. (2016). Analisis kesesuaian lahan untuk perkebunan kopi di kabupaten semarang. Jurnal Geodesi Undip, 5(1): 116-124.
[33] BPS Pasuruan. (2019). Pasuruan in Figure 2019. Pasuruan Regency.