Shatha Abass Hasan | Ammar K. Ebraheem | Mustafa Abduljalil Ibraheem*
© 2021 IIETA. This article is published by IIETA and is licensed under the CC BY 4.0 license (http://creativecommons.org/licenses/by/4.0/).
OPEN ACCESS
The purpose of this research is to establish criteria for selecting villages for rural development service centres by integrating statistical and tabulated data from one side with geodatabase for spatial analysis from the other. Thus, by using this to generate spatial indicators, the research would be able to create a holistic picture of the situation of all villages and to discover the real potential in them. The research methodology consisted of statistical data obtained by means of a data questionnaire for all villages and combined these statistical data with spatial data for the community of villages under review in order to produce a new generation of spatial information as indicators for decision-making. The results indicate the possibility of generalising the spatial analysis of geographic information systems as an effective basis in the studies of spatial planning at its various levels. Besides, the spatial analysis provides a real-time spatial predictor for rapid decision-making because it is based on a direct and periodic update of the spatial database.
rural development, spatial analysis, village, GIS, spatial indicator
In developing countries, 73% of the land is rural, so it is very important for the development of all aspects of life [1]. So, the mission of development rural areas to minimizing gap between urban and rural areas, to prevent migration to the urban areas, and also prevent dominance urban areas on the resources of rural area, that led to distortion spatial structure of region [2].
In general, the rural development plan containing network of nodes, each node has a certain role to do towards other surrounding village. In other word creating interrelationship among these nodes, it is important to recognizing resources of each node [3]. To create interaction among these nodes must not be at the same level of capabilities, it needs to borrowing the idea of Newton's gravity model [4]. The strategic point in development rural area that the development it is related to limited sources, so we must be intelligent to discover these sources and who dealing with it, to be able to create variety in level of network nodes, at the same time with different size of nodes [5].
The development of rural area will help to prevent and minimizing the continues detrition of it, so minimizing negative effect from losing the soil, that occurring the important elements for rural life [6]. This help us to make rural is more sustain during time. It’s also good for ecosystem in serious way, to achieving that it is necessary to separate all development rural areas out of urban transition zone. To prevent the competition with urban services for the cities, Trukhachev [7] showed that the development may achieve this to rural development through finding of new job opportunities, make enhancement of income for rural people, retention of economically active population and young people in rural areas, minimizing migration, establishment of a market for local products, announcing conserving culture and heritage to rural area, and preservation of the natural area.
Many studies depending on statistics only to make them strategy to develop rural area, like project of “TOWARDS A WORKABLE RURAL DEVELOPMENT STRATEGY: in the South Africa. It depended only static data to make comprehensive image for whole the area, but the main leak was not projecting these data on the spatial dimension to create the spatial relationship among data in real world dimension [8].
Varshney et al. [9] showed that it can get clearer image for the data and information when related it and join it to spatial dimension.
Anshar et al. [10] reported that now can depending on spatial analysis to decision maker, not just for analytical method for descriptive analysis-based mapping. The powerful of that, can merging qualitative and quantitative data with spatial dimension. Also, the study uncovered that it’s have ability to dealing with huge data, in different type, numbers or characters, and any other form, so it be able to unity all these data by combination with the spatial location. In same respect, Chabuk et al. [11] showed that it can create a new generation from information, based on the old statistical data, but showing it effect in the spatial location.
Afnarius et al. [12] reported that one of the important opportunities that geospatial analysis provides us its ability to union all heterogynous data related to development plan. Besides, the said study showed that there is another powerful for depending on the spatial analysis by using geographic information system database, the dynamic level for information to be able to update the data and generate information at any level and time, then can correcting any decision according any update of data.
On the other hand, Trisnawarman and Rusdi [13] stated that reaching to decision making, must be finish our Identification of problems, then we can represent facts to decision maker. They also reported that it represents the decision maker who’s that person related to head of local government, so it’s must could have a vision built from all local villagers. Ciolac et al. [14] showed that the decision maker must searching on the brilliant thing to recognizing power elements in its decision. Besides, the authors stated that the way of thinking make to us easy to selecting appropriate site for development, and activity the complementary among activities instead of marginal excessive competition.
It is now be clear that spatial analysis help decision maker to identify their problems and get real picture on it, then problems more quickly and thoroughly and formulate solutions to solve it, suitable tool for achieving short, mid, and long-term aims for the development.
According to above survey, most of the studies and experiments in selecting villages that are suitable for rural development, were built on the available potentials for these villages, in terms of population size, infrastructure and urban structure, but they did not take into account the spatial dimension and its effects on the success of these selected villages by being development poles that provide services to its rural hinterland. In other words, even though spatial dimension was a factor in choosing these villages, it was through use it as specific distance between these villages, this was the main research problem trying to discussing it and find a solution to it.
Therefore, this research came to clarify the importance of spatial analysis in the formation of the schematic spatial indicator to overcome the problem of communication between the planning teams, also between the planner with decision maker. The research turns to the hypothesis that the concept of spatial analysis of statistical indicators by linking them to the spatial dimension and building them within a geospatial database helps decision-makers and planners to see the place in a way different from the depending on the traditional statistical method. Therefore, the idea of applying this was within the study of villages located in central Iraq within the province of Babylon, and the selection of a group from these villages that could be promoted to be service centers within the policy of rural development for the region.
The research methodology will be based on stating the importance of the spatial indicator and its role in relation to the spatially planning process, study was actually applied with one of the field studies of the Ministry of Planning / Department of Local and Regional Development / Directorate of Planning of Babylon Governorate. The study depends on conducting a survey and collecting information for all villages in the province of Babylon. It was about (738) villages, so we did not survey all villages, but we selecting all villages with population more than (250 person), it’s about (504) villages. After that we entering these data into a geographic information system database, was designed specifically for the study area. In light of this, a spatial analysis was carried out using the tools available within the geographic information systems to display the potentials of each village and compare it with its surroundings, in order to determine the priority of a group of villages within important sites that could support rural development. Consequently, reaching a hierarchical order of these villages within three main levels, basic levels of villages that support the surrounding rural hinterland with all social and technical services. The second level of villages is supportive villages that provide only social services to their rural surroundings. The third level is the villages within the daily service ranges for the scattered rural environment that provide daily needs of housing or groups were scattered in rural areas.
Therefore, the aim of the research was to reach a new hierarchy of rural settlements in the study region, different from what was previously approved, by setting spatial determinants for the distribution of the development potential of each village within the spatial structure of the analysis. Thus, the decision-maker showed a clear picture in the villages that could provide a larger service area and away from the effects of the services provided by cities in the region.
Research depending on some data to preferring among villages, so it can be easy to selecting the right village with suitable level for it. These data conclude from [15] as shown below:
All villages related to their potentiality and location capability [17]. So, they have the same chance to developed, but according to accumulative services and richness in location potentiality we found ourselves facing range of possibilities to decision which village may be supported instead of others according to it local resources [18]. We need to explore a new and active approach to analyzing spatial data, spatial analysis gives use critical element to decide why we select some villages instead of others, depending on local government resources [19]. In the first stage we must respect the regional vision for distributed services, this vision related to achieving catchments area without any overlapping, so the overlapping among catchment areas for these villages makes waste of resources [20].
Preparing data to appropriate level for villages, so we can merge it with spatial analysis, and we can sense the change in these data, for that geographic information system give us a suitable environment for analyzing micro scale data for villages [21].
The importance of the rural dimension comes from several elements and characteristics, the most important of which are [22]:
In light of these considerations, it is imperative that we consider this aspect more seriously and independently of what is happening in urban problems and treat the rural spatial structure as an independent structure in order for us to achieve a clear vision of the nature of its problems and design development programs for them independently of the projections of urban environment problems and the needs of urban residents on them.
The subject of indicators is a very critical topic in all sciences, especially applied and engineering sciences, as it is a subject for debate and opinion. Through the size of the logic adopted in the conviction that this abstract figure represents a level for judging a situation, the importance of the indicator mainly lies beyond it as a means of communication and expression. This method needs a high level of credibility to be adopted. One of the most important foundations that represent a cornerstone in relying on any indicator is the extent of its dependence on meteorological data, so the more that the index is based on non-derivative or non-estimated data, the more that reflects the strength of its reliability [23].
The importance of the impact of the indicator in the sciences of urban and regional planning is that it is the basis for building policies and strategies related to the development and development of urban and rural activities alike.
So, one of the most dangerous stages in the work of the urban and regional planner is its definition of the indicator that will express the state of the study problem, and what are the justifications for granting confidence to this direct, the danger and awkwardness of choosing the indicator. In this area simply comes that everything related to the work of the urban and regional plan is with a spatial dimension related to effectiveness and influential activity. In other words, it is an intermediate state between abstract numerical indicators and spatial indicators, as both types hardly express the required state study it.
In this field, GIS came with the methodology of preparing spatial indicators, as it merged between the purely spatial dimension that expresses the ranges of different phenomena and the abstract digital indicator that expresses the variation in the impact of phenomena. Therefore, the adoption of previous indicators and the adoption of a spatial index to support decision-makers and guide spatial development policies are considered a pivotal stage in urban and regional transformation planning sciences.
When looking at the rural settlements and their relationship with their surroundings in a perimeter made up of different activities and interacting activities related to the rural settlements between them and the urban settlements surrounding them. This system can be represented abstractly as a network of its basic nodes, which are the rural settlements with their different hierarchical levels, which illustrate the dominance of each of them and their spatial area of influence, showing the degree of their centralization. Also, the group of roads connecting these squares are the channels linking this network and also differ according to the degree of use of the nature of each road. While the physical environment surrounding the nodes and the channels of different surfaces form the characteristics in which the interactions and interrelationships of these nodes take place, which in turn are made up of cultivated areas and water bodies. And other vocabulary of land cover according to the specificity of any region.
From that, one can see the abstract geometric figure that summarizes the relations of the geometrical shape of the place, which allows the process of analyzing it according to its various properties, but in an abstract numeric spatial manner [24].
The field study is reviewed in selecting the villages that will be the rural service centers within the study of rural development for Babylon Governorate, which will lead the rural development in Babylon Governorate. The number of rural settlements in the governorate amounting to (738) villages were dealt with according to the statistics of the Central Information Agency. They are discussed according to the spatial dimension and the structure of their spatial distribution, with a focus on rural settlements with a population size of more than (250) people, of which (504) villages included in the distribution of the questioner of data collecting. The following methodology is followed in selecting the rural service centers for Babylon Governorate:
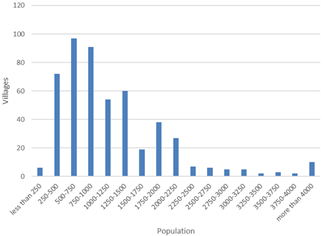
Table 1 shows the distribution of rural settlements in Babylon Governorate according to the population size. It seems that the settlements are distributed according to a statistical period of (250 people), to exclude rural settlements with a population size of less than (250) people, whose number reached (236) villages. A percentage (32%) of the total number of rural settlements in Babylon Governorate.
Rural settlements are less than (250) people, they are beneficial settlements, the number of families is small and generally they are scattered. Therefore, they are not qualified to build rural service centers in them, so the rest of the levels that will support the increase of the rural and create the appropriate threshold population size in these settlements are addressed, and the required population size threshold is achieved to establish economically effective rural service and development centers.
Table 1. Distribution of villages in Babylon Governorate according to their population size for the year 2016
|
The ratio % |
Number of villages |
Population size |
|
32 |
236 |
Less than 250 people |
|
9 |
64 |
250-500 |
|
13 |
94 |
500-750 |
|
12 |
88 |
750-1000 |
|
9 |
66 |
1000-1250 |
|
5 |
40 |
1250-1500 |
|
6 |
41 |
1500-1750 |
|
3 |
23 |
1750-2000 |
|
3 |
23 |
2000-2250 |
|
1 |
11 |
2250-2500 |
|
2 |
14 |
2500-2750 |
|
1 |
4 |
2750-3000 |
|
1 |
11 |
3000-3250 |
|
0 |
1 |
3250-3500 |
|
1 |
6 |
3500-3750 |
|
0 |
1 |
3750-4000 |
|
2 |
15 |
More than 4000 people |
|
100 |
738 |
Figure 1. Distribution villages according to population size figures
Figure 1 shows the spread of these rural settlements at the governorate level. It is noticed that as the population size of the stable increases, its numbers gradually decrease, which is a positive indicator, in addition to the semi-homogeneous spread of the sizes of rural settlements on the various administrative units in the governorate. It seems that large rural settlements with a population size (more than four thousand people) are spread almost uniformly within the area of the governorate as a whole, with some concentration within the southwestern part of the governorate, due to the nature of agriculture, the productivity of the land, and the large number of urban centers. The largest percentage of rural settlements is from the population size (500-1000) people, as their percentage reaches about (25%) of the total rural settlements in Babylon Governorate, which is a population size that is qualified to provide basic services to the population.
It seems that there are four rural headquarters with large population size distributed almost uniformly, one for each administrative unit. While it seems in the figure of the Hashemite district heading towards the north of the district and away from its outskirts and the number of settlements also ranges up to five rural settlements. The same case is in the district of Mahawil, where four large settlements are concentrated in the north of the district, within only one administrative unit, and are spread regularly within the Al-Musayyib district among its administrative units within the Jurf al-Sakhr sub-district and Alexandria.
Figure 2 shows that by excluding the peripheral groups, the distribution of rural settlements according to their population size will be similar to what is possible with the normal distribution curve, and it indicates a situation closer to normal in the distribution of rural settlements in terms of population.
Figure 2. The normal distribution of the sizes of the population of rural
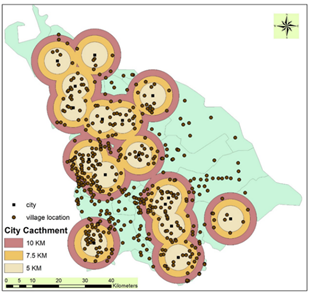
The results of the questionnaire indicated that the movement of village residents to obtain services ranges at its maximum distance of (10) km. Therefore, it was adopted to define urban service areas formed by the cities of the province, with the aim of excluding villages within the range of urban centers service. The reason for this is that any support for these villages as development centres, Ruralia will not be in line with the service it will receive from the nearby urban center.
The Figure 3 shows urban service areas and their relationship to rural settlements at the governorate level, as three proposals have been made for the impact ranges of the governorate cities as development service centers, which are an impact distance (5 km), an impact distance (7.5 km), and an impact distance (10 km). Table 2 shows the number of villages affected by the impact of urban service centers.
It seems that about (50%) of the total rural settlements in Babylon Governorate fall within the influence of the urban service with a distance of (10 km). While it reaches (157) rural settlements within the influence of the urban center with a range of (5 km), and almost a third of the villages it is located within the area of influence of the service range of cities with a distance of (7.5 km). And, because the relationship is proportional between the level of the standard of service and the distance of the influence of the urban center. A distance (7.5 km) was adopted as the extent of the influence of cities as service centers for the countryside, to provide a reasonable number of rural settlements that will be subject to selection and selection as rural development centers. Besides, the excluded percentage of settlements is 290 rural settlements.
Table 2. Villages within the ranges of urban service centers
|
Number of villages |
Not within the service |
|
157 |
Within a range of 5 km |
|
290 |
Within a range of 7.5 km |
|
378 |
Within a range of 10 km |
Figure 3. Distribution villages according to effective catchment area of cities
8.1 Hierarchy of rural service centers
After excluding small villages with a population size of less than (250) people, which numbered (236) villages, because previous experiences showed that the population size was ineffective for rural development.
It seems from Table 3 that the rural villages were divided to four levels, the first and most important level is the rural villages with a population of more than (3000) people, equivalent to an urban residential community. Consequently, it will secure its service needs and its service surroundings for the surrounding countryside, and the number of these villages reached (33) villages at the level of the governorate as a whole as shown in Figures 4, 5.
As for the second level, they are non-basic service villages that provide almost weekly services, and their population ranges from (1001-3000) people. It was determined that it constitutes approximately from one third to half the size of the residential neighborhood, and with the back next to it will be close to the standard of the size of the population of an urban residential district. Therefore, exceeding the threshold of services required to be provided in residential stores, the percentage of these villages reached (39%) of the total number of villages in the governorate.
As for the third level of villages, they are daily service villages, whose population ranges from (501-1000) people, and their number reached (150) villages, forming (30%) of the total villages in Babylon Governorate. While there are approximately (25%) villages remaining, that represents villages called individual service villages, which hardly provide their services to themselves and depend on others in obtaining the service.
The impact distance of the basic village service, (with a population size of more than 3000 people), was determined by a radius (5 km) depending on its being synonymous with the neighborhood center and the services it provides need a means of transportation and are not daily services in general as shown in Figure 5.
Whereas the area of influence of the non-essential village was (2.5 km) because it provides services at the level of a residential locality approximately. Also, the immediate village reaches its area of influence within the limits of (1.25 km) because it generally serves the members of the village itself and its adjacent neighborhoods. In addition, its services are generally of the type of service with daily frequency on her.
Figure 6 shows the rural service area of the settlements that are candidates for development and compares it with the urban service area of the cities of the governorate. The rural service centers that fell within the influence of the urban service area of the cities were excluded.
8.2 Differentiation criteria and weights
A set of criteria was developed on the basis of which the differentiation criteria were made between the different villages. After which service centers consisting of three levels, a basic rural service center, a non-basic rural service center, and a similar rural service center. Provided that the villages that will be subject to the differentiation criteria are outside the urban service impact area of cities the province, or at the very least, on the outskirts of this region, as was previously explained.
Table 3. Classification of rural villages at basic service levels
|
The ratio % |
Number of villages |
population |
service type |
Village level |
|
6 |
33 |
More than three thousand people |
Basic service villages |
1 |
|
39 |
197 |
1001-3000 inhabitants |
Non-essential service villages |
2 |
|
30 |
150 |
501-1000 inhabitants |
Daily service villages |
3 |
|
25 |
124 |
Less than 500 people |
Individual villages |
4 |
|
100 |
504 |
5 |
Figure 4. Hierarchy of villages according to potentiality
Figure 5. Relationship between type of catchment area and level of village service
Measurable indicators have been provided in this section to be able to draw a spatial image of each village. The standard setting stage includes two phases, the first is a set of standards that are proven through the experiences of rural development in Iraq, through which the human settlement can be called a village. Therefore, it is criteria consist of seven points, all of it establish the spatial definition to the village. Accordingly, the stage of adopting these villages as development centers for building rural development processes, as follows:
We can depend on spatial model to improve and clearing the relationship between all element’s information from questioner, as first side. The village location with it is population size as the second size. Accordingly, it can reach for that clearing thorough GWR model. Geographically Weighted Regression (GWR) is a powerful tool for exploring spatial heterogeneity, when the structure of the process being modelled varies across the study area. The concept of GWR is similar to linear model and it is basic equation. It must have one dependent variable (y), and try to explain this variable through set of related independent variables (Xi). The relationship between y and x is assumed to be constant across the study area [25]. Through the results of (GWR) analysis, we find that the ratio of correlation and reliability is very high through the values of (R2), as its value reached (0.84). Which indicates the success of the model in explaining approximately (82%) of the phenomenon of spread and distribution of villages, (R2Adjusted) is equal to (0.81). The results of the GWR model were characterized by their realism because the standard deviation was close to zero, which clearly indicates the suitability of interpreting the results [26, 27].
Figure 6. Relationship between villages population size with catchment area (urban and rural)
The effect of the six independent variables varied on the dependent variable that represents the size of the population of each village. Therefore, there were two main groups that had a relationship with the size of the village’s population. First group have positive impact on increasing the size of the village’s population, which is according to the hierarchy of influence (education and health, technology and mechanization, urban catchment area, livestock production). The second group, it had an adverse effect on increasing the size of the village’s population. It was represented by variables according to the hierarchy of influence (agricultural production, level of infrastructure capabilities, social services), as shown in Figure 7.
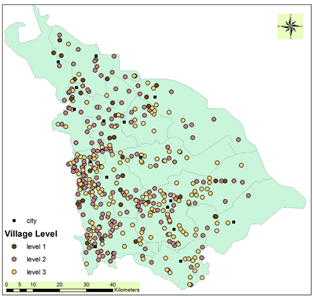
Figure 7. Distribution levels of village
In the sense that villages that suffer from lack of agricultural production and low level of social services and infrastructure have a small population. In contrast to villages located near areas of influence of cities and which have high mechanization and large animal productivity will be large in terms of the number of the village population. Thus, the following can be indicated as:
The study aimed to cover all available data through a field survey form. In order to step away from subjectivity in contrast and offer a more detailed view, these parameters were established in a questionnaire. After that, it was distributed to ten experts in the field of rural development in order to obtain weights that indicate the importance of each indicator.
The experts try to explain impact of each elements through the questioner. In addition to suggesting any of the other factors that they feel affect the spatial development of the governorate's countryside. Therefore, the adoption of this weight, which is formed from the opinions of experts, as a determinant of priorities for indicators and stating their importance within the field of rural development.
Table 4 shows the criteria for the experts' preference and the criteria that have been added. As (11) criteria were added to make the number of criteria (18) criteria for comparison between villages, with a different weight for each criterion ranging from the highest weight (82) weight points to the lowest weight (8) Weights points.
Figure 8 showing the selected rural service centers in Babylon Governorate. Table 5 shows the number of villages that were nominated according to the weights, and according to the levels that were determined by adopting the standard population size appropriate for the hierarchy of rural settlements in the governorate. The total number of nominated villages reached (200) villages distributed on three levels, the largest number of candidate villages within the third and fourth levels, respectively, which are the levels in which the population is less than (1000) people.
Table 4. Comparison between criteria that assess the priority of selecting villages for the purposes of rural development
|
Hierarchy |
The total weight |
Factors |
|
1 |
82 |
Availability of the water ration |
|
2 |
77 |
Population |
|
3 |
75 |
Availability of a source of drinking water |
|
4 |
73 |
Agricultural activity |
|
5 |
70 |
The distance from the nearest primary school |
|
6 |
68 |
Provides electrical energy |
|
7 |
61 |
The size of livestock |
|
8 |
58 |
Number of agricultural holdings |
|
9 |
57 |
Away from the nearest health center |
|
10 |
52 |
The distance of the village from the city |
|
11 |
30 |
Religious and archaeological tourism |
|
12 |
27 |
Paved roads |
|
13 |
17 |
Provide jobs |
|
14 |
13 |
Agricultural reclamation |
|
15 |
13 |
Geographical location |
|
16 |
12 |
Sports stadiums |
|
17 |
10 |
Rural industries |
|
18 |
8 |
Building materials |
Table 5. Villages selected as final rural service centers
|
Filter level |
|||
|
Third level |
Second level |
level one |
|
|
6 |
2 |
Basic rural service |
|
|
58 |
5 |
3 |
Countryside service is not essential |
|
36 |
4 |
Real-time country service |
|
|
100 |
11 |
3 |
Total |
The selected villages will consist of the basic rural service of important administrative services such as police stations, court, post offices and specialized health centers in addition to preparatory and vocational schools. As for the villages that have been chosen to be a countryside service, it is not essential from the first level, but they are of equal importance. Their services are mainly centered around providing an effective level of primary education and basic health services, in addition to institutions concerned with developing and marketing agricultural and animal production and maximizing profit from it.
Figure 8. The selective village as rural service center
It is noticed the irregular spread of these centers over the administrative units in the governorate, because the methodology for selecting villages was based on the spatial need for the lack of distribution of basic services on the structure of the Diyala province's countryside. Also, methodology for distributing rural service centers according to the sectoral structure of the different activities has not been adopted, which sometimes generates discrepancies in the economic differences of the administrative units spatially.
As the highest share of the selected villages was within the Kifl sub-district within the Hilla district, at a rate of (23%) of the total number of villages, followed by the al-Madhatiyah sub-district, at a rate of (19%) of the total number. The third place was the Abi Gharaq district, in which (13) village was chosen, forming a percentage (10%) of the total number, followed by Al-Tali`a sub-district (9%).
Then, the Nile and Alexandria sides with an equal ratio of (8%), reaching the lowest percentage within the Al-Musayyib district and Al-Hashimiyah district centers, as the percentage of both reached (1%) equivalent to one village each. When examining the reality of these villages with the Babylon Agriculture Directorate, it is possible to merge the selected center with the neighboring villages in the case of cultural and local harmony between these villages.
In this study, a comparison was made between all the villages and the building of a spatial information base that includes all the details of the differentiation and the weights of these villages. And, since the process of development events and changes in the spatial structure require long periods of time corresponding to the ten-year plans, the stage that is currently in question can be counted as the first phase of the rural development project For Babylon Governorate, which will extend from 2016-2026. Then, followed by the second phase, which can be easily prepared depending on the database prepared for the current project, with a simple update of some new data from projects and the like. Presented study conclusions can be drawn as follows:
[1] Kodge, B.G., Hiremath, P.S. (2012). Web based geo-spatial and village level information extraction system using FOSS. Journal of Advances in Information Technology, 3(4): 222-227. https://doi.org/10.4304/jait.3.4.222-227
[2] Delius, P., Schirmer, S. (2001). Towards a workable rural development strategy. TIPS Working Paper; 3-2001. https://idl-bnc-idrc.dspacedirect.org/bitstream/handle/10625/29403/123929.pdf?sequence=1.
[3] Rumkel, L., Sam, B., Umanailo, M.C.B. (2019). Village head partnership, village consultative body and customary institution in village development. International Journal of Scientific & Technology Research, 8(8): 1058-1063.
[4] Fahmy, M., Mahdy, M.M., Abdelalim, M.F. (2017). A proposed methodology for planning a sustainable village at mid Sinai arid climatic zone. Egypt. International Journal of Environmental Science and Development, 8(12): 804-808. https://doi.org/10.18178/ijesd.2017.8.12.1061
[5] Wójcik, M. (2016). Towards the creation of the “Network of the most interesting villages”. Selected problems of rural renewal in Poland. Studia, 43: 59-72. http://dx.doi.org/10.7163/SOW.43.4
[6] Koval, V., Petrashevska, A., Popova, O., Mikhno, I., Gaska, K. (2019). Methodology of ecodiagnostics on the example of rural areas. Architecture Civil Engineering Environment, 12(1): 139-144. https://doi.org/10.21307/ACEE-2019-013
[7] Trukhachev, A. (2015). Methodology for evaluating the rural tourism potentials: A tool to ensure sustainable development of rural settlements. Sustainability, 7(3): 3052-3070. https://doi.org/10.3390/su7033052
[8] Yusuf, S., Umanailo, M.C.B., Putri, R.N., Qhuril, D., Ely, M., Darma, D. (2019). Village institution relations in the utilization of village funds in Namlea district. International Journal of Scientific & Technology Research, 8(8): 1837-1842.
[9] Varshney, K.R., Chen, G.H., Abelson, B., Nowocin, K., Sakhrani, V., Xu, L., Spatocco, B.L. (2015). Targeting villages for rural development using satellite image analysis. Big Data, 3(1): 41-53. https://doi.org/10.1089/big.2014.0061
[10] Anshar, M., Wahida, N. (2019). The potential for rural resources development, specifically livestock commodities based on Geographic Information System (GIS) in Patukku Village, Bontocani District, Bone Regency. In IOP Conference Series: Earth and Environmental Science, 247(1): 012076.
[11] Chabuk, A.J., Al-Ansari, N., Hussain, H.M., Knutsson, S., Pusch, R. (2017). GIS-based assessment of combined AHP and SAW methods for selecting suitable sites for landfill in Al-Musayiab Qadhaa, Babylon, Iraq. Environmental Earth Sciences, 76(5): 209. https://doi.org/10.1007/s12665-017-6524-x
[12] Afnarius, S., Syukur, M., Ekaputra, E.G., Parawita, Y., Darman, R. (2020). Development of GIS for buildings in the customary village of Minangkabau Koto Gadang, West Sumatra, Indonesia. ISPRS International Journal of Geo-Information, 9(6): 365. https://doi.org/10.3390/ijgi9060365
[13] Trisnawarman, D., Rusdi, Z. (2019). Participatory GIS for collaborative decision making development of village resource potential. In IOP Conference Series: Materials Science and Engineering, 508(1): 012117.
[14] Ciolac, R., Adamov, T., Iancu, T., Popescu, G., Lile, R., Rujescu, C., Marin, D. (2019). Agritourism-A Sustainable development factor for improving the ‘health’of rural settlements. Case study Apuseni mountains area. Sustainability, 11(5): 1467. https://doi.org/10.3390/su11051467
[15] Pijanowski, J.M. (2016). Village renewal as an important element of integrated rural development. Barometr Regionalny, 14(3): 165-172.
[16] Davidenko, P., Menshikova, E., Gorbenkova, E. (2018). Smart settlements»: the development concept in a new socio-economic and informatiologic conditions. IOP Conference Series: Materials Science and Engineering, 365: 022050.
[17] Ganapuram, S., Nagarajan, N., Balaji, V. (2013). Village-level drought vulnerability assessment using geographic information system (GIS). International Journal of Advanced Research in Computer Science and Software Engineering, 3(3): 1-10.
[18] Assagaf, S.S.F., Pulhehe, S., Zakariah, I., Yusuf, N., Sangaji, M.F., Kembauw, E., Basrun, M.C. (2019). Construction of the village as a development shaft in the Island Buru. International Journal of Scientific & Technology Research, 8(9): 2139-2143.
[19] Abubakar, T., Azra, E.A., Mohammed, C. (2012). Selecting suitable drainage pattern to minimize flooding in Sangere village using GIS and remote Sensing. Global Journal of Geological Sciences, 10(2): 129-140. https://doi.org/10.4314/gjgs.v10i2.1
[20] Bariar, A., Gupta, R.D., Prasad, S.C. (2004). Development of GIS based spatial data infrastructure for micro-level planning. In Map World Forum. https://www.semanticscholar.org/paper/DEVELOPMENT-OF-GIS-BASED-SPATIAL-DATA-FOR-PLANNING-Bariar Gupta/24831be698074f73af06e7497bed961505775bcd.
[21] Malarvizhi, K., Kumar, S.V., Porchelvan, P. (2016). Use of high resolution Google Earth satellite imagery in landuse map preparation for urban related applications. Procedia Technology, 24: 1835-1842. https://doi.org/10.1016/j.protcy.2016.05.231
[22] Maxwell, S., Urey, I., Ashley, C. (2001). Emerging issues in rural development. London: Overseas Development Institute. https://ashleyinsight.co.uk/wp2020/wp-content/uploads/2020/04/emerging-issues-rural-development.pdf.
[23] Verburg, P.H., Neumann, K., Nol, L. (2011). Challenges in using land use and land cover data for global change studies. Global Change Biology, 17(2): 974-989. https://doi.org/10.1111/j.1365-2486.2010.02307.x
[24] Zhang, C.X., Liu, W.D., Luo, Y.L. (2013). GIS-based town and villages spatial structure analysis and optimization method. Journal of Applied Science, 13(11): 2097-2010. https://doi.org/10.3923/jas.2013.2097.2101
[25] Nilsson, K., Nielsen, T.S., Aalbers, C., Bell, S., Boitier, B., Chery, J.P., Fertner, C., Groschowski, M., Haase, D., Loibl, W., Pauleit, S., Pintar, M., Piorr, A., Ravetz, J., Ristimäki, M., Rounsevell, M., Tosics, I., Westerink, J., Zasada, I. (2014). Strategies for sustainable urban development and urban-rural linkages. https://hal.archives-ouvertes.fr/hal-01528698/.
[26] Oguzor, N.S. (2011). A spatial analysis of infrastructures and social services in rural Nigeria: Implications for public policy. GeoTropico, 5(1): 25-38.
[27] Grau, H.R., Aide, T.M. (2007). Are rural–urban migration and sustainable development compatible in mountain systems? Mountain Research and Development, 27(2): 119-123. https://doi.org/10.1659/mrd.0906