Yongzhi Chang | Bingyu Liu* | Minghong Gao
© 2020 IIETA. This article is published by IIETA and is licensed under the CC BY 4.0 license (http://creativecommons.org/licenses/by/4.0/).
OPEN ACCESS
Facing the short supply of timber, China must actively improve the sustainability of its timber import from Russia. Therefore, this paper evaluates the state of China-Russia timber trade in 2002-2016, in the context of the construction of the China-Mongolia-Russia (CMR) economic corridor. Drawing on the Markov theory, the Grey prediction model was revised to predict the trade value, log volume and sawn timber volume of China’s import of Russian timbers in 2017-2025. The results show that the revised Grey-Markov model was 4.53%, 2.23% and 30.08% higher than the Grey prediction model in the prediction accuracy of trade value, log import volume, and sawn timber import volume between China and Russia, respectively; that the import value will increase to USD 5.047 billion in 2025, the import volume of sawn timbers will grow steadily in 2017-2025, while the import volume of logs will decline to 6.8025 million m3 in 2025; these trends are mainly the result of the hike in log price and tariffs in Russia. Based on the predicted results, the authors discussed about the mechanism of China-Russia timber trade, and then put forward several suggestions: both countries should pursue sustainable development, highlight the importance of infrastructure construction, establish trade associations, cultivate a favourable investment environment, and encourage technological innovations. The research findings shed new light on sustainable development in the fields of forestry and trade.
timber trade, sustainable development, China-Mongolia-Russia (CMR) economic corridor, Grey-Markov model, trend prediction
Recent years has seen a boom of timber-consuming industries in China, ranging from papermaking, furniture-making, to timber processing. As a result, the demand of primary forest products (e.g. logs and sawn timbers) is soaring in the domestic market. However, China has been facing a short supply of timber since the implementation of forest protection policies in 1998. The supply-demand gap has been fluctuating between 35% and 51% [1]. In 2016, the shortage of domestic timber increased to a staggering number of 300 million m3. To make up for the shortage, China began to import huge amounts of forest products. Statistics from Food and Agriculture Organization of the United Nations (UNFAO) show that China spent USD 5.33 billion on importing 48.72 million m3 of logs in 2016, several times of the spending (USD 1.06 billion on 7.33 million m3) in 1995.
Russia, the largest country in the world by area, is one of the largest log exporters to China. With half of its territory covered by forests, Russia boasts 1/5 of the forest area and 1/4 of the forest growing stock across the globe. The majority (73%) of forest resources in Russia are concentrated in the Far East, which is adjacent to Northeast China. Although much of its forest stock remains unexploited, Russia has exported more forest products than any other country. In 2016 alone, Russia exported 20.7 million m3 of logs and 26.7 million m3 of sawn timbers. Northeast Asia and North Europe are the destinations of 88% of these products. Over the years, China has occupied an important share in Russia’s timber export, especially since the launch of the China-Mongolia-Russia (CMR) economic corridor [2, 3].
On July 9, 2015, China, Russia and Mongolia signed a development plan to build the CMR economic corridor, with the aim to boost their transport links and economic cooperation [2]. This development plan is the integration of China’s Belt and Road Initiative, Russia’s Trans-Eurasian Corridor initiative, and Mongolia’s Prairie Road development initiative. Running across the Eurasia continent, the CMR economic corridor provides new opportunities to various fields (e.g. trade, agriculture, and infrastructure), and exerts a powerful impact on timber import/export between the member countries.
Against this backdrop, China and Russia must actively pursue the sustainable development of their timber trade. Sustainable development is the organizing principle for meeting human development goals while sustaining the ability of natural systems to provide the natural resources and ecosystem services that are critical to economy and society. After the First Earth Summit in 1992 and the Johannesburg Summit in 2002, the sustainable development of forestry has been widely accepted as the key to combat climate change, desertification, loss of biodiversity, and economic stagnation. The sustainability of timber trade is an important aspect of the sustainable development of forestry [4-12].
Sponsored by the Russian government and the academic circle, many Russian scholars have explored the state and sustainability of China-Russia timber trade [13-19]. China began to investigate China-Russia timber trade in the early 1990s, as state-owned forestry enterprises encountered a severe lack of forest resources. So far, the sustainable development of the trade has been examined from the aspects of trade flow, structure, states, factors, policies and problems [20-26]. For instance, the principle of sustainable development was highlighted in A Guide on Sustainable Overseas Forests Management and Utilization by Chinese Enterprises jointly issued by China’s State Forestry Administration and Ministry of Commerce in 2009 [27]. The existing studies have only roughly outlined China-Russia timber trade, failing to develop a systematic framework to predict the future trend of the trade.
There are various methods of trend prediction at home and abroad, including macro econometric model [28-30], prediction by regression analysis [31, 32], time series prediction [33-36], and Grey prediction [37]. The first three approaches require a large sample size, consume a long time, and ignore the long-term data variation. By contrast, the Grey prediction can solve uncertainty problems with a few data and poor information. As its name suggest, the Grey prediction is grounded on the grey theory, which accumulates and normalizes the time-variation of raw data. The effect of Grey prediction can be enhanced by the Markov model. Without needing many continuous data or historical information, the Markov model can predict the future trend with the state transition probability from the current or recent dynamic data. This model is suitable for trend prediction based on time series with great fluctuations.
Considering the great fluctuations in China-Russia timber trade, this paper revises the Grey prediction model based on the Markov model, and applies the revised model (Grey-Markov model) to predict the overall trend and promote the sustainability of China-Russia timber trade in the context of the CMR economic corridor. During the prediction, China-Russia timber trade was treated as a grey system, involving eigenvectors like trade value, log volume and sawn timber volume, and the parameters of the differential equation model were determined based on time-series data. Finally, several suggestions were put forward to promote the sustainable development of China-Russia timber trade.
2.1 GM (1, 1) prediction model
The Grey prediction is generally implemented in the following steps: setting up a dynamic or static white model based on the known data series; solving the future grey model through transform; iteratively improve the whiteness of the grey model until the change law becomes clear. The Grey prediction often utilizes the first-order single variable model GM (1, 1), or the first-order multi-variable model GM (1, n).
The GM (1, 1), as a discrete form of differential equation model, is a first-order linear dynamic model with one univariate series capable of time series prediction. The differential equation of the model can be expressed as:
$\frac{d x^{(1)}}{d t}+a x^{(1)}=u$ (1)
where, $x^{(1)}$ is a series obtained through an accumulated generating operation (AGO); t is the time; a and u are the grey numbers for development and internal control, respectively. Both a and u are parameters to be estimated.
The GM (1, 1) model can be established as follows [38]:
The nonnegative raw series corresponding to time series of t can be expressed as:
$X^{(0)}=\left\{x^{(0)}(1), x^{(0)}(2), \ldots, x^{(0)}(n)\right\}$ (2)
Applying an AGO to formula (2), the 1-AGO series $X^{(1)}$ of $X^{(0)}$ can be obtained as:
$x^{(1)}(k)=\sum_{i=1}^{k} x^{(0)}(i), k=1,2, \ldots, n$ (3)
Then, a and u can be solved by the least squares method.
It is further assumed that:
$Y=\left[\begin{array}{c}x^{(0)}(2) \\ x^{(0)}(3) \\ \vdots \\ x^{(0)}(n)\end{array}\right], B=\left[\begin{array}{cc}-\frac{1}{2}\left(x^{(1)}(1)+x^{(1)}(2)\right) & 1 \\ -\frac{1}{2}\left(x^{(1)}(2)+x^{(1)}(3)\right) & 1 \\ -\frac{1}{2}\left(x^{(1)}(n-1)+x^{(1)}(n)\right) & 1\end{array}\right]$ (4)
Then, the parameter vector to be identified is $\Phi=\lceil a, u\rceil^{T}=\left(B^{T} B\right)^{-1} B^{T} Y$ . The time response series of the basic GM (1, 1) can be described as:
$\hat{x}^{(1)}(k+1)=\left(x^{(0)}(1)-\frac{u}{e}\right) e^{-\alpha^{2}}+\frac{u}{a}$ (5)
The restored value of the time response series at time (k+1) can be expressed as:
$\hat{x}^{(0)}(k+1)=\hat{x}^{(1)}(k+1)-\hat{x}^{(1)}(k), k=1,2, \ldots n$ (6)
Next, the variable can be calculated as
$\hat{X}^{(0)}=\left(\hat{x}^{(0)}(1), \hat{x}^{(0)}(2), \ldots \hat{x}^{(0)}(n)\right)$
2.2 Grey-Markov prediction model
If the sample size is very limited, the Grey prediction cannot achieve desirable effect, due to the difficulty in narrowing down the interval of disorderly and volatile raw data. The prediction errors of the GM (1, 1) model stems from the following: when the model is fitted with the differential equation, the data series produced through the AGOs must be exponential, but a nonnegative time series is not necessarily exponential. To eliminate the errors, it is necessary to derive a state transition matrix (i.e. the deviation law) from the deviations of the GM (1, 1) model over the simulation years, and correct the predicted results into a range of probabilities.
Here, the GM (1, 1) model is revised based on the Markov model. The basic ideal of the Markov model is to obtain a state transition matrix from the raw data series, and apply it to estimate the future trend. Suppose there are n possible states of an event in the course of development, and the probability that the event shifts from state Ei to Ej is the state transition probability. Then, the state transition probability matrix can be defined as:
$P=\left[\begin{array}{cccc}P_{11} & P_{12} & \cdots & P_{12} \\ P_{21} & P_{22} & \cdots & P_{2 n} \\ \cdots & \cdots & \cdots & \cdots \\ P_{n 1} & P_{n 2} & \cdots & P_{m}\end{array}\right]$
Based on the above matrix, it is possible to determine the grey interval of future changes to timber trade. Then, the median of the interval can be treated as the predicted value of future timber trade G(k).
To verify its accuracy, both the GM (1, 1) model and the proposed Grey-Markov prediction model were adopted to predict China’s import of Russian timbers in 2002-2016 (Table 1), and then forecast that in 2017-2025. The data were extracted from China Forestry Statistical Yearbooks and China Customs Statistical Yearbooks issued in 2002-2016.
Table 1. Trade value, volume and proportion of China’s import of Russian timbers in 2002-2016
|
Year |
Log volume imported from Russia/104 m3 |
Total volume of imported logs/104 m3 |
Proportion /% |
Sawn timber volume imported from Russia/104 m3 |
Total volume of imported sawn timber/104 m3 |
Proportion /% |
Trade value/ billion USD |
|
2002 |
1,480.84 |
2,433.30 |
60.86 |
55.16 |
548.37 |
10.06 |
10.47 |
|
2003 |
1,436.74 |
2,545.55 |
56.44 |
56.12 |
559.81 |
10.02 |
10.41 |
|
2004 |
1,701.64 |
2,630.85 |
64.68 |
80.12 |
605.17 |
13.24 |
14.24 |
|
2005 |
2,004.32 |
2,936.80 |
68.25 |
105.67 |
605.42 |
17.45 |
17.74 |
|
2006 |
2,182.60 |
3,215.30 |
67.88 |
117.43 |
615.31 |
19.08 |
21.46 |
|
2007 |
2,539.57 |
3,713.26 |
68.39 |
158.55 |
655.78 |
24.18 |
29.69 |
|
2008 |
1,866.51 |
2,956.96 |
63.12 |
196.82 |
718.18 |
27.41 |
29.59 |
|
2009 |
1,481.51 |
2,805.93 |
52.80 |
312.05 |
993.52 |
31.41 |
23.36 |
|
2010 |
1,403.55 |
3,434.57 |
40.87 |
436.70 |
1,475.57 |
29.60 |
27.19 |
|
2011 |
1,406.51 |
4,232.10 |
33.23 |
607.33 |
2,155.45 |
28.18 |
34.36 |
|
2012 |
1,118.34 |
3,789.90 |
29.51 |
621.67 |
2,062.86 |
30.14 |
28.46 |
|
2013 |
1,025.78 |
4,516.37 |
22.71 |
702.64 |
2,401.79 |
29.25 |
27.71 |
|
2014 |
1,137.61 |
5,119.00 |
22.22 |
790.21 |
2,565.20 |
30.81 |
28.94 |
|
2015 |
1,167.54 |
4,456.80 |
26.20 |
980.12 |
2,657.70 |
36.88 |
30.16 |
|
2016 |
1,276.03 |
4,687.36 |
27.22 |
1,343.58 |
3,194.33 |
42.06 |
31.50 |
3.1 GM (1, 1) prediction of China’s import of Russian timbers in 2002-2016
Based on the data in Table 1, the GM (1, 1) model was established to predict the trade value of China's import of Russian timbers in 2002-2016. The nonnegative raw series corresponding to time series of t can be expressed as:
$X^{(0)}=(10.47,10.41,14.24,17.74,21.46,29.69,
29.59,23.36,27.19,34.36,28.46,27.71,28.94,30.16
31.50)$.
Applying an AGO to the raw data by formula (3), the accumulated series can be obtained as:
Substituting the above data into formula (4):
$Y=\left[\begin{array}{c}x^{(0)}(2) \\ x^{(0)}(3) \\ \cdots \\ x^{(0)}(15)\end{array}\right]=\left[\begin{array}{c}10.41 \\ 14.24 \\ \cdots \\ 31.50\end{array}\right]$
$B=\left[\begin{array}{cc}-\frac{1}{2}\left(x^{(1)}(1)+x^{(1)}(2)\right) & \\ -\frac{1}{2}\left(x^{(1)}(2)+x^{(1)}(3)\right) & 1 \\ -\frac{1}{2}\left(x^{(1)}(14)+x^{(1)}(15)\right) & 1\end{array}\right]=\left[\begin{array}{cc}-15.675 & 1 \\ -28.000 & 1 \\ \dots & \dots \\ -349.530 & 1\end{array}\right]$
Substituting parameter $\Phi=[a, u]^{T}=\left(B^{T} B\right)^{-1} B^{T} Y=\left[\begin{array}{c}-0.047255 \\ 17.488\end{array}\right]$into formulas (5) and (6), we have:
$\hat{x}^{(1)}(k+1)=\left(x^{(0)}(1)-\frac{u}{a}\right) e^{-a k}+\frac{u}{a}$
$=\left(10.47-\frac{17.488}{(-0.047255)}\right) * e^{0.047255 k}+\frac{17.488}{(-0.047255)}$
Finally, the restored value can be obtained as:
$\hat{X}^{(0)}=\left(\hat{x}^{(0)}(1), \hat{x}^{(0)}(2), \ldots, \hat{x}^{(0)}(15)\right)=(10.47,
18.42,19.31,20.24,21.22,22.25,23.32,24.45
25.64,26.88,28.18,29.54,30.97,32.47,34.04)$
Similarly, China’s import volumes of Russian logs and sawn timers in 2002-2016 were predicted by the GM (1, 1) model. The predicted trade value, log volume, and sawn timber volume are listed in Tables 2-4, respectively.
3.2 Grey-Markov model prediction of China’s import of Russian timbers in 2002-2016
The trade value, log volume, and sawn timber volume predicted by the proposed Grey-Markov model are also listed in Tables 2-4, respectively.
As shown in Tables 2-4, the Grey-Markov model outperformed the GM (1, 1) in relative residual error and prediction accuracy.
For example, the relative residual error of the GM (1, 1) model on the trade value averaged at $\overline{\bar{x}}=\frac{1}{\mathrm{n}-1} \sum | \xi(1)+\cdots+\xi(15)= 6.06%$. The mean accuracy (confidence) of the model was $(1-\bar{x}) * 100 \%=93.94 \%>90 \%= 93.94%>90%$ . After the model was revised by the Markov model, the relative residual error dropped to 1.53%, while the prediction accuracy increased by 4.53% from 93.94% to 98.47%. Obviously, the proposed model is more accurate in forecasting the trade value China’s timber import from Russia.
On the log volume, the revision of the model reduced the relative residual error from 4.10% to 1.87%, and increased the prediction accuracy by 2.23% from 95.90% to 98.13%.
On the sawn timber volume, the revision of the model lowered the relative residual error by 30.17% from 30.55% to 0.38%, and pushed up the prediction accuracy by 30.08% from 69.54% to 99.62%.
Next, the residual errors $\delta(k)$ of the trade value, log volume, and sawn timber volume predicted by the proposed model were divided into three states, respectively (Table 5). On this basis, the states of China-Russia timber trade were determined for each year in 2002-2016 (Table 6).
Table 2. Predicted trade value of China’s import of Russian timbers
|
Year |
Raw data |
GM (1, 1) model |
Grey-Markov model |
||||||
|
Predicted value |
Residual $\delta(k)$ |
Relative residual $\xi$ (%) |
Prediction accuracy (%) |
Predicted value |
Residual $\delta(k)$ |
Relative residual $\xi$ (%) |
Prediction accuracy (%) |
||
|
2002 |
10.47 |
10.47 |
0.00 |
0.00 |
100.00 |
10.47 |
0.00 |
0.00 |
100.00 |
|
2003 |
10.41 |
18.42 |
-8.01 |
-76.95 |
23.05 |
12.92 |
-2.51 |
-24.11 |
75.89 |
|
2004 |
14.24 |
19.31 |
-5.07 |
-35.60 |
64.40 |
13.81 |
0.43 |
3.02 |
96.98 |
|
2005 |
17.74 |
20.24 |
-2.50 |
-14.09 |
85.91 |
19.74 |
-2.00 |
-11.27 |
88.73 |
|
2006 |
21.46 |
21.22 |
0.24 |
1.12 |
98.88 |
20.72 |
0.74 |
3.45 |
96.55 |
|
2007 |
29.69 |
22.25 |
7.44 |
25.06 |
74.94 |
26.99 |
2.70 |
9.09 |
90.91 |
|
2008 |
29.59 |
23.32 |
6.27 |
21.19 |
78.81 |
28.06 |
1.53 |
5.17 |
94.83 |
|
2009 |
23.36 |
24.45 |
-1.09 |
-4.67 |
95.33 |
23.95 |
-0.59 |
-2.53 |
97.47 |
|
2010 |
27.19 |
25.64 |
1.55 |
5.70 |
94.30 |
25.14 |
2.05 |
7.54 |
92.46 |
|
2011 |
34.36 |
26.88 |
7.48 |
21.77 |
78.23 |
31.62 |
2.74 |
7.97 |
92.03 |
|
2012 |
28.46 |
28.18 |
0.28 |
0.98 |
99.02 |
27.68 |
0.78 |
2.74 |
97.26 |
|
2013 |
27.71 |
29.54 |
-1.83 |
-6.60 |
93.40 |
29.04 |
-1.33 |
-4.80 |
95.20 |
|
2014 |
28.94 |
30.97 |
-2.03 |
-7.01 |
92.99 |
30.47 |
-1.53 |
-5.29 |
94.71 |
|
2015 |
30.16 |
32.47 |
-2.31 |
-7.66 |
92.34 |
31.97 |
-1.81 |
-6.00 |
94.00 |
|
2016 |
31.50 |
34.04 |
-2.54 |
-8.06 |
91.94 |
33.54 |
-2.04 |
-6.48 |
93.52 |
|
Year |
Raw data |
GM (1, 1) model |
Grey-Markov model |
||||||
|
Predicted value |
Residual $\delta(k)$ |
Relative residual $\xi$ (%) |
Prediction accuracy (%) |
Predicted value |
Residual $\delta(k)$ |
Relative residual$\xi$ (%) |
Prediction accuracy (%) |
||
|
2002 |
1,480.84 |
1,480.84 |
0.00 |
0.00 |
100.00 |
1,480.84 |
0.00 |
0.00 |
100.00 |
|
2003 |
1,436.74 |
2,023.71 |
-586.97 |
-40.85 |
59.15 |
1,673.62 |
-236.88 |
-16.49 |
83.51 |
|
2004 |
1,701.64 |
1,938.92 |
-237.28 |
-13.94 |
86.06 |
1,588.83 |
112.81 |
6.63 |
93.37 |
|
2005 |
2,004.32 |
1,857.68 |
146.64 |
7.32 |
92.68 |
1,981.34 |
22.98 |
1.15 |
98.85 |
|
2006 |
2,182.60 |
1,779.85 |
402.75 |
18.45 |
81.55 |
2,377.26 |
-194.66 |
-8.92 |
91.08 |
|
2007 |
2,539.57 |
1,705.28 |
834.29 |
32.85 |
67.15 |
2,302.69 |
236.88 |
9.33 |
90.67 |
|
2008 |
1,866.51 |
1,663.84 |
202.67 |
10.86 |
89.14 |
1,787.50 |
79.01 |
4.23 |
95.77 |
|
2009 |
1,481.51 |
1,565.38 |
-83.87 |
-5.66 |
94.34 |
1,689.04 |
-207.53 |
-14.01 |
85.99 |
|
2010 |
1,403.55 |
1,499.8 |
-96.25 |
-6.86 |
93.14 |
1,623.46 |
-219.91 |
-15.67 |
84.33 |
|
2011 |
1,406.51 |
1,436.96 |
-30.45 |
-2.16 |
97.84 |
1,560.62 |
-154.11 |
-10.96 |
89.04 |
|
2012 |
1,118.34 |
1,376.76 |
-258.42 |
-23.11 |
76.89 |
1,026.67 |
91.67 |
8.20 |
91.80 |
|
2013 |
1,025.78 |
1,319.07 |
-293.29 |
-28.59 |
71.41 |
968.98 |
56.80 |
5.54 |
94.46 |
|
2014 |
1,137.61 |
1,263.81 |
-126.20 |
-11.09 |
88.91 |
913.72 |
223.89 |
19.68 |
80.32 |
|
2015 |
1,167.54 |
1,210.86 |
-43.32 |
-3.71 |
96.29 |
1,334.52 |
-166.98 |
-14.30 |
85.70 |
|
2016 |
1,276.03 |
1,160.13 |
115.90 |
9.08 |
90.92 |
1,283.79 |
-7.76 |
-0.61 |
99.39 |
|
Year |
Raw data |
GM (1, 1) model |
Grey-Markov model |
||||||
|
Predicted value |
Residual $\delta(k)$ |
Relative residual $\xi$ (%) |
Prediction accuracy (%) |
Predicted value |
Residual $\delta(k)$ |
Relative residual $\xi$ (%) |
Prediction accuracy (%) |
||
|
2002 |
55.16 |
55.16 |
0.00 |
0.00 |
100.00 |
55.16 |
0.00 |
0.00 |
100.00 |
|
2003 |
56.12 |
102.74 |
-46.62 |
-83.07 |
16.93 |
50.67 |
5.45 |
9.71 |
90.29 |
|
2004 |
80.12 |
126.27 |
-46.15 |
-57.60 |
42.40 |
74.194 |
5.93 |
7.40 |
92.60 |
|
2005 |
105.67 |
155.18 |
-49.51 |
-46.85 |
53.15 |
103.11 |
2.56 |
2.42 |
97.58 |
|
2006 |
117.43 |
190.72 |
-73.29 |
-62.41 |
37.59 |
138.65 |
-21.22 |
-18.07 |
81.93 |
|
2007 |
158.55 |
234.40 |
-75.85 |
-47.84 |
52.16 |
182.32 |
-23.77 |
-14.99 |
85.01 |
|
2008 |
196.82 |
288.07 |
-91.25 |
-46.36 |
53.64 |
236.00 |
-39.18 |
-19.91 |
80.09 |
|
2009 |
312.05 |
354.04 |
-41.99 |
-13.46 |
86.54 |
301.97 |
10.08 |
3.23 |
96.77 |
|
2010 |
436.70 |
435.12 |
1.58 |
0.36 |
99.64 |
383.04 |
53.66 |
12.29 |
87.71 |
|
2011 |
607.33 |
534.76 |
72.57 |
11.95 |
88.05 |
482.68 |
124.65 |
20.52 |
79.48 |
|
2012 |
621.67 |
657.22 |
-35.55 |
-5.72 |
94.28 |
605.68 |
15.99 |
2.57 |
97.43 |
|
2013 |
702.64 |
807.72 |
-105.08 |
-14.96 |
85.04 |
755.65 |
-53.01 |
-7.54 |
92.46 |
|
2014 |
790.21 |
992.69 |
-202.48 |
-25.62 |
74.38 |
940.61 |
-150.40 |
-19.03 |
80.97 |
|
2015 |
980.12 |
1,220.00 |
-239.88 |
-24.47 |
75.53 |
1,167.90 |
-187.78 |
-19.16 |
80.84 |
|
2016 |
1,343.58 |
1,499.40 |
-155.82 |
-11.60 |
88.40 |
1,447.30 |
-103.72 |
-7.72 |
92.28 |
|
State |
Trade value |
Log volume |
Sawn timber volume |
|
E1 |
[-2.51, -0.76) |
[-236.88, -78.96) |
[-187.78, -83.64) |
|
E2 |
[-0.76, 0.99) |
[-78.96, 78.96) |
[-83.64, 20.51) |
|
E3 |
[0.99, 2.74] |
[78.96, 236.88] |
[20.51, 124.65] |
|
Year |
Trade value |
Log volume |
Sawn timber volume |
|||
|
Residual |
State |
Residual |
State |
Residual |
State |
|
|
2002 |
0.00 |
E2 |
0.00 |
E2 |
0.00 |
E2 |
|
2003 |
-2.51 |
E1 |
-236.88 |
E1 |
5.45 |
E2 |
|
2004 |
0.43 |
E2 |
112.81 |
E3 |
5.93 |
E2 |
|
2005 |
-2.00 |
E1 |
22.98 |
E2 |
2.56 |
E2 |
|
2006 |
0.74 |
E2 |
-194.66 |
E1 |
-21.22 |
E2 |
|
2007 |
2.70 |
E3 |
236.88 |
E3 |
-23.77 |
E2 |
|
2008 |
1.53 |
E3 |
79.01 |
E3 |
-39.18 |
E2 |
|
2009 |
-0.59 |
E2 |
-207.53 |
E1 |
10.08 |
E2 |
|
2010 |
2.05 |
E3 |
-219.91 |
E1 |
53.66 |
E3 |
|
2011 |
2.74 |
E3 |
-154.11 |
E1 |
124.65 |
E3 |
|
2012 |
0.78 |
E2 |
91.67 |
E3 |
15.99 |
E2 |
|
2013 |
-1.33 |
E1 |
56.80 |
E2 |
-53.01 |
E2 |
|
2014 |
-1.53 |
E1 |
223.89 |
E3 |
-150.40 |
E1 |
|
2015 |
-1.81 |
E1 |
-166.98 |
E1 |
-187.78 |
E1 |
|
2016 |
-2.04 |
E1 |
-7.76 |
E2 |
-103.72 |
E1 |
Based on Tables 1-5, the state transition probability matrix for the trade value of China’s import of Russian timbers can be established as:
$P_{t r a d e}=\left[\begin{array}{ccc}\frac{3}{5} & \frac{2}{5} & \frac{0}{5} \\ \frac{2}{4} & \frac{0}{4} & \frac{2}{4} \\ \frac{0}{4} & \frac{2}{4} & \frac{2}{4}\end{array}\right]$
Similarly, the state transition probability matrices Plog and Psawlog for log volume and sawn timber volume can be respectively obtained as:
$P_{1 o g}=\left[\begin{array}{ccc}\frac{2}{6} & \frac{1}{6} & \frac{3}{6} \\ \frac{1}{2} & \frac{0}{2} & \frac{1}{2} \\ \frac{0}{2} & \frac{1}{2} & \frac{1}{2}\end{array}\right]$ and $P_{\text {sawlog }}=\left[\begin{array}{ccc}\frac{2}{2} & \frac{0}{2} & \frac{0}{2} \\ \frac{1}{9} & \frac{7}{9} & \frac{1}{9} \\ \frac{0}{2} & \frac{1}{2} & \frac{1}{2}\end{array}\right]$
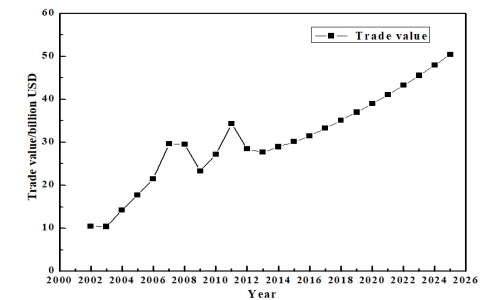
Then, the future trade value of China’s import of Russian timbers in 2017-2025 was predicted based on matrix Ptrade. Since the trade value fell in state E1 in 2016 (Table 6), the value is mostly likely to be in state E2 in 2017, according to the state transition probability matrix. It can be calculated that: USD 3.328 billion. The trade values in the other years were forecasted in a similar manner. Similarly, the volumes of logs and sawn timbers imported from Russia in 2017-2025 were predicted by the proposed model. The predicted trends of trade value, log volume, and sawn timber volume are displayed in Figures 1-3, respectively. It can be seen that the Grey-Markov model could accurately predict the trade value, log volume and sawn timber volume in China’s import of Russian timbers.
3.4 Results analysis
Three major trends were observed in Figures 1-3:
(1) The trade value of China’s timber import from Russia will grow steadily. From 2017-2025, the annual trade value is expected to reach USD 3.328 billion, 3.509 billion, 3.699 billion, 3.899 billion, 4.107 billion, 4.324 billion, 4.555 billion, 4.795 billion, and 5.047 billion. The steady growth is the result of the combined effect of three factors: the complementarity between the huge market demand in China and the abundant forest resources of Russia, the interchangeability between the timber products in China and those in Russia, and the opportunities brought by the CMR economic corridor.
Figure 1. Predicted trend of trade value in 2017-2025
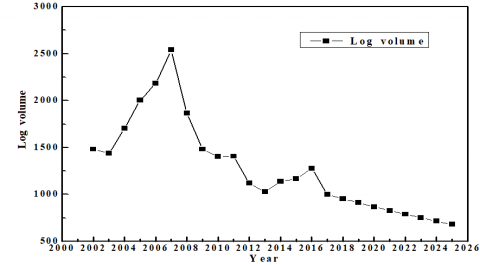
Figure 2. Predicted trend of log volume in 2017-2025
Figure 3. Predicted trend of sawn timber volume in 2017-2025
(2) The log volume will gradually decline from 2017 to 2025. The trend of log volume in 2002-2025 is attributable to three reasons: First, the tariff increase in Russia has pushed up the log price. In 2007, Russia marked up the export tariff on timber products to 10%. The tariff was further increased by 30% each following year. This means Chinese enterprises had to spent more to import the same amount of logs. Thus, the log volume stood at 6.8025 million m3 in 2025, 46.69% smaller than that (12.7603 million m3) in 2016. Second, under the Belt and Road Initiative, Chinese timber processors are investing more overseas, and shifting their focus from processing of primary timbers to the design of woodworks. The timber products which used to be consumed in China are now sold to other countries. Third, China is less dependent on Russian forest resources, thanks to the growing trade of timber products with the countries along the Land and Maritime Silk Roads. For instance, China imported USD 8.33 billion of charcoal, timbers and timber products from these countries.
(3) The sawn timber volume will grow rapidly. Contrary to the trend of log volume, sawn timber volume is expected to increase rapidly from 2017 to 2025. According to the proposed model, the sawn timber volume will soar to 95.0769 million m3 in 2025, up by 607.64% from that in 2016. Meanwhile, Russian sawn timbers will take up a greater proportion in China’s total import of sawn timbers: the proportion will expand from 10.06% in 2002 to 42.06% in 2016. The upward trend of sawn timber volume is driven by the favourable policies in Russia, and the growing demand in China’s infrastructure construction. In fact, most developed countries import more sawn timbers than logs. With a booming economy, China will definitely import more and more sawn timbers from Russia.
In the context of the CMR economic corridor, five suggestions were presented to improve the sustainable development of China-Russia timber trade:
4.1 Government efforts
First, the Chinese government should help its Russian counterpart to enhance the ability of forest management. This ability is crucial to the sustainability of the timber trade: it is impossible to achieve a stable timber supply without sufficiently large forest or a rational mode of forest management. Second, the two governments should cooperate closely in forest development and timber trade. For instance, a long-term agreement may be concluded to form a stable import channel, curb grey customs clearance, and standardize the trade order. Third, the two countries should develop a mutual recognition mechanism of timber products. Every batch of imported timbers must carry a certificate of origin, and should not be approved for processing or re-export before being imported. The legal certification of the exporter is the precondition for the sustainability of timber trade.
4.2 Infrastructure construction
In the context of the CMR economic corridor, infrastructure construction is an important driver of the sustainable development of China-Russia timber trade. The development plan of the CMR economic corridor calls China, Mongolia, and Russia to join hands in developing infrastructure, such as highways, railways, airports and seaports. These facilities are fundamental to the cross-border transport of timber products. China and Russia need to enhance the infrastructure at the border ports (e.g. Heihe, Suifenhe, Manzhouli and Erenhot) by the following measures: attract outside investment on timber processing parks, especially on the deep processing facilities; upgrade existing highways and railways, and build new high-speed railways and border bridges; improve every aspect of the logistics network (e.g. warehousing, transport, and distribution), and enhance the capacities of border ports in timber handling, transport and processing; strengthen the financial, insurance, communication, and information supports to timber trade.
4.3 Trade associations
The China-Russia timber trade is bottlenecked by the shrinking profit margins of Russian timbers and the unbridled competition (e.g. price war) among Chinese importers. To eliminate the bottlenecks, it is necessary to establish trade associations on timber import. These associations should update market demand, supply sources, and port conditions to member enterprises. In this way, the importers could pull together to a good bargain, rather than scramble for resources and partners. In Russia, the trade associations have already assumed the functions of the former forestry bureau. Every month, these associations set a unified export price, and punish any exporter that violates the rule. Once founded, Chinese trade associations should set up a timber tracking system based on green procurement and forest certification. The system will enable Chinese importers and processers trace the source of timbers, and check if the imported timbers have passed rigorous tests. These associations should also publicize the harms of and forbid illegal logging and trade.
4.4 Investment environment
One of the strengths of the CMR economic corridor lies in the investment cooperation on energy, high-tech, manufacturing, agriculture, forestry, and animal husbandry. The sustainable development of China-Russia timber trade hinges on a favourable investment environment. The most direct way to forge such an environment is to scale up foreign direct investment (FDI). In addition to economic benefits, the FDI mitigates the negative impacts of Russia’s tariff policies, alleviates the pressure of timber import, and eases the resource shortage in domestic timber market. The FDI should be directed at the deep processing of timber and exploitation of forest resources. To promote the investment on Russian forestry, the Chinese government ought to increase freight subsidies and reduce value-added tax (VAT) for investment enterprises, and builds an overseas investment insurance system to protect Chinese investors from political risks in Russia.
4.5 Technological innovation
Technological innovation is an important direction for sustainable development of China-Russia timber trade. After two decades of development, both timber exporters and importers have accumulated immense innovative potentials. Numerous high-tech products are available for the renovation of existing forestry enterprises. The technological innovations on timber trade mainly involve information technology (IT), nanotechnology, and biotechnology. The IT innovations, namely, geographic information system (GIS), should be applied to optimize the timber development strategy, and facilitate fire control and supply management in timber logging and transport. The nanotechnology innovations should be adopted to optimize the composition of synthetic timber products. The biotechnology innovations should be employed to promote timber regeneration and biofuel production in wood processing. The governments, enterprises and researchers in China and Russia should work together to integrate innovative technologies into the production and processing of timber products.
This paper is the first attempt to analyse the sustainable development of China’s import of Russian timbers in a systematic manner. After reviewing the current state of China-Russia timber trade, the authors set up a Grey-Markov model to predict the import trend in 2017-2025, and then examined the mechanism of timber trade between China and Russia. Finally, several suggestions were presented to enhance the sustainability of China-Russia timber trade. The main conclusions are as follows:
(1) The Grey-Markov prediction model inherits the merits of the grey system and the Markov chain in fitting volatile small samples, and can objectively reflect the data features of China-Russia timber trade.
(2) Our model predicts that the trade value and sawn timber volume will grow steadily, while the log volume will decrease year by year in 2017-2025. These trends are mainly resulted from the hike in log price and tariffs in Russia.
(3) The prediction accuracies of the Grey prediction model on the trade value, log volume and sawn timber volume of China’s import of Russian timbers in 2017-2025 averaged at 93.94%, 95.90% and 69.54%, respectively. Meanwhile, the Grey-Markov model, which is the Markov-based revision of the Grey prediction model, achieved the mean accuracies of 98.47%, 98.13% and 99.62%, respectively, up by 4.53%, 2.23% and 30.08% from those of the Grey prediction model.
(4) For the sustainability of China-Russia timber trade, both China and Russia should pursue sustainable development, highlight the importance of infrastructure construction, establish trade associations, cultivate a favourable investment environment, and encourage technological innovations.
The authors gratefully acknowledge financial support from Statistical science research program of Hebei province in 2019-2020 (2019HY15) and the doctoral foundation of North China Institute of Aerospace Engineering (BKY-2020-04).
[1] Vilkov, A., Tian, G. (2019). Blockchain as a solution to the problem of illegal timber trade between Russia and China: SWOT analysis. International Forestry Review, 21(3): 385-400. https://doi.org/10.1505/146554819827293231
[2] Fu, J.Y. (2018). We should push countries along “Belt and Road Initiative” to build green supply chain. China and the World: Ancient and Modern Silk Road, 1(1): 1-12. https://doi.org/10.1142/S2591729318500062
[3] Rabena, A.J. (2018). The complex interdependence of China's Belt and Road Initiative in the Philippines. Wiley Online Library: Special Issue: The Pacific Islands in the Twenty‐First Century, 5(3): 683-697. https://doi.org/10.1002/app5.257
[4] Ramage, M.H., Burridge, H., Busse-Wicher, M., Fereday, G., Reynolds, T., Shah, D.U., Wu, G.L., Yu, L., Fleming, P., Densley-Tingley, D., Allwood, J., Dupree, P., Linden, P.F., Scherman O. (2017). The wood from the trees: The use of timber in construction. Renewable and Sustainable Energy Reviews, 68(1): 333-359. https://doi.org/10.1016/j.rser.2016.09.107
[5] Creutzburg, M.K., Scheller, R.M., Lucash, M.S., LeDuc, S.D., Johnson, M.G. (2017). Forest management scenarios in a changing climate: Trade‐offs between carbon, timber, and old forest. Ecological Applications, 27(2): 503-518. https://doi.org/10.1002/eap.1460
[6] Burivalova, Z., Hua, F.Y., Koh, L.P., Garcia, C., Putz, F. (2017). A Critical comparison of conventional, certified, and community management of tropical forests for timber in terms of environmental, economic, and social variables. Conservation Letters, 10(1): 4-14. https://doi.org/10.1111/conl.12244
[7] Jiang, X.M., Chen, Q.R., Guan, D.B., Zhu, K.F., Yang, C.H. (2016). Revisiting the global net carbon dioxide emission transfers by international trade: The impact of trade heterogeneity of China. Journal of Industry Ecology, 20(3): 506-514. https://doi.org/10.1111/jiec.12404
[8] Chaudhary, A., Burivalova, Z., Koh, L.P., Hellweg, S. (2016). Impact of forest management on species richness: global meta-analysis and economic trade-offs. Scientific Reports, 6(1): 23954-23974. https://doi.org/10.1038/srep23954
[9] Carvalho, F.P. (2017). Mining industry and sustainable development: Time for change. Food and Energy Security, 6(2): 61-77. https://doi.org/10.1002/fes3.109
[10] Johanna, J. (2018). Collaborative governance for sustainable forestry in the emerging bio-based economy in Europe. Current Opinion in Environmental Sustainability, 32: 9-16. https://doi.org/10.1016/j.cosust.2018.01.009
[11] Rauter, R., Globocnik, R., Perl-Vorbach, E., Baumgartner, R.J. (2019). Open innovation and its effects on economic and sustainability innovation performance. Journal of Innovation and Knowledge, 4(4): 226-233. https://doi.org/10.1016/j.jik.2018.03.004
[12] Dong, M., He, J. (2018). Linking the past to the future: A reality check on cross-border timber trade from Myanmar (Burma) to China. Forest Policy and Economics, 87: 11-19. https://doi.org/10.1016/j.forpol.2017.11.002
[13] Nathan, I., Chen, J., Hansen, C.P., Xu, B., Li, Y. (2018). Facing the complexities of the global timber trade regime: How do Chinese wood enterprises respond to international legality verification requirements, and what are the implications for regime effectiveness. Forest Policy and Economics, 92: 169-180. https://doi.org/10.1016/j.forpol.2018.05.003
[14] O'Brien, M., Bringezu, S. (2018). European timber consumption: developing a method to account for timber flows and the EU's global forest footprint. Ecological Economics, 147: 322-332. https://doi.org/10.1016/j.ecolecon.2018.01.027
[15] Rasoulinezhad, E. (2016). A new evidence from the effects of Russia’s WTO accession on its foreign trade. Eurasian Economic Review, 8(1): 73-92. https://doi.org/10.1007/s40822-017-0081-1
[16] Rotnem, T.E., Minkova, K. (2017). Putin's 'Eastern Pivot': Divergent ambitions between Russia and China? Evidence from the Arctic. Journal of Global Initiatives, 12(1): 104-139. https://digitalcommons.kennesaw.edu/jgi/vol12/iss1/8
[17] Klinger, J.M., Muldavin, J.S.S. (2019). New geographies of development: grounding China’s global integration. Journal of Territory, Politics, Governance, 7(1): 1-21. https://doi.org/10.1080/21622671.2018.1559757
[18] Uhm, D.P.V., Moreto, W.D. (2018). Corruption within the illegal wildlife trade: a symbiotic and antithetical enterprise. The British Journal of Criminology, 58(4): 864-885. https://doi.org/10.1093/bjc/azx032
[19] Narins, T.P. (2016). Dynamics of the Russia–China forest products trade. Growth and Change, 46(4): 688-703. https://doi.org/10.1111/grow.12108
[20] Zhang, H., Kuuluvainen, J., Lin, Y. (2017). Cointegration in China's log import demand: Price endogeneity and structural change. Journal of Forest Economic, 27: 99-109. https://doi.org/10.1016/j.jfe.2017.03.003
[21] Cao, J.Q., Zhao, Y.R., Chen, W.Q. (2019). Research on potential of sino-russian timber trade--based on gravity model. Market Modernization, (13): 38-40. https://doi.org/10.14013/j.cnki.scxdh.2019.13.019
[22] Guo, L.W., Ding, K.W. (2018). Analysis of substitution and income effects of China's timber demand on Russia. Forestry Economics, (2): 16-19. https://doi.org/10.13691/j.cnki.cn23-1539/f.2018.02.004
[23] Xu, Y., Liu, Y. (2017). Analysis on the current situation of timber trade between Manzhouli and Russia. Marketing Management Review, 11: 30-31. (in Chinese)24.
[24] Yang, J. (2019). Research on the influencing factors and countermeasures of Chinese enterprises' direct investment in Russian forestry. Harbin, Northeast Forestry University.
[25] Lian, X.Y. (2019). Research on Sino-Russian timber trade cooperation. Harbin, Heilongjiang University.
[26] Rotacheva, K. (2018). Russian timber export research. Shenyang, Liaoning University.
[27] The state forestry administration of the People's Republic of China, Ministry of Commerce of the People's Republic of China. A Guide on Sustainable Overseas Forests Management and Utilization by Chinese Enterprises. The central government portal website, http://www.mofcom.gov.cn/aarticle/b/g/200904/20090406191363.html, accessed on June 16, 2020.
[28] Sukhanova, E.I., Shirnaeva, S.Y., Mokronosov, A.G. (2016). Econometric models for forecasting of macroeconomic indices. International Journal of Environmental and Science Education, 11(16): 9191-9205.
[29] Makoni, P.L. (2018). FDI, FPI and institutional quality-evidence from African countries. Academy of Accounting and Financial Studies Journal, 22(5): 1-13.
[30] Kristöfel, C., Strasser, C., Schmid, E., Morawetz, U.B. (2016). The wood pellet market in Austria: a structural market model analysis. Energy Policy, 88: 402-412. https://doi.org/10.1016/j.enpol.2015.10.039
[31] Abreu, A.L.S.D., Gaspar, R.D.O., Lima, M.B.D.O., Nappo, M.E., Trondoli, E.A. (2017). Use of logistic regression model for prediction of non-timber forest products. American Journal of Plant Sciences, 8(11): 2847-2859. https://doi.org/10.4236/ajps.2017.811193
[32] Shuaibu, R.B., Alao, J.S. (2016). Multiple linear regression tree stem volume equations for the estimation of merchantable volume of Azadirachta Indica (neem tree) in North-West Region of Nigeria. International Journal of Forestry and Horticulture, 2(1): 1-10.
[33] Lorek, K.S., Lee Willinger, G. (2016). A multivariate time-series prediction model for cash-flow data. The Accounting Review, 71(1): 81-102. https://doi.org/10.1016/j.adiac.2008.05.010
[34] Bergmeir, C., Hyndman, R.J., Koo, B. (2018). A note on the validity of cross-validation for evaluating autoregressive time series prediction. Computational Statistics and Data Analysis, 120: 70-83. https://doi.org/10.1016/j.csda.2017.11.003
[35] Chen, J., Zeng, G.Q., Zhou, W.N., Du, W., Lu, K.D. (2018). Wind speed forecasting using nonlinear-learning ensemble of deep learning time series prediction and extremal optimization. Energy Conversion and Management, 165: 681-695. https://doi.org/10.1016/j.enconman.2018.03.098
[36] Heinermann, J., Kramer, O. (2016). Machine learning ensembles for wind power prediction. Renewable Energy, 89: 671-679. https://doi.org/10.1016/j.renene.2015.11.073
[37] Yu, M.C., Wang, C.N., Ho, N.N.Y. (2016). A grey forecasting approach for the sustainability performance of logistics companies. Sustainability, 8: 866-883. https://doi.org/10.3390/su8090866
[38] Ye, J., Dang, Y.G., Li, B.J. (2018). Grey-Markov pre diction model base d on background value optimization and central-point triangular whitenization weight function. Common Nonlinear Sci Number Simulat, 54: 320-330. https://doi.org/0.1016/j.cnsns.2017.06.004