Hong Cui | Feng Gao*
© 2020 IIETA. This article is published by IIETA and is licensed under the CC BY 4.0 license (http://creativecommons.org/licenses/by/4.0/).
OPEN ACCESS
This paper attempts to disclose how changes in meteorological conditions affect the diffusion of air pollutants in highly polluted industrial and mining cities. Linfen, the city with the worst air quality in China, was taken as the research object. First, the spatiotemporal distribution of AQI and several air pollutants (i.e. PM2.5, PM10, CO, NO2, SO2 and SO3) in the study area was obtained through interpolation by inverse distance weighting (IDW). Next, the overall air quality and monthly variations of the AQI and the selected pollutants in 2017 were analyzed in details. Finally, the authors probed deep into the temporal distribution, spatial distribution, and meteorological conditions during the process of severe air pollution in the study area, in the light of the data on wind speeds, wind directions and precipitation. The results show that: The AQI in Linfen was high in winter and low in summer. Two peaks were observed on the daily variation curves of AQI and main pollutants near 11:00 and 22:00, respectively. The pollutant levels have similar patterns in spatial distribution: high in southwest and low in northeast. The process of severe air pollution is mainly caused by small average wind speed, weak precipitation, high humidity, and other atmospheric conditions that impede pollutant diffusion (e.g. low altitudes of thermal inversion layer and atmospheric boundary layer (ABL)), as well as stable atmospheric stratification in winter). The strong northwest airflow and precipitation are the direct reasons for the end of the process of severe air pollution. The research provides new insights into the mitigation and elimination of air pollution in industrial and mining cities.
air quality, process of severe air pollution, meteorological conditions, Linfen
Population explosion, resource depletion, and environmental pollution are three defining problems of today’s world. Since the dawn of the 21st century, these problems have severely damaged the global environment, especially in developing countries.
One of the most serious environmental damages is air pollution. The heavy emissions of pollutants into the air have worsened the air quality, and harmed our health and quality of life. What is worse, the growing incidence of air pollution will undermine our living environment, posing a threat to our survival and development [1-4]. As a result, air pollution has become a public concern.
The pollutant level in the air is determined by three factors: the emissions and physical-chemical properties of pollutants, meteorology, and terrain. The latter two factors mutually affect each other. In the plains, the vertical diffusion of pollutants is only limited by the thickness of the atmospheric boundary layer (ABL), while the horizontal diffusion depends on wind speed, wind direction and turbulence intensity. The situation in mountains is far more complex. In a mountainous region, the ABL changes greatly in time and space, under the control of the terrain. The variation in meteorological factors makes air pollution in mountains much more serious than in plains, when the same amount of pollutants is emitted [5-8]. Over the history, many grave pollution incidents occurred in dales, river valleys and plateau basins, namely, the Swiss Plateau, the Los Angeles Basin, Mexico City, the Lower Fraser Valley and the Rhine Valley [9-11].
Linfen has long been one of the most polluted cities in China. However, the small city has not attracted much attention from the academia. It is not yet clear how air pollution evolves and how meteorological conditions affect pollutant diffusion in Linfen. To make up for the gap, this paper probes deep into a typical process of severe air pollution, which occurred from January 1st to January 6th, 2017 in Linfen. The distribution features and change laws of typical air pollutants, namely, PM10, PM2.5, SO2, CO, O3 and NO2, were explored in details, based on the daily and hourly data of pollutant level, wind speed, wind direction, landform and meteorological observations. The research results provide the local environmental department with a good reference for pollution control.
2.1 Study area
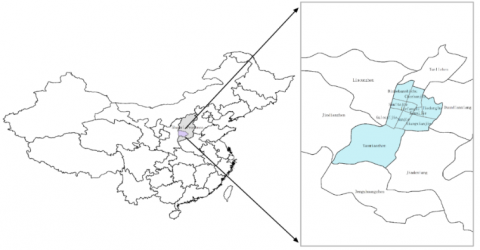
Located in the southwest of Shanxi province, Linfen (N: 35°23’-36°57’; E: 110°22’-112°34’) enjoys a monsoon-influenced semi-humid temperate continental climate. There are four distinct seasons each year, with sufficient precipitation in hot period. The geographical location of the study area is shown in Figure 1.
Figure 1. The geographical location of the study area
Linfen is one of the three main production areas of coking coal in China, and an important new energy and industrial base in Shanxi. Human activities, such as energy exploitation and fuel burning, have exerted an enormous pressure on the local environment. The air pollutants cannot easily diffuse due to the terrain of Linfen: the city is built in a small basin surrounded by mountains [12-14].
In recent years, Linfen has raised high concern over its severe air pollution. In January, 2017, Linfen became the center of attention with the worse Air Quality Index (AQI) in China, as its SO2 level far exceeded the limit. The air pollution has serious impact on local economy and living conditions [15].
2.2 Data sources
The air quality data were downloaded from China National Urban Air Quality Real-Time Publishing Platform. The original data are the daily average of the data collected by six air quality monitoring stations in downtown Linfen (Figure 1), and the 24h monitoring data from January 1st to 6th, 2017. The AQI is the average values of the monitoring data. The levels of PM2.5, PM10, CO, NO2 and SO2 are the hourly average of each pollutant. The O3 level is the 8h sliding average of that pollutant.
The meteorological data in the same period were obtained from the official website of National Meteorological Information Center, China Meteorological Administration. The selected meteorological factors include air pressure, temperature, relative humidity, precipitation, wind speed, and sunshine duration. The data are the 3h average of each factor.
2.3 Methods
(1) Evaluation method
The AQI was calculated based on individual AQI (IAQI) to describe the air quality of Linfen. Ranging from 0 to 500, the AQI is a dimensionless number that quantifies the air quality. The IAQI can be calculated by [16-19]:
$I A Q I_{P}=\frac{I A Q I_{H t}-I A Q I_{L O}}{B P_{H i}-B P_{L O}}\left(C_{P}-B P_{L O}\right)+I A Q I_{L O}$ .
The air qualities indicated by different levels of AQI are listed in Table 1 below.
Table 1. The relationship between AQI and air quality
|
Air quality |
Excellent |
Good |
Light pollution |
Medium pollution |
Heavy pollution |
Severe pollution |
|
Levels |
I |
II |
III |
IV |
V |
VI |
|
AQI |
0~50 |
51~100 |
101~150 |
151~200 |
201~300 |
>300 |
(2) Inverse distance weighting (IDW)
The IDW provides geological information system (GIS) with a convenient and mature interpolation tool to analyze the spatial distribution of environmental pollutants in a region. The assigned values to unknown points are calculated with a weighted average of the values available at the known points [20-23]. The sample points closer to the interpolation point are given greater weight.
The main defect of the IDW is the heavy dependence on the distance from the interpolation point to each sample point. The error often increases with that distance. To overcome the defect, it was defined that, the smaller the power of the distance, the greater the impact on the points farther away. In this way, it is possible to transform discrete points into a continuous smooth surface, which reflect the spatial distribution features of geographical elements [24].
Here, IDW interpolations of AQI, PM2.5, PM10, CO, NO2, SO2 and SO3 were performed on the GIS, giving a visual display of the spatiotemporal distribution of AQI and each pollution index in downtown Linfen.
3.1 Air quality
3.1.1 Overall air quality in 2017
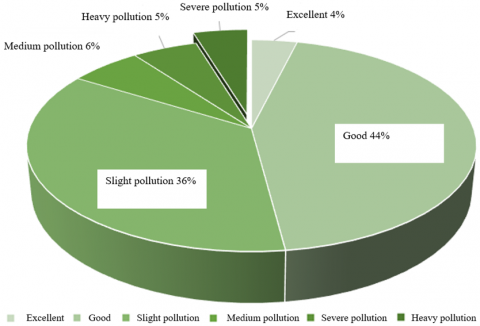
As shown in Figure 2, in 2017, 49% of days had excellent to good air quality, down by 22% from the level of 2016; the number of days with slight to medium pollution increased significantly; there are 22 days with medium pollution throughout the year; 36% of days had slight pollution; 5% of days (20d) had heavy pollution and 5% (20d) had severe pollution.
3.1.2 Monthly variations
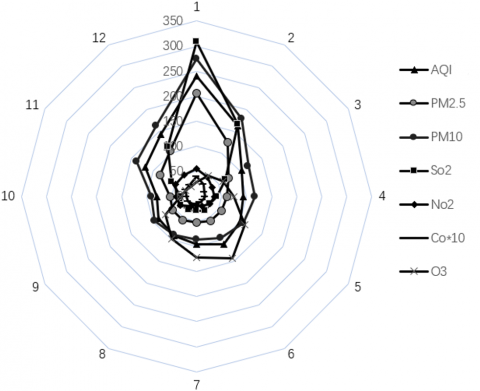
Figure 3 shows the monthly levels of AQI, PM2.5, PM10, SO2, NO2, CO and O3 in 2017. It can be seen that AQI, PM2.5, SO2 and PM10 levels had basically the same monthly changes, all peaking at January. The levels of the four pollutants exhibited clear seasonality: the levels are higher in winter than in other seasons. Among them, SO2 level was far above the limit in January; the 2h average level peaked at 948μg/m3, 7.3 times that of level II. SO2 level was above the limit in autumn and winter, and relatively low in spring and summer.
It can also be seen that the pollutant levels were low from March to October, and high from November to February, i.e. the air quality is good from spring to early autumn, and poor from late autumn to winter. The levels of PM2.5, PM10 and SO2 changed most significantly among all the pollutants.
By seasonal average, the AQI in Linfen was high in winter and low in summer, indicating that the air is more polluted in winter than in summer. Hence, the air pollution in Linfen may be related to the seasonal changes of atmospheric activity or atmospheric circulation. In winter, the meteorological conditions are unfavorable for pollutant diffusion. For example, it is more difficult for pollutants to diffuse due to the radiation inversions of the atmosphere.
Figure 2. Number and percentages of days with different AQI levels in Linfen, 2017
Figure 3. Monthly levels of air pollutants in Linfen, 2017
3.2 Spatiotemporal features
3.2.1 Temporal distribution
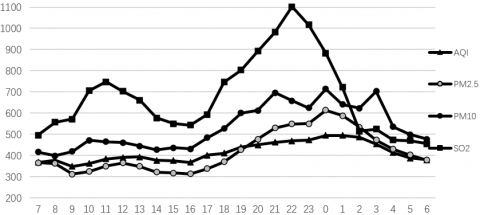
From January 1st to 6th, 2017, Linfen underwent a typical process of severe air pollution. Starting from the early morning of January 1st, the AQI gradually trended up, reaching Level VI (severe pollution). The peak value of AQI was as high as 489. The severe pollution lasted for 6 days. On January 6th, 2017, the AQI dropped to 143, marking the end of the severe air pollution.
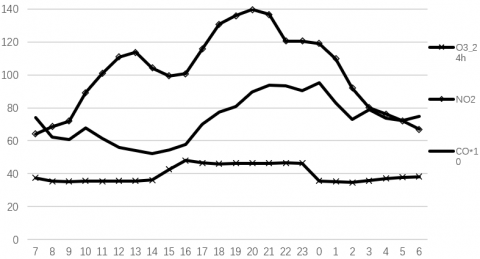
Figure 4 shows the 24h variation of each pollutant based on the 6d average. Two peaks were observed on the curves of SO2, PM2.5 and PM10 near 11:00 and 22:00, respectively. The morning peak is resulted from human activities, while the evening peak is attributable to the rising level of particulate matters, as pollutants cannot diffuse easily but accumulate under low temperatures. In addition, the levels of particulate matters peaked between 23:00 and 00:00, owing to the decrease in solar radiation and weakening of atmospheric turbulence from afternoon to evening.
Figure 4. 24h variation of each pollutant in the process of severe air pollution
The AQI reached the peak in the small hours, and dropped to a low level at 9:00 on the next day. The NO2 level started to drop slowly from 17:00, reached the minimum at 7:00 next morning, and rebounded to a small peak at about 12:00; the small peak was followed by a slight decline, and then a rapid increase until the peak at 19:00.
The O3 level varied in a small daily range. The level of O3 peaked between 15:00 and 22:00, and decreased slowly thereafter. This is because solar radiation is an essential condition for the generation of O3: the O3 level gradually drops, as solar radiation weakens in the afternoon, and stays low when there is no sunlight. Finally, the CO level minimized during 12:00-14:00 and maximized ruing 20:00-23:00.
3.2.2 Spatial distribution
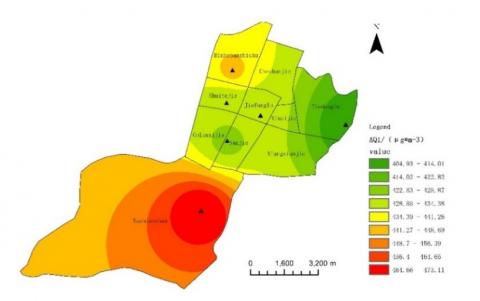
The daily average of each air pollutant from January 1st to January 5th, 2017, was subjected to IDW interpolation analysis on ArcGIS, based on the distribution of air quality monitoring stations in downtown Linfen. It can be seen from Figure 5 that the AQI generally decreased from southwest to northeast. The highest and lowest AQIs were observed in Yaomiao Town in the south, and Lingang Hospital in the east, respectively.
Figure 5. Spatial interpolation map of AQI at each monitoring station during the process of severe pollution
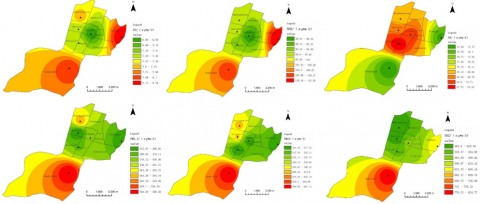
As shown in Figure 6, PM2.5, PM10, SO2 levels were similar as the AQI in spatial distribution: high in southwest and low in northeast; CO and NO2 levels were both high in the southwest and east, with the lowest levels at the center of downtown; the spatial distribution of O3 level was completely opposite to that of NO2 level: the highest level was recorded at the center of downtown, which gradually decreased to the lowest levels in the southwest and north.
Figure 6. Spatial interpolation map of each pollutant at each monitoring station during the process of severe pollution
3.3 Meteorological conditions
In 2017, Linfen experienced 33 days with heavy to severe air pollution (AQI>200) in the heating period. The 231 samples of wind speeds and wind directions. It can be seen that the 33 days was dominated by southeast, southwest and west winds, with an average wind speed of 1.41m/s; 22.6% of these days had no wind. The severely polluted period (January 1-6, 2017) mainly features southern, south, southwest and southeast breezes. During this period, Linfen was affected by the polluted air mass in the south. The pollutants carried by the south wind accumulated in the downtown, failing to diffuse away from the concave terrain. Thus, the air pollution is the combined result of external transmission and unique terrain.
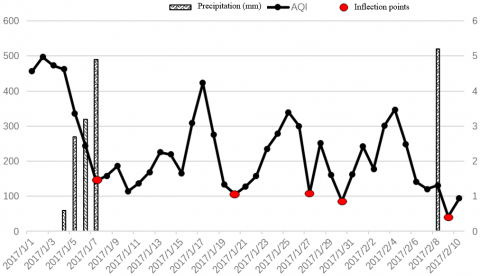
The AQI and precipitation trends from January 1st to February 10th are displayed in Figure 7. Five typical inflection points, i.e. the time point that heavy pollution started to ease, were selected from the figure, namely, January 7th, January 20th, January 27th, January 30th, and February 10th.
At the turning of weather, the wind speed usually has a lag in air purification. Thus, the wind speeds and wind directions of the five days and their eves were summarized. The summary shows northwest wind was the dominant wind direction, with an average speed of 3.03m/s. Besides, moderate to fresh northwest breezes continued to blow at daytime on January 19th, 26th and 29th, making it favorable for pollutants to diffuse. According to the previous research on the diffusion conditions of air pollutants in Linfen, wind speed has a significantly negative correlation with the AQI. As the wind picks up speed, the air has better mobility, and easily dilutes and carries away air pollutants. As a result, the air quality is significantly improved.
On January 4th, the humidity gradually increased, and weak precipitation began in the evening. Before precipitation, it is difficult for air pollutants to diffuse. From 22:00, January 4th to 02:00, January 5th, the temperature dropped slightly and humidity surged up. The slight temperature drop, coupled with soaring humidity, promoted hygroscopic growth of aerosols, enhancing the haze intensity. Meanwhile, the weak pressure field was unfavorable for pollutant diffusion. Despite the precipitation in the morning, the amount of precipitation was too small to create a strong wet removal effect. The precipitation gradually increased in the small hours between January 6th and January 7th, enhancing the removal effect of air pollutants. The strong northwest airflow and precipitation are the direct reasons for the end of the process of severe air pollution.
Figure 7. AQI and precipitation trends from January 1st to February 10th, 2017
(1) In 2017, 80% of days in Linfen had good to lightly polluted air quality; 4% of days (14d) had excellent quality; 37 days witnessed heavy to severe pollutions, most of which concentrated in the heating period. The monthly changes show clear seasonality of AQI, PM2.5, SO2 and PM10 levels. The four pollutants appeared on high levels mainly in January. By seasonal average, the AQI in Linfen was high in winter and low in summer.
(2) From January 1st to 6th, 2017, Linfen underwent a typical process of severe air pollution. Judging by temporal distribution, two peaks were observed on the daily variation curves of SO2, PM2.5 and PM10 near 11:00 and 22:00, respectively. Judging by spatial distribution, the AQI generally decreased from southwest to northeast. The highest and lowest AQIs were observed in Yaomiao Town in the south, and Lingang Hospital in the east, respectively. PM2.5, PM10, SO2 levels were similar as the AQI in spatial distribution: high in southwest and low in northeast
(3) The wind speeds, wind directions and precipitations in the heavily to severely polluted days in the heating season of 2017 were summarized separately, and five typical inflection points, i.e. the time point that heavy pollution started to ease, were selected for further analysis. The analysis shows that the heavily to severely polluted days were dominated by southeast, southwest and west breezes and low precipitation; the weather at the inflection points was dominated by northwest wind: moderate to fresh northwest breezes at daytime, accompanied by a surge in precipitation.
(4) The process of severe air pollution is mainly caused by small average wind speed, weak precipitation, high humidity, and other atmospheric conditions that impede pollutant diffusion (e.g. low altitudes of thermal inversion layer and ABL, as well as stable atmospheric stratification in winter) [25]. The strong northwest airflow and precipitation are the direct reasons for the end of the process of severe air pollution.
(5) In the future, the environmental department should strengthen cooperation with the meteorological department. Based on weather forecast, the plans for adverse meteorological conditions should be deployed in advance, and measures should be taken to reduce the emissions of surface pollution sources (e.g. limit production, motor vehicle control and dust control), aiming to mitigate or eliminate serious pollutant overruns.
This work was supported by Science and Technology Innovation Project of Higher Education, Shanxi Province (Grant No.: 2019L0456), Educational Science Planning of Shanxi Province (Grant No.: GH-19203) and the Ningxia Natural Science Foundation (Grant No.: 2019AAC03134).
[1] Ahmed, A., Hakim, A., Becker, A. (2018). Evaluation of eczema, asthma, allergic rhinitis and allergies among the Grade-1 children of Iqaluit. Allergy, Asthma & Clinical Immunology, 14(1): 9-22. https://doi.org/10.1186/s13223-018-0232-2
[2] Buyantuyev, A., Wu, J., Gries, C. (2010). Multiscale analysis of the urbanization pattern of the Phoenix metropolitan landscape of USA: time, space and thematic resolution. Landscape and Urban Planning, 94(3-4): 206-217. https://doi.org/10.1016/j.landurbplan.2009.10.005
[3] Anderson, H.R., Butland, B.K., van Donkelaar, A., Brauer, M., Strachan, D.P., Clayton, T., van Dingenen, R., Amann, M., Brunekreef, B., Cohen, A., Dentener, F., Lai, C., Lamsal, L.N., Martin, R.V., ISAAC Phase One, Phase Three study groups. (2012). Satellite-based estimates of ambient air pollution and global variations in childhood asthma prevalence. Environmental Health Perspectives, 120(9): 1333-1339. https://doi.org/10.1289/ehp.1104724
[4] Anenberg, S.C., Henze, D.K., Tinney, V., Kinney, P.L., Raich, W., Fann, N., Malley, C.S., Roman, H., Lamsal, L., Duncan, B., Martin, R.V., van Donkelaar, A., Brauer, M., Doherty, R., Jonson, J.E., Davila, Y., Sudo, K., Kuylenstierna, J.C.I. (2018). Estimates of the global burden of ambient PM2.5, ozone, and NO2 on asthma incidence and emergency room visits. Environmental Health Perspectives, 126(10): 107004. https://doi.org/10.1289/EHP3766
[5] Asher, I., Pearce, N. (2014). Global burden of asthma among children. The International Journal of Tuberculosis and Lung Disease, 18(11): 1269-1278. https://doi.org/10.5588/ijtld.14.0170
[6] Duncan, B.N., Martin, R.V., Staudt, A.C., Yevich, R., Logan, J.A. (2003). Interannual and seasonal variability of biomass burning emissions constrained by satellite observations. Journal of Geophysical Research: Atmospheres, 108(D2): ACH-1-ACH-22. https://doi.org/10.1029/2002JD002378
[7] Li, X., Ma, Y., Wang, Y., Liu, N., Hong, Y. (2017). Temporal and spatial analyses of particulate matter (PM10 and PM2.5) and its relationship with meteorological parameters over an urban city in northeast China. Atmospheric Research, 198: 185-193. https://doi.org/10.1016/j.atmosres.2017.08.023
[8] Fung, W.Y., Wu, R. (2014). Relationship between intraseasonal variations of air pollution and meteorological variables in Hong Kong. Annals of GIS, 20(3): 217-226. https://doi.org/10.1080/19475683.2014.945480
[9] Li, L., Qian, J., Ou, C.Q., Zhou, Y.X., Guo, C., Guo, Y. (2014). Spatial and temporal analysis of Air Pollution Index and its timescale-dependent relationship with meteorological factors in Guangzhou, China, 2001-2011. Environmental Pollution, 190: 75-81. https://doi.org/10.1016/j.envpol.2014.03.020
[10] Shen, C.H., Li, C.L., Si, Y.L. (2015). A detrended cross-correlation analysis of meteorological and API data in Nanjing, China. Physica A: Statistical Mechanics and Its Applications, 419: 417-428. https://doi.org/10.1016/j.physa.2014.10.058
[11] Mead, M. I., Castruccio, S., Latif, M. T., Nadzir, M. S. M., Dominick, D., Thota, A., Crippa, P. (2018). Impact of the 2015 wildfires on Malaysian air quality and exposure: A comparative study of observed and modeled data. Environmental Research Letters, 13(4): 044023. https://doi.org/10.1088/1748-9326/aab325
[12] Olszowski, T. (2016). Changes in PM 10 concentration due to large-scale rainfall. Arabian Journal of Geosciences, 9(2): 160. https://doi.org/10.1007/s12517-015-2163-2
[13] Qian, Y., Zhou, W., Yu, W., Pickett, S.T. (2015). Quantifying spatiotemporal pattern of urban greenspace: New insights from high resolution data. Landscape Ecology, 30(7): 1165-1173. https://doi.org/10.1007/s10980-015-0195-3
[14] Ahn, K. (2014). The role of air pollutants in atopic dermatitis. Journal of Allergy and Clinical Immunology, 134(5): 993-999.. https://doi.org/10.1016/j.jaci.2014.09.023
[15] Turner, M.G., Gardner, R.H. (2015). Landscape metrics. Landscape Ecology in Theory and Practice, 97-142. https://doi.org/10.1007/978-1-4939-2794-4_4
[16] Yin, Q., Wang, J., Hu, M., Wong, H. (2016). Estimation of daily PM2.5 concentration and its relationship with meteorological conditions in Beijing. Journal of Environmental Sciences, 48: 161-168. https://doi.org/10.1016/j.jes.2016.03.024
[17] Zhang, Q., Jiang, X., Tong, D., Davis, S.J., Zhao, H., Geng, G., Feng, T., Zheng, B., Lu, Z., Streets, D., Ni, R., Brauer, M., van Donkelaar, A., Martin, R., Huo, H., Liu, Z.,Pan, D., Kan, H., Yan, Y., Lin, J., He, K., Guan, D. (2017). Transboundary health impacts of transported global air pollution and international trade. Nature, 543(7647): 705-709. https://doi.org/10.1038/nature21712
[18] Zhou, W., Huang, G., Cadenasso, M.L. (2011). Does spatial configuration matter? Understanding the effects of land cover pattern on land surface temperature in urban landscapes. Landscape and Urban Planning, 102(1): 54-63. https://doi.org/10.1016/j.landurbplan.2011.03.009
[19] Huang, G. (2015). PM2.5 opened a door to public participation addressing environmental challenges in China. Environmental Pollution, 197: 313-315. https://doi.org/10.1016/j.envpol.2014.12.001
[20] Xue, T., Zheng, Y., Tong, D., Zheng, B., Li, X., Zhu, T., Zhang, Q. (2019). Spatiotemporal continuous estimates of PM2.5 concentrations in China, 2000-2016: A machine learning method with inputs from satellites, chemical transport model, and ground observations. Environment International, 123: 345-357. https://doi.org/10.1016/j.envint.2018.11.075
[21] Savage, M.O. (2013). Insulin-like growth factors, nutrition and growth. Nutrition and Growth, 106: 52-59. https://doi.org/10.1159/000342577
[22] Xie, Y., Wang, Y., Zhang, K., Dong, W., Lv, B., Bai, Y. (2015). Daily estimation of ground-level PM2.5 concentrations over Beijing using 3 km resolution MODIS AOD. Environmental Science & Technology, 49(20): 12280-12288. https://doi.org/10.1021/acs.est.5b01413
[23] Lacey, F.G., Marais, E.A., Henze, D.K., Lee, C.J., van Donkelaar, A., Martin, R.V., Hannigan, M.P., Wiedinmyer, C. (2017). Improving present day and future estimates of anthropogenic sectoral emissions and the resulting air quality impacts in Africa. Faraday Discussions, 200: 397-412. https://doi.org/10.1039/c7fd00011a
[24] Cao, S., Zhao, W., Guan, H., Hu, D., Mo, Y., Zhao, W., Li, S. (2018). Comparison of remotely sensed PM2.5 concentrations between developed and developing ountries: Results from the US, Europe, China, and India. Journal of Cleaner Production, 182: 672-681. https://doi.org/10.1016/j.jclepro.2018.02.096
[25] Van Donkelaar, A., Martin, R. V., Brauer, M., Hsu, N.C., Kahn, R.A., Levy, R.C., Lyapustin, A., Sayer, A.M., Winker, D.M. (2016). Global estimates of fine particulate matter using a combined geophysical-statistical method with information from satellites, models, and monitors. Environmental Science & Technology, 50(7): 3762-3772. https://doi.org/10.1021/acs.est.5b05833