Lia Marchi* | Ernesto Antonini | Valentina Orioli | Steve Evans
© 2020 IIETA. This article is published by IIETA and is licensed under the CC BY 4.0 license (http://creativecommons.org/licenses/by/4.0/).
OPEN ACCESS
Being widely responsible for environmental degradation, industry represents a key asset to manage for a more sustainable and healthier living environment. However, factories affect more than just the physical sphere of the landscape, also impacting social and economic spheres as their intense perceptual-aesthetic interferences with the scenery can disturb neighbors and damage corporate images. In the recent past, policy-makers, practitioners and communities have demonstrated that the harmonization of industry with the landscape can produce several positive effects. In this framework, multicriteria systems to assess the impact have been developed, but they are mainly focused on reducing negative environmental effects rather than perceptual ones, while a holistic approach appears to be needed. Therefore, a method of analyzing how facilities interfere with the landscape is proposed, along with the development of a set of strategies to lessen detrimental effects on the physical, perceptual-aesthetic and social/cultural dimensions of the landscape. This paper presents the main outputs of the research, including the structure of the assessment system and a catalog of case studies selected for good design practices, from which general mitigation tactics have been retrieved. The result is a protocol composed of an assessment system and a design support tool available to companies and designers to be inspired by.
corporate identity, environmental impact assessment, green factories, mitigation, rating system, tactics, visual impact
Since industry is a vital part of development and wealth creation, but it accounts for over 35% of the global energy demand and 17% of global greenhouse gas emissions [1], it plays a major role in the path towards a more sustainable, healthy and smart living environment [2-4]. Over the last 20 years, the sustainability of urban and natural systems has taken on considerable importance [5], especially within the European strategy for a low-energy and low-emission future [6]. Hence, the recent EU Industrial Policy Strategy particularly stresses low-carbon and circular economy [7].
Within the same framework, a broad view of landscape has taken root in EU planning policies, following the European Landscape Convention statements that the social, perceptual and cultural dimensions are also important in territorial development [8]. Nonetheless, these kinds of impacts of factories on people’s everyday landscape are still little considered compared to energy and atmosphere domains.
Actually, over the last decades tools and guidelines have been developed for lessening the impact of industrial buildings on the landscape, but they are mainly focused on its natural dimension. Whereas issues like the visual impact of facilities, disruption of place identity and negative externalities on companies are often omitted [9, 10].
Therefore, the research aims to define a method for analyzing and increasing the factories’ compatibility with the landscape through a holistic approach that considers all the dimensions involved.
The structure of the paper is as follows: in Section 2 we present the issue of factories’ compatibility with the landscape, introducing their major impacts and comparing the current perception of the topic in literature and in practice. In Section 3 we describe the general methodology of the research, which the subsequent sections detail only in part. Then, we declare the principal assumptions and limitations of the study. In Section 4 we introduce the system of credits we developed for the impact analysis and the identification of the major issues to be addressed. In Section 5 we illustrate the construction of a best practice repertoire, from which an inventory of impact reduction tactics is extracted in order to support good design. In Section 6 we briefly present the application of the protocol developed on a case study. Lastly, in Section 7 we offer concluding remarks and possible further developments of the study.
Industrial sites significantly affect the quality of the landscape that host them, interfering with the sustainable development of territories. Factories impact both the tangible dimension of the landscape – the environment – and its more “intangible” characteristics, like visual order, attractiveness and territorial identity. Hence, consistent with the complexity of the notion, the paper refers to “landscape” as a broad and multifaceted concept made of natural, perceptual-aesthetic and cultural/social joint dimensions [8, 11].
First, factories affect the natural sphere of the landscape. Manufacturing processes, facility construction, operations and generated traffic flows are greatly responsible for harmful emissions and natural resource depletion that upset the ecosystem’s balance, both on global and local scales [12, 13]. According to the European Environmental Agency, industry generates air emissions like greenhouse gases (CO2) and acidifying pollutants (SOx), but also chemicals hazardous for human health like NOx, PM10 and heavy metals; water pollutants like nitrogen and phosphorous; soil contaminants; and waste production [14]: e.g. in 2015 energy use in industry and industrial processes was responsible for 19.6% of EU dioxin and furans; and for 42.84% of EU polychlorinated biphenyl emissions.
However, beyond the well-known physical detrimental effects [1, 3, 7, 15, 16], other kinds of disturbances are worth being considered. That is, the more qualitative and subjective impacts produced on communities by the spatial and social proximity of factories.
In the past century ineffective planning rules and short-term company perspectives contributed to shape the landscape of today, which is often characterized by conflicting relations between factories and the scenery. Perceptual-aesthetic impacts of industrial constructions particularly occur at the site level and mostly refer to: visual disorder; morphological and color disharmony; lack of spatial associations with the context; anonymous and ineffective design [10, 17-21]. The issue is clearly visible in several Mediterranean regions where production facilities are often banal and repetitive constructions, scattered in a disorderly fashion throughout the territory, roughly contrasting with the high-quality rural surroundings [20-23].
As a result, some psychophysical disturbances can be engendered on neighbors. To this regard, despite the paucity of literature on the topic applied to factories, it is plausible referring to similar studies on the visual impact of man-made objects in the landscape: in general terms, the kind of disturbance perceived by those living nearby is often associated with a disruption in the sense of place [24, 25]. Interestingly, the correlation between the proximity and degree of acceptance of a construction does not always exist: literature provides some evidences of “inverse NIMBY syndrome” when the human intervention has some positive environmental implications [26]. This means that badly designed and environmentally hazardous factories not only bother neighbors, but the companies themselves: beyond obvious costs and externalities, shoddy environmental practices affect social perception and company image [3]. In turn, company attractiveness influences territorial competitiveness, which emerges as a central theme for planners and decision makers [5].
Hence, when it comes to sustainable development, factories’ compatibility with the landscape merits great attention.
2.1 Perception of the issue in literature and in practice
In the last 40 years, the interest of researchers, policy-makers and practitioners in sustainable factories has increased, especially due to the harshening of global environmental problems [13, 27].
Literature and regulations have pushed the manufacturing sector towards more sustainable behaviors. Both research and public policies stressed eco-efficiency as a strategy to save up to 80% of manufacturing energy demand and reduce primary material use at building and process levels [1, 15, 28, 29]. Accordingly, penalties for lack of compliance, tax benefits and economic incentives have been implemented [13]. Gradually, tools for the assessment of companies’ environmental performance have spread, focusing both on processes (e.g. Dow Jones Sustainability Index, GRI Reporting Framework, IChemE Sustainability Metrics) and buildings themselves (BREEAM, CASBEE, LEED).
Besides, research on visual and social impacts of human interventions on the landscape have been undertaken, but mostly referring to Renewable Energy Source (RES) projects and rural buildings [10, 18, 30-33]. Though still limited, perceptual-aesthetic aspects related to industrial assets have taken on importance, and some early guidelines dealing with morphological and color harmonization have been developed [18, 34, 35].
In parallel, companies’ environmental awareness has also increased [36]. This has been driven on the one hand by economic factors, like increasing energy costs [27, 28], and on the other by stakeholders’ and consumers’ awareness of ethical and environmental issues. Sustainability has therefore become a long-term key for competitiveness [9, 13, 37]. Consequently, promoting good environmental performance has become equally important for business as the attitude itself: Corporate Social Responsibility has spread [9] and design quality – historically limited to company headquarters –has gradually also been applied to manufacturing sites [38, 39]. Examples of corporate identity projects (mostly automotive and textile industries) have been featured in architectural magazines [37], showing the increasing relevance of green marketing policies. However, an exaggerated attention to visual quality can transform into mere “beautification” [32], “greenwashing” or “Disneyfication” of the work space [9] if not effectively followed by the adoption of environmentally friendly practices.
Despite positive emerging trends, more efforts should be made to mitigate the impact of factories on the landscape, adopting a holistic approach that combines all the dimensions involved.
Starting from findings in the literature, the basic assumption is that harmonization between factories and the landscape is necessary not only to protect the environment and the surrounding communities but also to promote companies and regional competitiveness.
Hence the research deals with the landscape compatibility of factories, trying to fill the gap in tools for mitigating their impact. The objective is to provide an assessment and design support tool to analyze the problem in its complexity and identify case-by-case adaptable strategies to mitigate the unwanted effects of both existing and new factories. The scope is helping companies to define their project according to their functional requirements, spending capacity and aesthetic preferences consistent with their values.
To do this, the method we came up is divided into three activities:
(1). Identification of a comprehensive list of impacts generated on the landscape by industrial facilities. Then, selection of suitable indicators to measure individual impacts and their weighted effects. Then creation of a consistent system of credits to find problems and prioritize interventions.
(2). Collection of exemplary case studies as reference for the impact mitigation. The activity provides a catalog of best practices which an inventory of general mitigation tactics is extracted from.
(3). Development of a protocol that combines the System of credits (1) with the Catalog of best practices (2). Then, testing of the tool on the facilities of a leading Italian agri-food company in order to identify the major weaknesses and devise some mitigation scenarios.
The paper summarizes activity 1 and focuses on activity 2. While they have been undertaken in parallel and informed each other, activity 3 was performed later as it derives from the previous two.
3.1 Limitations
Given the complexity of the topic and the many disciplines involved, some limitations of the field of study were put in place.
Since environmental impact assessments of factories have been extensively examined and several tools are available to mitigate unwanted effects, the study focuses on the perceptual-aesthetic interferences that conversely are still little considered. The objective is to incorporate these latter classes of aspects within a coherent assessment framework.
Moreover, a geographical and functional restriction is applied. Among industrial sectors, the study focuses on the agri-food business in Italy. First, because it often involves high energy and resource-consuming processes, as well as practices that compromise the quality of the ecosystem [34]. Second, because there is a close and socially shared relationship between the processing of edible goods and the quality of the environment they originate from. In fact, recent phenomenon of gastronomic tourism proves that space and place of production matter for marketing purposes [40], as demonstrated by many impressively designed and sustainable wineries [33, 41, 42]. Last, because many agri-food buildings are scattered throughout the country close to rural areas or high-quality landscapes. Hence the impact on the quality of such sensitive sceneries is significant.
The first activity carried out is based on a review of scientific literature, regulations and trade publications in order to pinpoint recurrent impacts of industrial facilities on the landscape.
Table 1 shows an extract of the impacts found grouped by scale of occurrence (site, building, process) and associated with topical areas. Six out of seven assessment areas refer to U.S. GBC LEED – one of the leading systems for rating building sustainability – while the category perceptual-aesthetic aspect (PA) is based on specific literature [11, 43].
Additional data per impact have been collected in separate sheets: detailed description of possible causes and effects of the considered phenomena; examples of real-life cases; thresholds and parameters set by specific policies and regulations; indicators to measure the effects.
This in-depth analysis found that the environmental impacts and their indicators are quantifiable, shareable and internationally accepted. However, the perceptual-aesthetic indicators are more difficult to determine due to the qualitative nature of human perception, which makes it difficult to be measured by a quick, objective and shared methodology [30]. In fact, it often requires field surveys and involves both the critical judgment of experts and communities’ preferences [11, 44-46]. Currently only few methods and metrics are made available for “quantifying” subjective interferences of construction on the landscape, even in procedures that requires it like the Environmental Impact Assessment [30, 47]. Furthermore, the different nature of impacts and their indicators lead to one of the oldest controversies of indicator theory: “should we aggregate apples and oranges?” [48]. Therefore, the study needs to find a proper tool to manage this complexity.
Table 1. Extract from the list of impacts
|
Topical area |
Impact |
|
|
Site |
LT - location and transportation |
Soil consumption |
|
Traffic flow and atmospheric emissions |
||
|
Spatial disorder |
||
|
SS - sustainable sites |
Environmental fragmentation |
|
|
Reduction of ground permeability |
||
|
PA - perceptual-aesthetic aspects |
Decontextualization |
|
|
Fragmentation of scenery |
||
|
Visual disorder |
||
|
Lack of outdoor quality spaces |
||
|
Noise pollution |
||
|
PA - perceptual-aesthetic aspects |
Mono-functionality |
|
|
Building |
EA - energy and atmosphere |
Energy consumption |
|
EQ - indoor environmental quality |
Hygro-thermal discomfort |
|
|
VOC emission |
||
|
PA - perceptual-aesthetic aspects |
Low design quality and visual detraction |
|
|
PA - perceptual-aesthetic aspects |
Lack of indoor relation spaces |
|
|
SS – sustainable site |
Groundwater pollution |
|
|
EA - energy and atmosphere |
GHG emissions |
|
|
|
… |
... |
For this purpose, an investigation of the existing building performance assessment tools was carried out. The study shows that several frameworks, tools, building codes and voluntary standards have been developed to foster green design both in building new factories and retrofitting old facilities [3, 49, 50]. Among these, Multi-Criteria Analysis (MCA) and especially Green Building Rating Systems (GBRSs) can be useful to design, construct and operate green buildings, since different sustainability categories are taken into account with a comprehensive approach [12, 51]. GBRSs provide a structured multi-criteria methodology through which different needs and mutual relations can be mapped and weighed for the whole project. In other words, they can help to prioritize intervention strategies in complex systems. Thus, the idea is to resort to GBRSs as frameworks within which impacts of different nature and their synergies can be managed.
However, a review carried out by the authors of available GBRSs points out that only few of them fit the comprehensive assessment of industrial assets. The most common systems in the world [51] were scanned looking for appropriate schemes. Table 2 shows the ones that have been selected because specifically designed to assess impacts of factories (S) or those that are multipurpose and adaptable which have already been used to certify industrial facilities (A). In addition, for each selected scheme the share of credits referable to perceptual-aesthetic interferences (PA) has been estimated: the rate is based on the recurrence of the keywords “amenity,” “open space,” and “external view” in the credit list of each GBRS.
The result of the analysis supports the literature’s findings, that these protocols are mainly oriented towards new constructions and focused on environmental aspects. They consider the ecological dimension of the landscape, but tend to omit the cultural, visual and socio-economic implications [52].
Table 2. GBRSs relevant to industry
|
Green Building Rating System (version) |
Specific or Adaptable |
Percentage of PA credits |
|
BREEAM (International New Construction 2016) |
A |
0% |
|
CASBEE (for Buildings New Construction 2014) |
A |
4% |
|
DGNB (New Industrial Buildings1 + CORE 14) |
S |
11% |
|
GREEN STAR (Industrial v1 2010, update 2014) |
S |
2% |
|
LEED India (Green Factory Building v1.0) |
S |
4% |
|
LEED US (v4 BD+C: Warehouses and Distribution Centers, update 2016) |
A |
7% |
|
Protocollo ITACA (Edifici industriali, update 2012) |
S |
3% |
|
1 The industrial scheme is in Deutsch; the CORE 14 in English. |
||
The checklist of each GBRS presented in Table 2 was then matched to the list of impacts (Table 1) in order to find the most suitable protocol for the study. LEED v4 for BD+C: Warehouses and Distribution Centers was chosen due to the highest number of credits corresponding to the impacts and one of the higher ratio of PA credits. It was also preferred for its global spread and ease of use [53]. Additionally, LEED schemes are designed to be easily modified and updated, so even new assessment areas can be created [54].
Therefore, since some impacts weren’t linked to an existing LEED credit, a new evaluation area addressing the perceptual-aesthetic interferences was developed. Given the paucity of factory-targeted tools for analyzing PA aspects, an assumption of similarity was made and the many studies referred to RES projects and rural buildings (§2.1) were compared in order to extract a comprehensive set of credits. The eight new credits are:
Then, each new credit was associated with at least one indicator suitable to measure it. This can be quantitative, qualitative or semi-quantitative, depending on the nature of the specific impact. As some authors suggest that the subjective perception of aesthetic characteristics largely depends on cultural codes [55, 56], less strict limit between quantitative and non-quantitative gauges were surmised. Last, each new credit was described in an ad hoc card, similar to those of LEED.
The system dedicated to new construction consists of 62 credits: Integrated Process (1 credit); Location and Transportation (8); Sustainable site (7); Water efficiency (7); Energy and Atmosphere (11); Materials and resources (7); Indoor environmental quality (10); Innovation (2); Regional Priorities (2); Perceptual-aesthetic aspects (8). The version of the System dedicated to redevelopment projects counts 42 credits. In both, some credits are mandatory strategies, “Prerequisites,” which are expected to be fulfilled by any project undertaking the assessment.
The second research activity involves the study of exemplary facilities that successfully reduced their impact on the landscape, increasing their level of compatibility.
A systematic analysis was conducted to identify and examine the case studies. Given the scarcity of academic papers found and the newness of the topic, not only academic studies were accessed, but also trade literature like corporate websites and guidelines, international design competitions and awards (e.g. Green Company Award Industria e Paesaggio; GBE Factory; Brand&Landscape Award). The investigation involved only secondary sources in order to obtain the broadest possible picture of the actual scenario in a short time.
Case studies were selected according to a functional classification, so food factories were preferred. However, projects from other industrial sectors were chosen for the relevance of some adopted practices and their replicability in agri-food sector. The following selection criteria were applied (Boolean operation “OR”):
In all 63 case studies were selected. Food facilities account for 19.2% of the collection, while other recurrent factories are: beverage industry (9.6%), wineries (13.5%), warehouses (7.7%), automotive (5.7%) and textile industry (5.7%). Furthermore, cases were categorized by location, preferring domestic projects but including also remarkable international examples: 88% from the EU area (of which 32 out of 46 are Italian) and 12% from extra-EU (mostly USA). A sample list of the analyzed case studies is included [57].
5.1 Two level of analysis
The cases were examined using the system of credits set up in activity 1. Specifically, two subsequent increasingly in-depth types of analysis were performed, namely “horizontal” and “vertical.”
The horizontal analysis comes first and helps to understand if the case fits the protocol scheme and if it is worth expanding on. To do this, an Excel spreadsheet was created: case studies are noted in the first column, while topical areas and corresponding credits from the System of credits are placed in the first line. Prerequisites are not included. The table is filled in according to a binary code (on/off): based on initial information collected for the project, the credits relevant to the case are identified. Figure 1 shows an extract of the dynamic spreadsheet: for each topical area column, the number of “on” credits out of the total is calculated.
The cases having more than 2 credits “on” are then submitted to “vertical” analysis, which consists in a card for each case where the information is organized in six sections over two pages, as shown in Figure 2. The collection of all these data sheets forms the catalog of best practices.
Since the aim is to allow easy comparison among the cases, Page 1 provides general information on the project, such as function, geographical and chronological references, and “intervention type” that indicates whether it is new construction (NC) or redevelopment (R).
Besides additional information, Page 2 describes the good practices the project has been selected for. The summary in Section 4 helps readers to choose whether the case is worth expanding on according to their needs. The bulleted list in Section 5 describes the good practices within their context and their cross-links. Section 6 acts as navigator for the catalog, summarizing the good practices by keywords and referring them to the credits from the System, hence leading up to the following step (the tactic extraction).
To date, about the 65% of case studies from the horizontal analysis passed to the vertical investigation.
5.2 Tactics
Since the good practices are collected in an Excel spreadsheet, they can be easily extracted by topical area and linked to the corresponding credits. This is preparatory to the tactics’ extraction: two rules for the inductive process have been set.
The first rule is when two or more practices have a common denominator (Figure 3) a general tactic is formulated. For example, both practices “green hill” and “land depression” operate on landform: the former to hide the height of the building, the latter to reduce the visual exposure of the complex. As a result, “landform” is derived as a tactic. The second case is when the same practice recurs more than twice in the database, so it is considered common enough to be generalized.
Figure 1. Horizontal analysis: In black the “on” credits
Figure 2. Vertical analysis: first page (above) and second page (below)
Figure 3. From practices to tactics
Then, each tactic is described in a specific card that contains (Figure 4): the general description of the mitigation strategy (what it is, how it applies, etc.); the list of practices that originated it and in turn the reference to their source case studies. Further pieces of information are provided on the right side of the page: the kind of project it applies to (NC and/or R) and the codes of related tactics. The latter is particularly important, as it connects tactics to each other: e.g. PA1.3 (landform) can be linked with EA2.5 (ground thermal properties) and PA3.1 (noise screen with landform). In other words, a green hill is beneficial simultaneously to visually mitigate the building, take advantage of the thermal inertia of the ground and reduce the noise from/towards the surroundings.
Hence, from over 300 good practices selected in the collection of case studies, 97 general tactics were devised. An extract of the latter is shown in Table 3, while the extended list is found in the paper [57].
Figure 4. Tactic card
Table 3. Extract of tactics and number of linked practices for the PA area
|
Credit |
Tactic |
Practices |
|
Morphological Harmonization |
screen |
7 |
|
predominance of horizontal dimension |
1 |
|
|
landform |
4 |
|
|
underground building |
2 |
|
|
shape of local constructions |
1 |
|
|
shape of landscape features |
2 |
|
|
volume division into minors |
1 |
|
|
consistent layout |
3 |
|
|
Color and Material Harmonization |
color from context |
6 |
|
texture from context |
3 |
|
|
green roof |
2 |
|
|
materials from context |
2 |
|
|
color/graphic design |
2 |
|
|
Noise Pollution |
screen with landform |
1 |
|
technological screen |
2 |
|
|
… |
… |
… |
The third study activity is briefly presented in order to give a practical example of the application of the research.
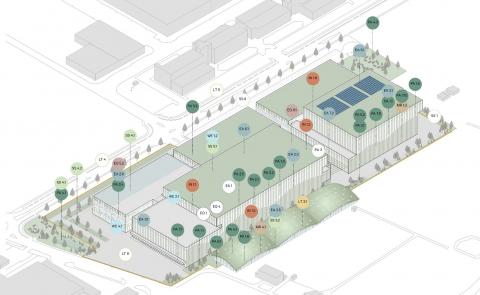
The System of credits developed and catalog of best practices are combined into a protocol that serves both as an assessment and a design support tool. The tool is based on an iterative process of application and progressive refinement of the results: before, the company – or practitioners on its behalf – applies the System in order to detect the major interferences of the industrial facility on the landscape. Then, on this basis, the firm consults the catalog in order to select proper tactics or even specific practices useful for the mitigation of impacts (Figure 5).
Figure 5. Scenario 3 for the Orogel case study. The colored circles contain the code of the tactics applied
A newly built industrial plants of Orogel, one of Italy’s leading companies in the sector of frozen vegetables, was selected to test the tool. The protocol was thus applied three times to the new facility, located in Cesena (I). Consequently, three scenarios of mitigation for the project were developed, characterized by an increasing level of compatibility with the landscape: the first scenario achieved 42/127 points in the assessment by the System and consist of a mere cosmetic intervention on the building’s façade. The second earned 57/127 and the main design element is a set of visual screens which also accomplish environmental functions (e.g. shading, ventilation cavity, solar energy production). The third scored 79/127 and proposed a volumetric extension of the project, helping to visually mitigate it and achieve further environmental performance (e.g. thermal mass and green roof for micro-climate regulation) and host new social activities even for the neighbors (e.g. spaces for cultural events and a public park).
So far, the research has provided two major results which take the form of autonomous deliverables. On the one hand, a checklist of credits for analyzing factories’ impact on the landscape, whose novelty is the combination of quantitative (environmental effects) and qualitative aspects (social and visual interferences) that until now have been separately addressed in the literature. The need for connection among the different dimensions of the landscape has also been proven in practice, e.g. by the synergies between tactics PA1.3, PA3.1 and EA2.5 (§5.2).
On the other hand, the catalog of practices and tactics retrieved from the collection of case studies represents a remarkable outcome of the study. In fact, the catalog of best practices can be accessed by practitioners and companies to find inspiration in some exemplary projects fitting their specific case. The structure of the catalog makes it easy to navigate and select information for specific tactics/credits/topical areas.
Moreover, the horizontal analysis of case studies offers an interesting cross-sector overview that underscored some recurrent collocations between functions and tactics: like existing building with camouflage; food industries with underground facilities; wineries with territorial iconic identity; energy facilities with multifunctionality. The more frequently found patterns are shown by Marchi et al. [57].
Furthermore, the application of the protocol to an Italian case study acts as an example for subsequent users, beyond testing the soundness of the proposal.
Furthermore, the paper supports some general findings. First, the traditional duality between environmental and aesthetic-perceptual impacts of factories that has been found in the literature seems to be slowly counteracted by exemplary companies heading in the “right” direction, as shown in the catalog of best practices.
Second, the list of best practices and tactics shows that the adopted practices are not often so innovative themselves, but rather it is their combination that makes a case successful. To this purpose, the prizes won and the public acceptance earned that have been recorded in the cards provide evidence of the rate of success for each case study.
Last, even though specifically designed for the agri-food industry, the study seeks to provide a foundation that can be adapted to and implemented in others sectors, even if each industry has its own characteristics and needs.
This study was made possible and supported by Orogel Società Cooperativa Agricola, a leading company in the agri-food sector, based in Cesena (Italy).
[1] Davé, A., Salonitis, K., Ball, P., Adams, M., Morgan, D. (2016). Factory eco-efficiency modelling: Framework application and analysis. Procedia CIRP, 40: 214-219. http://dx.doi.org/10.1016/j.procir.2016.01.105
[2] Philipp, M., Schumm, G., Peesel, R.H., Walmsley, T.G., Atkins, M.J., Schlosser, F., Hesselbach, J. (2016). Optimal energy supply structures for industrial food processing sites in different countries considering energy transitions. Energy, 146: 112-123. https://doi.org/10.1016/j.energy.2017.05.062
[3] Azapagic, A., Perdan, S. (2000). Indicators of sustainable development for industry: A general framework. Process Safety and Environmental Protection, 78(4): 243-261. http://dx.doi.org/10.1205/095758200530763
[4] COP21. (2015). UN Climate Change Conference. Paris.
[5] Papa, R., Gargiulo, C., Russo, L., Franco, S. (2017). On the relationship between the promotion of environmental sustainability and the increase of territorial competitiveness: The Italian case. International Journal of Sustainable Development and Planning, 12(4): 655-666. http://dx.doi.org/10.2495/SDP-V12-N4-655-666
[6] European Commission, COM. (2010). Europe 2020. A strategy for smart, sustainable and inclusive growth. Brussels.
[7] European Commission, COM. (2017). Investing in a smart, innovative and sustainable Industry. A Renewed EU Industrial Policy Strategy, Brussels.
[8] Council of Europe. (2000), European landscape convention, n.176/2000, Florence.
[9] Cavallo, M., Degli Esposti, P., Konstantinou, K. (eds) (2012). Green Marketing per le aree industriali. Metodologie, strumenti e pratiche. Franco Angeli, Milano.
[10] Busquets i Fabregas, J. (eds) (2007). Buenas Práticas de Paisaje: líneas de guia (Trad. ita: Per una corretta visione del paesaggio: linee guida), Generalitat de Catalunya, Barcelona.
[11] Tudor, C. (2014). An Approach to Landscape Character Assessment. Natural England.
[12] Kaur, G.P., Gupta, P., Syal, M. (2016). Adoption of green practices in industrial buildings: an action research on capacity building of stakeholders towards green factories. Int. J. Sustain. L. Use Urban Plan., 3(2): 1-12. http://dx.doi.org/10.24102/ijslup.v3i2.703
[13] Despeisse, M. (2013). Sustainable manufacturing tactics and improvement methodology: A structured and systematic approach to identify improvement opportunities. School of Applied Science, Cranfield University.
[14] European Environmental Agency. Indicators 2015. https://www.eea.europa.eu/data-and-maps/indicators/#c0=10&c12-operator=or&b_start=0&c12=industry, accessed on Dec. 18, 2018.
[15] Despeisse, M., Davé, A., Litos, L., Roberts, S., Ball, P., Evans, S. (2016). A Collection of Tools for Factory Eco-efficiency. Procedia CIRP, 40: 542-546. http://dx.doi.org/10.1016/j.procir.2016.01.130
[16] IGBC. (2009). IGBC Green Factory Building. Rating System Version 1.0.
[17] Yang, M., Evans, S., Vladimirova, D., Rana, P. (2017). Value uncaptured perspective for sustainable business model innovation. Journal of Cleaner Production, 140(Part 3): 1794-1804. http://dx.doi.org/10.1016/j.jclepro.2016.07.102
[18] Osservatorio Pianificazione Urbanistica e Qualità Paesaggio (2015). Linee guida per i paesaggi industriali in Sardegna (Guidelines for industrial landscape in Sardegna region). Attached to D.G.R. n. 24/12 19.05.2015 of Sardegna region.
[19] Cassatella, C., Gambino, R. (2013). Linee guida per i paesaggi industriali, un’esperienza di ricerca. XXXIV Conferenza italiana di scienze regionali, Palermo, pp. 1-14.
[20] Provincia di Bologna. (2008). APEA - Aree Produttive Ecologicamente Attrezzate. Linee guida. Bologna.
[21] Armondi, S. (2013). Fare paesaggio con gli insediamenti produttivi. Riti e ritmi. XXXIV Conferenza Italiana di scienze regionali, Palermo, pp. 1-18.
[22] Cipriani, L. (2012). Vita e morte del paesaggio industriale. Indagini e proposte per la marca trevigiana in trasformazione. Università degli Studi di Trento, Trento.
[23] Capra, G.L., Gulli, L. (2008). Nuovi modelli per gli insediamenti produttivi. In: Parma bellezza capitale. Proposte di qualità urbana, raccolta degli atti dei convegni organizzati dall’Agenzia per la Qualità Urbana e Architettonica, Ed. Parma, pp. 83-106.
[24] Mueller, C.E., Keil, S.I., Bauer, C. (2017). Effects of spatial proximity to proposed high-voltage transmission lines: Evidence from a natural experiment in Lower Saxony. Energy Policy, 111: 137-147. http://dx.doi.org/10.1016/j.enpol.2017.09.023
[25] Devine-Wright, P., Howes, Y. (2010). Disruption to place attachment and the protection of restorative environments: A wind energy case study. Journal of Environmental Psychology, 30(3): 271-280. https://doi.org/10.1016/j.jenvp.2010.01.008
[26] Warren, C.R., Lumsden, C., O’Dowd, S., Birnie, R.V. (2005). “Green on green”: Public perceptions of wind power in Scotland and Ireland. Journal of Environmental Planning and Management, 48(6): 853-875. http://dx.doi.org/10.1080/09640560500294376
[27] Dombrowski, U., Riechel, C. (2013). Sustainable factory profile: a concept to support the design of future sustainable industries. In: 11th Global Conference on Sustainable Manufacturing, Berlin, pp. 72-77.
[28] May, G., Stahl, B., Taisch, M. (2016). Energy management in manufacturing: Toward eco-factories of the future - A focus group study. Applied Energy, 164: 628-638. http://dx.doi.org/10.1016/j.apenergy.2015.11.044
[29] Delpiano, A., Trombetti, G. (2011). EnergiApea. Vincere la sfida energetica. Tipografia metropolitana Bologna, Bologna.
[30] Tolli, M., Recanatesi, F., Piccinno, M., Leone, A. (2016). The assessment of aesthetic and perceptual aspects within environmental impact assessment of renewable energy projects in Italy. Environmental Impact Assessment Review, 57: 10-17. http://dx.doi.org/10.1016/j.eiar.2015.10.005
[31] Maehr, A.M., Watts, G.R., Hanratty, J., Talmi, D. (2015). Emotional response to images of wind turbines: A psychophysiological study of their visual impact on the landscape, Landscape and Urban Planning, 142: 71-79. http://dx.doi.org/10.1016/j.landurbplan.2015.05.011
[32] Rodrigues, M., Montañés, C., Fueyo, N. (2010). A method for the assessment of the visual impact caused by the large-scale deployment of renewable-energy facilities. Environmental Impact Assessment Review, 30(4): 240-246. http://dx.doi.org/10.1016/j.eiar.2009.10.004
[33] Tassinari, P., Torreggiani, D., Benni, S., Dall’Ara, E. (2013). Landscape quality in farmyard Design: An approach for Italian wine farms. Landscape Research, 38(6): 729-749. http://dx.doi.org/10.1080/01426397.2012.746653
[34] Tandy, C. (1975). Landscape of Industry. Leonard Hill Books, London.
[35] Boeri, C., Braz de Oliveira, I., Giambruno, M.C. (2013). Colour design and industrial landscape. In III CITCEM Conference, Berlin.
[36] Ball, P., Jolly, M. (2015). Sustainable manufacturing for the future. Investigating the current and future landscape across the food and drink industry in Great Britain. Cranfield University.
[37] Yang, M., Vladimirova, D., Evans, S. (2017). Creating and Capturing Value Through Sustainability. Research-Technology Management, 60(3): 30-39. http://dx.doi.org/10.1080/08956308.2017.1301001
[38] The Plan Art & Architecture. (2011). Corporate Identity. Architecture in detail. Scripta Maneant, Reggio Emilia.
[39] Qualizza, G. (2012). Inventare lo spazio di una green factory. In: Cavallo, Degli Esposti, Konstantinou (eds) Green marketing per le aree industriali. Metodologie, strumenti e pratiche, Franco Angeli, Milano, pp. 220-238.
[40] Giovanardi, M., Lucarelli, A. (2018). Sailing through marketing: A critical assessment of spatiality in marketing literature. Journal of Business Research, 82: 149-159. http://dx.doi.org/10.1016/j.jbusres.2017.09.029
[41] Torquati, B., Giacchè, G., Venanzi, S. (2015). Economic analysis of the traditional cultural vineyard landscapes in Italy. Journal of Rural Studies, 39: 122-132. http://dx.doi.org/10.1016/j.jrurstud.2015.03.013
[42] Harea, O., Eplényi, A. (2017). Viticultural Landscape Patterns – Embedding contemporary wineries into the landscape site. Landscape architecture and art, 10: 7-14. http://dx.doi.org/10.22616/j.landarchart.2017.10.01
[43] Landscape Institute and IEMA. (2013). Guidelines for Landscape and Visual Impact Assessment (GLVIA), 3rd ed., Routledge, London; New York.
[44] Rosley, M.S.F., Lamit, H., Rahman, S.R.A. (2013). Perceiving the aesthetic value of the rural landscape through valid indicators. Procedia - Social and Behavioral Sciences, 85: 318-331. http://dx.doi.org/10.1016/j.sbspro.2013.08.362
[45] Butler, A., Berglund, U. (2014). Landscape character assessment as an approach to understanding public interests within the European landscape convention. Landscape Research, 39(3): 219-236. http://dx.doi.org/10.1080/01426397.2012.716404
[46] Cassatella, C., Peano, A. (eds). (2011). Landscape Indicators: Assessing and Monitoring Landscape Quality. Springer, Dordrecht.
[47] Sowińska-Świerkosz, B. (2016). Index of Landscape Disharmony (ILDH) as a new tool combining the aesthetic and ecological approach to landscape assessment. Ecol. Indic., 70: 166-180.
[48] Jesinghaus, J. (2000). On the Art of Aggregating Apples and Oranges. In: EVE Workshop, pp. 2-20.
[49] Ball, P., Despeisse, M., Evans, S., Greenough, R.M., Hope, S.B., Kerrigan, R., Levers, A., Lunt, P., Murray, V., Oates, M.R., Quincey, R., Shao, L., Waltniel, T., Wright, A.J. (2013). Factory modelling: Combining energy modelling for buildings and production systems, IFIP Adv. Inf. Commun. Technol., 397 (Part 1): 158-165. http://dx.doi.org/10.1007/978-3-642-40352-1_21
[50] Miah, J.H., Griffiths, A., McNeill, R., Poonaji, I., Martin, R., Morse, S., Yang, A., Sadhukhan, J. (2015). Creating an environmentally sustainable food factory: A case study of the Lighthouse project at Nestlé. In: Procedia CIRP, 26: 229-234. http://dx.doi.org/10.1016/j.procir.2014.07.030
[51] Say, C., Wood, A. (2008). Sustainable rating systems around the world. CTBUH Journal, 2: 18-29.
[52] Gottero, E., Cassatella, C. (2017). Landscape indicators for rural development policies. Application of a core set in the case study of Piedmont Region. Environmental Impact Assessment Review, 65: 75-85. http://dx.doi.org/10.1016/j.eiar.2017.04.002
[53] Doan, D.T., Ghaffarianhoseini, A., Naismith, N., Zhang, T., Ghaffarianhoseini, A., Tookey, J. (2017). A critical comparison of green building rating systems. Building and Environment, 123: 243-260. http://dx.doi.org/10.1016/j.buildenv.2017.07.007
[54] U.S. GBC (2013). LEED v4. Impact Category and Point Allocation Development Process.
[55] Cassatella, C. (2011). Assessing Visual and Social Perceptions of Landscape’, in. In: Cassatella and Peano (eds) Landscape Indicators: Assessing and Monitoring Landscape Quality, Springer: Dordrecht, pp. 105-140.
[56] De Botton, A. (2006). The Architecture of Happiness. Pantheon Books, New York City.
[57] Marchi, L., Antonini, E., Evans, S. (2018). Landscape compatibility of factories: From practice to tactics. WIT Transaction on The Built Environment, 183: 5-36. http://dx.doi.org/10.2495/ARC180031