Hayder M. Abbas | Mohammad Yaseen Shaker | Mohamed F. Al-Dawody*
© 2026 The authors. This article is published by IIETA and is licensed under the CC BY 4.0 license (http://creativecommons.org/licenses/by/4.0/).
OPEN ACCESS
This study numerically investigates the effects of waste tire pyrolysis oil (WTO)–diesel blends and variations in compression ratio (CR) on the performance, combustion, and emission characteristics of a single-cylinder compression-ignition engine using the validated Diesel-RK simulation tool. Diesel fuel was compared with 10% and 20% WTO blends at full load and 1500 rpm, followed by CR optimization (15:1–19:1) for the 20% WTO blend. The results show that brake-specific fuel consumption (BSFC) increased by 1.73% and 3.32% for 10% and 20% WTO blends, respectively, while brake thermal efficiency (BTE) decreased marginally by 0.2–0.3%. NOx emissions were reduced by 3.91% and 10.13%, accompanied by a moderate increase in smoke opacity. Increasing the CR from 15:1 to 19:1 increased peak cylinder pressure by 30.7% and reduced ignition delay from 11.15 °CA to 8.31 °CA; however, NOx emissions increased by 21.9%. These results demonstrate that CR is an effective tuning parameter for WTO combustion but introduces a clear NOx–smoke trade-off.
waste tire pyrolysis oil, variable compression ratio, diesel engine simulation, NOx emissions, combustion optimization, sustainable fuels
Several factors, including the shortage of fossil fuels, rising oil prices, and environmental concerns, have driven extensive research into sustainable alternative fuels. Waste tire pyrolysis oil (WTO) has been considered a possible alternative to diesel fuel in compression-ignition engines. The management of waste tires has become an increasingly serious issue, with waste tire generation worldwide estimated at 1.5 billion pieces each year [1, 2]. As a result of their recalcitrance to decomposition, they accumulate as waste in landfills or are incinerated, leading to contamination of soil, air, and water [3, 4]. Pyrolysis has been a sustainable, thermally efficient approach for converting waste tires into pyrolysis oil, gas, and char. Among these, WTO is an alternative or supplemental fuel for diesel engines owing to its high calorific value (up to 45.6 MJ/kg) [5]. Tire pyrolysis oil, a type of tire oil, is derived from the pyrolysis of waste tires to generate fuel. Besides being high in energy and extraordinarily cheap, oil is consistently high in viscosity, so even the crude diesel engine immediately got a terrible rating for blowing pollutants out the tailpipe. As a result, attempts have been made to blend the WTO with diesel fuel to improve engine efficiency and reduce emissions, without affecting existing engine technologies [6, 7]. WTO has a higher density (up to 923 kg/m³), viscosity (up to 4.35 mm²/s), and a lower cetane number (CN) (as low as 42–48), although its high value of heating contrasted to traditional diesel and is required to be used in admixed form.
The behavior of the WTO in compression-ignition engines under various operating conditions has been investigated in several studies. For instance, Kapilan et al. [8] conducted a comparative experimental analysis of Butylated Hydroxy Anisole (BHA), an antioxidant, in dewatering waste tire oil-diesel combinations in a compression-ignition engine. They reported that a BHA content of 1000 ppm in D80WTO20 increased brake thermal efficiency (BTE) (32.92%) and reduced emissions (NOx: 1406 ppm, CO: 0.224%). Karagöz [9] presented a laboratory inquiry to assess the performance of a diesel engine operated on waste tire oil (WTO)-dexlite combinations. The engine operated over 1500–2100 rpm with WTO mixes at 10, 20, and 30%. The engine achieved a maximum output power of 2.32 kW with a specific fuel consumption of 0.48 kg/kWh. Additionally, Kondor et al. [10] conducted laboratory tests on a VCR diesel engine operated with blends of WTO and diesel. The performance and emissions of WTO blends at 10%, 25%, 50%, and 75% were optimized in the investigation. The results showed that BTE increased and fuel consumption decreased at high compression ratios (CRs). Furthermore, Kumaravel et al. [11] investigated the effectiveness of tire-derived fuel (TDF) in diesel blends at 10%, 30%, and 50%. The performance results revealed that TDF10% was the best source for power production, achieving a maximum increase of 4.9% over diesel. Furthermore, Öner et al. [12] investigated the combustion behavior, performance, and emissions of an engine using blends of crude pyrolytic oil (CPO) with diesel and butanol in an experimental study. Preliminary tests on seven blends showed good engine performance, and the peak brake-specific fuel consumption (BSFC) was 425.35 g/kWh for PO30Bu20CN1. Another study was conducted by other researchers on an experimental basis, using diesel blends containing 10% waste plastic oil (P10) and 10% waste tire oil (T10) in diesel engines. The findings showed that the BSFC of P10 was 0.33 kg/kWh at 100% load, and the value of BSFC for T10 was 0.35 kg/kWh. The highest cylinder pressure at full load was 71.39 bar for P10 and 72.01 bar for T10 [13]. In addition, Mohiuddin et al. [14] conducted laboratory analysis of a dual-fuel engine operating on a mixture of waste tire-derived pyrolysis oil and biogas. They investigated five fuel blends with different biogas flow rates, reporting improvements in BSFC and reductions in BTE; NOx emissions were reduced by up to 11.14% with biogas addition. Also, Nabi et al. [15] conducted an experimental investigation of the combustion behavior of crude tire fuel blends in a diesel engine. They used 5% and 10% tire fuel blends with diesel, and the results showed that peak cylinder pressure decreased by 6.69% and net heat release increased by 19.33%. Similarly, Öner et al. [12] examined the effects of tire pyrolysis oil blends on diesel engine performance. They experimented with WTO10 and WTO20 and observed a 4% decrease in BTE and a 15.3% increase in CO emissions at full load. Isah et al. [7] experimentally examined the engine output (performance) and emissions of waste tire oil, diesel, and Glycine max biodiesel blends. They experimented with different mixtures and found that tire oil at up to 30% performed comparably to diesel, with only a marginal increase in emissions and fuel consumption. In addition, Ghareeb and Anjal [16] experimented with aromatic-enriched WTO combustion performance. Burning rate for SRTO at 25 ℃ was 1.93 [3180.03 mm²/s, and the apparent activation energy for SRTO was 37.2 KJ/mol. Pote and Patil [17] conducted a trial analysis of a diesel engine using blends of WTO, diesel, and hydrogen. At 2000 rpm, the W15 blend produced 184 Nm of torque, 62 kW of power, and 332 g/kWh of BSFC. Adding hydrogen to W15H produced a higher performance of 189.2 Nm, 64 kW of power, and 327 g/kWh BSFC, with lower CO, CO2, and NOx emissions. Moreover, Pote and Patil [18] conducted an experimental study on a Mitsubishi S4S-DT engine operating on a blend of WTO and diesel at 2.5%, 5%, 7.5%, and 10% proportions. Results indicate a marginal power decrement and a 10% increase in BSFC at 40% load, and CO2 emissions are marginally lower by 1% for the WTO10 blend. Besides that, Dasari et al. [4] reported research on the performance and emissions characteristics of the engine using pyrolysis fuel from waste plastics blended with RON 90 gasoline. Testing revealed that 1.05 hp was the maximum power at 4000 rpm using the PE-RON 90:20:80 mixture, with minimal CO emissions (0.78% at 6000 rpm). In a similar line, Saravanan et al. [19] conducted an experimental investigation on the effect of BHA antioxidants on waste tire oil-diesel blends as fuel in a compression-ignition engine. At 1000 ppm BHA in D80WTO20, the BTE improved to 32.92%, and emissions went down to 1406 ppm of NOx and 0.224% of CO. Doğan et al. [20] investigated the combustion performance of crude TDF blended with diesel in a single-cylinder diesel engine. Higher peak cylinder pressure was observed by 6.69% for a 10% TDF blend and by 19.33% greater gross heat emission than diesel, while ignition delays were almost the same. Furthermore, Kaimal et al. [21] conducted experiments to analyze the combustion characteristics, performance, and emissions of a diesel engine that used a blend of 10% WTO and diesel fuel. Results demonstrated that W 10 enhanced in-cylinder pressure (71.56 bar at full load) and heat release rate, while resulting in a 10.9% decrease in soot and a 13.7% decrease in CO.
Previous investigations of diesel engines fueled with tyre pyrolysis oil (WTO) consistently indicate an increase in BSFC and a deterioration in BTE with increasing WTO content, primarily due to its low cetane number, high aromatic content, and inferior atomization behavior. Although reductions in NOx emissions are frequently reported, these benefits are often counterbalanced by increased smoke emissions, while combustion characteristics remain highly inconsistent across studies due to variations in engine configuration and operating conditions. More critically, the majority of experimental and numerical studies assess either the WTO blend ratio or engine parameters, most notably the CR, under fixed or isolated conditions, with some relying on dual-fuel enhancement strategies to offset performance penalties. This fragmented research approach fails to capture the coupled, interactive effects of fuel properties and engine calibration, thereby limiting the development of robust, transferable, and practically applicable optimization strategies for WTO-fueled compression-ignition engines.
To address these limitations, the present study introduces a validated numerical framework that systematically integrates WTO blend ratio analysis (10% and 20%) with CR optimization over a wide range (15:1–19:1). The novelty of this work lies in its unified and holistic approach, which simultaneously evaluates fuel chemistry effects, engine parameter tuning, and performance–combustion–emissions trade-offs within a single modeling environment. The study is designed to quantify the influence of WTO blends on engine performance, combustion behavior, and emissions relative to conventional diesel fuel, while elucidating the role of CR variation in improving WTO combustion efficiency and stability. By establishing application-oriented optimization strategies that balance efficiency gains with emission constraints, this work provides actionable insights to advance the practical calibration and deployment of WTO as a sustainable alternative fuel in compression-ignition engines.
The numerical analysis was designed to isolate and quantify the effects of two primary variables: the engine's CR and the concentration of WTO in diesel blends. The investigation employed two WTO-diesel blends: a 10% WTO/90% diesel blend (by volume) and a 20% WTO/80% diesel blend. Pure diesel served as the baseline reference for all comparative analyses. The methodology's core revolved around Diesel-RK, a sophisticated simulation environment renowned for its advanced thermodynamic and chemical kinetic models that accurately represent the complex processes in internal combustion engines.
Table 1. Diesel and waste tire pyrolysis oil (WTO) blends characteristics [7, 8, 19-23]
|
Characteristics |
Unit |
Diesel |
10% WTO |
20% WTO |
Standard ASTM |
|
C |
% |
87 |
86.7 |
86.4 |
- |
|
H |
% |
12.6 |
12.9 |
13.2 |
- |
|
O |
% |
0.4 |
0.3 |
0.16 |
- |
|
lower heating value (LHV) |
MJ/kg |
45.84 |
45.16 |
44.47 |
D240 |
|
cetane number (CN) |
- |
53.4 |
53.23 |
52.06 |
D976 |
|
Density @323 K |
kg/m3 |
830 |
832 |
833.4 |
D1298 |
|
Kinematic viscosity |
mm2/s |
2.24 |
2.36 |
2.47 |
D445 |
|
Molecular mass |
g/mol |
190 |
196 |
199.4 |
- |
The critical properties of the fuels used in this study, detailed in Table 1, were meticulously compiled from various established literature sources [7, 8, 19-23] to ensure they represent realistic, averaged values for WTO. These properties, including elemental composition, lower heating value (LHV), cetane number (CN), density, and viscosity, are the primary drivers of the simulated combustion and emission formation processes. The engine under virtual examination is a Kirloskar TAF-1, a workhorse single-cylinder, direct-injection, four-stroke diesel engine commonly used in research and small-scale applications. Its complete technical specifications, which are essential for configuring the simulation accurately, are provided in Table 2 [19].
Table 2. Engine technical details [19]
|
Engine Type |
Kirloskar Diesel Engine |
|
Type of product |
TAF-1 |
|
Kind of engine |
DI, 4-stroke, one-cylinder |
|
Bore x Stroke |
87.5 mm × 110 mm |
|
Compression ratio |
17.5 |
|
Rated power |
4.41 kW |
|
Cooling type |
Water cooling. |
|
Engine speed |
1500 rpm |
|
Injection type |
Injecting directly |
|
Injection pressure |
160 bars |
|
Diameter of nozzle |
0.15 mm |
|
Timing of injection |
20 ° BTDC |
The spray, combustion, NOx formation, and soot models employed in Diesel-RK are based on well-established and widely validated formulations reported in the literature. In the present study, the influence of WTO is incorporated through its specific physicochemical properties, including cetane number, viscosity, elemental composition, molecular mass, and LHV. These properties directly influence ignition delay, spray atomization, evaporation behavior, heat release phasing, and emission formation, allowing the distinct combustion characteristics of WTO to be accurately represented without altering the fundamental structure of the governing models [24].
The Diesel-RK software's fuel-property-driven approach uses input characteristics (cetane number, viscosity, density, LHV, elemental composition) to capture fuel-specific combustion behavior. This enables accurate WTO simulation without model restructuring, as properties directly influence spray behavior, ignition timing, heat release, and emissions.
3.1 Spray assessment model
The fuel journey from the injector nozzle into the combustion chamber is critical, as it determines the characteristic (quality) of the air-fuel mixture. The spray model tracks discrete parcels of fuel, known as Elementary Fuel Masses (EFMs), using velocity-penetration equations [25].
WTO's higher viscosity (2.47 mm²/s vs. 2.24 mm²/s for diesel) results in poorer atomization, larger droplets, and altered spray development, captured through viscosity inputs without equation modifications.

Figure 1. Visual figure of the fuel spray
Eq. (1) describes the velocity of an EFM transmitted from the injector to the spray head during a discrete time step, as illustrated in Figure 1.
$\left[\frac{U}{U_0}\right]^{\frac{3}{2}}=1-\frac{l}{l_m}$ (1)
where, $U$ denotes the instantaneous velocity of the EFM, $U_0$ Represents its initial velocity at the injector nozzle, $l$ is the instantaneous distance between the EFM and the injector nozzle, and $l_m$ Corresponds to the maximum penetration length for the EFM at the spray front. The differential Eq. (1) is then in part solved as follows:
$3 l_m\left[1-\left[1-\frac{l}{l_m}\right]^{0.333}\right]-U_o \tau_k=0$ (2)
where, $\tau_k$ denotes the travel time of the EFM to cover the distance $l$ from the injector nozzle; when the EFM attains the spray tip and comes to rest at $l=l_m$. The corresponding travel time is $\tau_k=\tau_m$.
where, $\tau_m$ - duration period for the EFM to reach the spray’s front before finishing.
Eq. (2) can be written as:
$l_{\mathrm{m}}=\mathrm{U}_{\mathrm{o}} \frac{\tau_{\mathrm{m}}}{3}$ (3)
From Eqs. (1)–(3), The instantaneous velocity and EFM length of penetration are determined as follows:
$U=U_o\left[1-\frac{\tau_k}{\tau_m}\right]^2$ (4)
$l=l_m\left[1-\left[1-\frac{\tau_k}{\tau_m}\right]^3\right]$ (5)
Therefore, solving Eq. (1) yields the travel time and dynamic position of each fuel parcel, Eqs. (2)–(5), directly influencing evaporation and mixing rates. This is crucial for simulating WTO blends, as their higher viscosity would result in poorer atomization and larger droplet sizes, affecting the subsequent $(l)$ and $\left(l_m\right)$ values.
3.2 Heat release model
The combustion process is not monolithic but a sequence of distinct phases governed by different physical and chemical principles.
The model captures this by dividing combustion into four stages, as illustrated below [25]:
1. The ignition lag period phase can be collected from:
$\begin{gathered}\tau=\sqrt{\frac{T}{P}} * e^{\left(\frac{E_a}{8.312 T}-\frac{70}{C N+25}\right)} * 3.8 * 10^{-6} *(n * 1 \left.-1.6 * 10^{-4}\right)\end{gathered}$ (6)
The last ignition lag equation incorporates cetane number directly - WTO's lower CN (52.06 vs. 53.4) mathematically increases the delay period, inherently capturing altered ignition chemistry.
This phase is governed by pre-flame chemical kinetics, heavily influenced by the fuel's cetane number and the in-cylinder temperature and pressure at injection. A lower CN, such as that of WTO, directly increases this delay.
2. Premixed Combustion Phase: This stage refers to the combustion of the air–fuel vapor mixture formed before ignition.
$\begin{aligned} \frac{d x}{d t}=\varphi_1\left(\frac{d \sigma_u}{d \tau}\right)+ & \varphi_o *\left[\left(\sigma_{u d}-x_o\right)\left(0.1 \sigma_{u d}+x_o\right) A_o\left(\frac{m_f}{V_i}\right)\right]\end{aligned}$ (7)
This rapid, intense burning phase consumes the fuel vaporized and mixed with air within the ignition lag period. A longer delay typically leads to a larger, more vigorous premixed phase.
3. Diffusive Combustion Phase: This stage corresponds to the direct combustion of fuel as it is injected into the chamber.
$\frac{d x}{d \tau}=\varphi_2\left(\left(\sigma_u-x\right)(\emptyset-x) * A_2\left(\frac{m_f}{V_c}\right)\right)+\varphi_1\left(\frac{d \sigma_u}{d \tau}\right)$ (8)
This phase is controlled by the rate at which fuel and air mix. It is highly dependent on spray characteristics and in-cylinder turbulence. Fuels with poorer atomization (higher viscosity) tend to have a more prolonged diffusive burn.
4. Late Burning Phase: This stage refers to the combustion of residual fuel after injection is complete.
$\frac{d x}{d \tau}=(1-x)\left(\varepsilon_b \emptyset-x\right) * \varphi_3 K_T A_3$ (9)
$\varphi_3=\varphi_2=\varphi_1=\varphi_o$, it is a function that represents the completion of the combustion of fuel vapor in regions:
$\phi=1-\left(A_1 / \varepsilon_b \varnothing-x\right) \frac{d x}{d t}\left\{r_v+\sum_{i=1}^{m_w}\left[r_{w i} * 300 * e^{\left(\frac{-16000}{2500+r_{w i}}\right)}\right]\right\}$ (10)
where, $\varepsilon_b$ indicates the efficiency of air utilization; $r_v$ Denotes the relative evaporation rate within the ambient zones and at the spray front; $\phi$ is the equivalence ratio; and $r_{w i}$ indicates the relative evaporation rate across different regions of the wall-surface flow.
This final phase deals with the slow oxidation of any remaining fuel and soot particles. The model uses switching functions ( $\varphi_o, \varphi_1, \ldots$ etc.) to smoothly transition between these phases, ensuring a realistic representation of the entire heat release profile, which is vital for accurately predicting engine performance and emissions.
3.3 NOx formation modeling
Nitrogen dioxide (NO₂) and Nitric oxide (NO) are typically formed in combination, contributing to NOₓ emissions. In this study, the Zel’dovich mechanism is employed within the Diesel-RK simulation to model their formation [26]:
$O_2 \leftrightarrow 2 O$ (11)
$\mathrm{O}+\mathrm{N}_2 \leftrightarrow \mathrm{NO}+\mathrm{N}$ (12)
$\mathrm{O}_2+\mathrm{N} \leftrightarrow \mathrm{NO}+\mathrm{O}$ (13)
The concentration of atomic oxygen impacts the rate of reaction, as presented in Eq. (13). The volumetric concentration of NO is then calculated using the following expression:
$\frac{d[\mathrm{NO}]}{d \theta}=\frac{e^{-38020 / T_z}\left[\mathrm{~N}_2\right]_e[\mathrm{O}]_e\left(1-\left(\frac{[\mathrm{NO}]}{[\mathrm{NO}]_e}\right)^2\right) * 2.33 * 10^7 \mathrm{P}}{R T_z\left[1+\left(2365 / \mathrm{T}_z\right) e^{3365 / \mathrm{T}_z[\mathrm{NO}]} /\left[\mathrm{O}_2\right]_e\right]}\left[\frac{1}{r p s}\right]$ (14)
Nitrogen oxide emissions are primarily formed through the thermal (Zeldovich) mechanism, which is exponentially temperature-sensitive. WTO blends produce lower peak temperatures due to longer ignition delays and LHV, as captured by the temperature-dependent model, explaining the observed NOx reductions.
The model implements the extended Zeldovich mechanism Eqs. (11)–(13) to calculate the rate of NO formation in each zone Eq. (14). The key term in Eq. (14) is the exponential factor [3], which means that a little rise in the local zone temperature $\left(T_Z\right)$ results in an enormous increase in the NO formation rate. This explains why any parameter that increases peak combustion temperatures (like a higher CR) will disproportionately increase NOx emissions.
3.4 Soot formation modeling
Soot is a fine black carbon particle suspended in the vapor phase, typically generated by the incomplete combustion of hydrocarbons. Soot grains form, grow, and oxidize during combustion. A comprehensive analysis of soot simulation is presented [24].
The concentration of soot in the exhaust, under standard circumstances, can be expressed as shown below:
$[C]=\int_{\theta_B}^{480} \frac{d[C]}{d \tau} \frac{d \theta}{6 n}\left[\frac{0.1}{P}\right]^\gamma$ (15)
The Hartridge smoke level is estimated using the following equation:
Hartridge $=100 *\left[1-e^{(-24226[C])} * 0.9545\right]$ (16)
Particulate matter (PM) is described by Eq. (17) as a function of the Bosch smoke number (BSN):
$[P M]=565 *\left[\ln \frac{10}{10-\text { Bosch }}\right]^{1.206}$ (17)
The summary emission (SE) equation of air pollutants is another key relation that integrates both PM and NOx emissions [24]:
$S E=C_{P M}\left[\frac{P M}{0.15}\right]+C_{N O}\left[\frac{N O_x}{7}\right]$ (18)
WTO's higher aromatic content and lower H/C ratio influence the nucleation and growth terms, explaining the 2.44% and 6.32% increases in smoke.
Hence, soot formation is a complex nucleation, surface growth, and oxidation process, often modeled empirically in engine simulations. The model used here, based on the study [24], calculates the net soot formation rate in each zone (Eq. (15)). The Hartridge smoke unit (HSU) and BSN are then derived from the computed soot concentration (Eqs. (16) and (17)). Fuels with a higher carbon-to-hydrogen ratio or those that lead to fuel-rich zones (due to poor mixing) promote soot formation. The SE index, Eq. (18), is a valuable metric because it combines the environmental impacts of PM and NOx into a single value, acknowledging that optimizing for one pollutant often worsens the other.
3.5 Software validation
The reliability of any simulation study fundamentally depends on its validation against empirical data. Before conducting the parametric analysis, the Diesel-RK model was carefully calibrated and validated to ensure the physical accuracy of its predictions. The software was configured to replicate the engines and operating conditions documented in three independent experimental investigations [23, 24], with the corresponding engine specifications summarized in Table 3. The validation procedure employed identical configurations and boundary conditions stored within the software’s database, enabling direct comparison with the experimental results reported in previous researches [9, 24]. All validation engines operated on conventional diesel fuel. The progression of in-cylinder pressure and spray development with respect to crank angle is illustrated in Figures 2 and 3, respectively. These comparisons reveal strong convergence between simulated and experimental data, with only minor discrepancies. The consistently low variance underscores the robustness of Diesel-RK as a tool for modeling fuel combustion in internal combustion engines.
Table 3. Characteristics of the three engine configurations utilized for verification [27-30]
|
Test Facility |
Setup-1 Kirloskar |
Setup-2 Kirloskar TV1 |
Setup 3 Legion Brothers |
|
Kind of engine |
4-stroke 1-Cylinder, Compression ignition engine |
4-stroke 1-Cylinder, Compression ignition engine |
4-stroke 1-Cylinder, Compression ignition engine |
|
Bore x Stroke |
8.75 cm × 11 cm |
8.75 cm × 11 cm |
8 cm × 11 cm |
|
Cooling system |
Cooled by air |
Cooled by air |
Cooled by water |
|
Compression ratio |
17.5:1 |
17.5:1 |
17.5:1 |
|
Rated power output |
5148 W @ 1500 rpm |
5200 W @ 1500 rpm |
3700 W @1500 rpm |
|
Injection pressure |
20 MPa |
16 MPa |
20 MPa |
|
Injection timing |
23o BTDC |
20 ° BTDC |
23o BTDC |
The validation concentrated on two principal outputs: spray evolution and in-cylinder pressure profiles. Figures 2 and 3 show that the simulated results closely match the experimental findings. The spray penetration and morphology (Figure 2) and the pressure–crank angle relationship (Figure 3) is nearly indistinguishable from the experimental benchmarks.

Figure 2. Validation of spray profile versus crank angle

Figure 3. Validation of cylinder pressure versus crank angle
Quantitative comparison between numerical predictions and experimental data shows strong agreement. The deviation in peak cylinder pressure remained below 3.5%, while the error in BSFC was within 4.2%. These values fall within the acceptable range reported in similar numerical studies of compression-ignition engines, confirming the reliability and predictive capability of the Diesel-RK model for parametric investigations of alternative fuels.
This study investigates two significant performance factors: BSFC and BTE. The full-load case is deemed optimal for comparing WTO blends based on pollutant emissions, as the A/f ratio is lower under this condition.
4.1 Effect of waste tire pyrolysis oil blends
In this section, the results of testing pure diesel and 10% and 20% WTO in a diesel engine are presented.
4.1.1 Performance characteristics
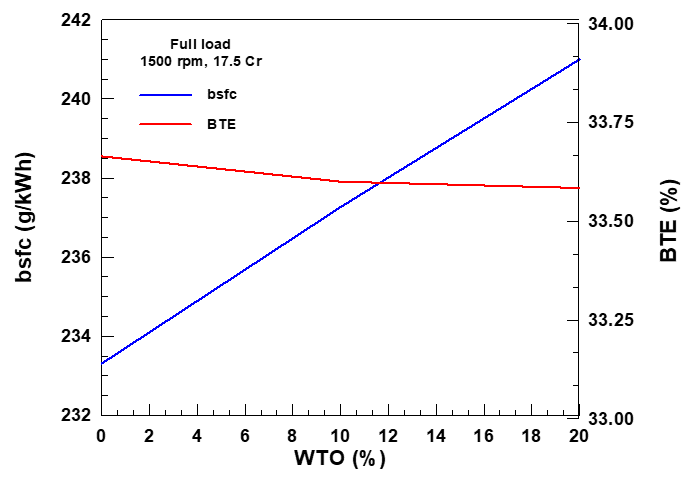
Figure 4 depicts the effects of different WTO ratios on BSFC and BTE at 1500 rpm and full load, with a 17.5 CR. The BSFC of the WTO blends is higher than that of pure diesel at all blending ratios. The net braking power obtained from the combustion of diesel fuel is greater than that of WTO due to the good combustion of diesel fuel, and thus the specific braking consumption of diesel fuel is less than that of WTO fuel. The greater value of BSFC, 241 g/kWh, is obtained for a 20% ratio of WTO, while 10% of WTO is 237 g/kWh, which is an increase compared to pure diesel of 233 g/kWh. The percentage increases in BSFC were 1.73% and 3.32% when 10% and 20% of the WTO were added to the diesel fuel, respectively. Figure 4 also clarifies the engine BTE as a function of the fuel-to-WTO ratio. The direction of the lines indicates that BTE decreases as the ratio of WTO escalates. As the WTO ratio increases, diesel fuel's content decreases, lowering the flame temperature and reducing diesel fuel combustion efficiency. As a result, a higher fuel rate is required to achieve the same useful power, resulting in lower BTE. In addition, diesel fuel's higher thermal efficiency is due to its higher calorific value and oxygen content [18]. The values of BTE of the WTO ratios (10% and 20%) are (33.6% and 33.584%), respectively, as compared with (33.676%) for diesel alone.
This model was validated against three independent experimental investigations [27, 28, 31]. Quantitative metrics achieved: peak pressure deviation <3.5%, BSFC error <4.2%, pressure RMSE 2.8%, spray penetration R² = 0.97. Table 4 presents detailed validation results.
Figure 4. The effect of waste tire pyrolysis oil (WTO) blends on brake-specific fuel consumption (BSFC) and brake thermal efficiency (BTE)
Table 4. Validation summary: Simulation vs. experimental results
|
Metric |
Setup-1 |
Setup-2 |
Setup-3 |
Average |
|
Peak Pressure Error (%) |
3.2 |
3.8 |
3.4 |
<3.5 |
|
BSFC Error (%) |
4.0 |
4.5 |
4.1 |
<4.2 |
|
Spray R² Value |
0.96 |
0.98 |
0.97 |
0.97 |
4.1.2 Emission characteristics
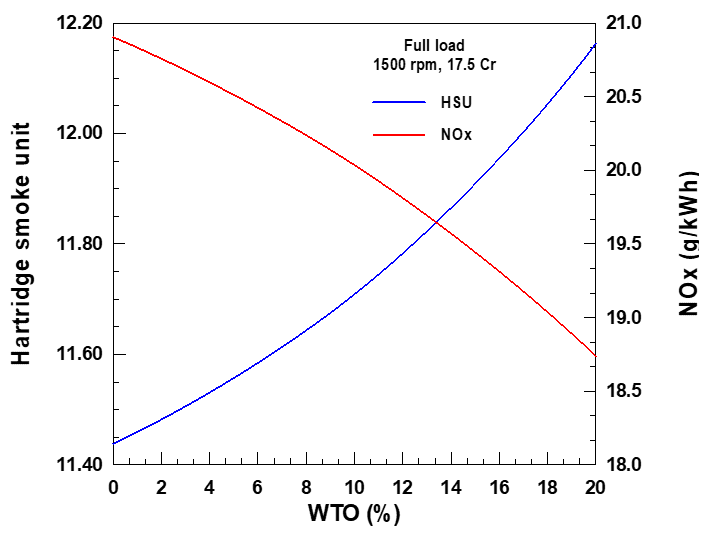
The variation in the HSU and NOx with various WTO ratios (1500 rpm, full load, and 17.5 CR) is shown in Figure 5. It is noted that the induction of the WTO resulted in a reduction in NOx and a boost in the HSU. As the ratio of WTO increases, NOx decreases compared to pure diesel fuel. The NOx values of 20.034 and 18.75 g/kWh are obtained for 10% and 20% of the WTO blending ratio with diesel fuel, respectively. At a 20% WTO ratio, a greater reduction in NOx was observed, reaching 18.75 g/kWh, compared with pure diesel at 20.85 g/kWh. NOx is reduced by 3.91% and 10.13% at 10% and 20% WTO, respectively, compared with diesel fuel. This is owing to a decrease in the maximum temperature of combustion due to vaporized water through combustion and reduced availability of O2. For the same Figure 5, adding the WTO to diesel fuel increases the HSU. These results show that adding the WTO with 10–20% causes an increase in the Hartridge Smoke concentration compared to the operation of diesel only. The HSU is increased by 2.44% and 6.32% for 10% and 20% of the WTO, respectively, compared with diesel fuel. This is because the WTO has a high tendency to HCU formation due to its low H/C ratio and the nature of its combustion process. In addition, the black carbon content in WTO ranges from 25% to 40%, lower than that of HCU. A greater increase in the HC ratio was observed with the 20% WTO ratio. At full load (1500 rpm) and a CR of 17.5, the Hartridge Smoke values with 10% and 20% WTO ratios are 11.72 and 12.163, respectively, compared to 11.44 for pure diesel.
Figure 5. The effect of waste tire pyrolysis oil (WTO) blends on Hartridge smoke unit (HSU) and NOx
4.1.3 Combustion characteristics
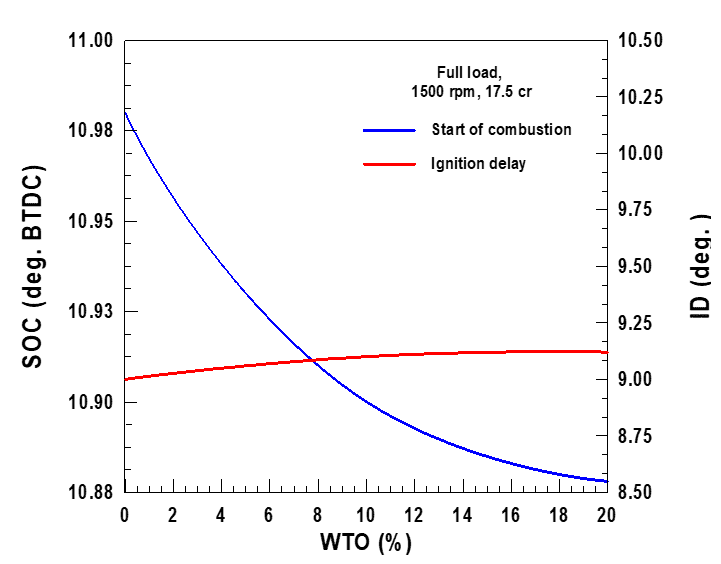
Figure 6 shows the onset of combustion and the perceived ignition delay at each of the WTO ratios, where the ignition delay is defined as the interval in (CA deg.) between the start of diesel fuel injection and the onset of combustion. A significant increase in the ignition delay period was observed as the WTO ratio was increased. The ignition lag duration grows from 9.02 to 9.12 (CA deg.) at 20% of WTO for pure diesel. The ignition delay increases by 0.837% and 1.08% for 10% and 20% of WTO, respectively, compared with diesel fuel. This is attributed to reduced operating temperatures, which slow chemical reactions and extend the chemical lag duration.
Additionally, the physical lag period is typically longer, particularly in the presence of diesel fuel, thereby increasing the total ignition delay. On the other side of the same Figure 6, the start of combustion (SOC) takes place, which depends directly on many factors, including the chemical characteristics of the fuel, the charge of the air-fuel mixture, spray penetration, the temperature of the compressed air, timing of injection, and its kinetic energy in various dimensions. The combustion process begins after fuel injection and ends at a specific crankshaft angle. The SOC for diesel fuel begins at 10.975°. Before top dead center, 10% and 20% of the WTO start at 10.9 and 10.878 deg. This is due to West Tire Oil requiring a longer period to evaporate than diesel fuel, as well as its delayed ignition caused by the low cetane number and a longer ignition delay period compared to pure diesel fuel. The SOC is reduced by 0.683% and 0.883% for 10% and 20% of the WTO, respectively, compared with diesel fuel.
Figure 6. The effect of waste tire pyrolysis oil (WTO) blends on start of combustion (SOC) and ID
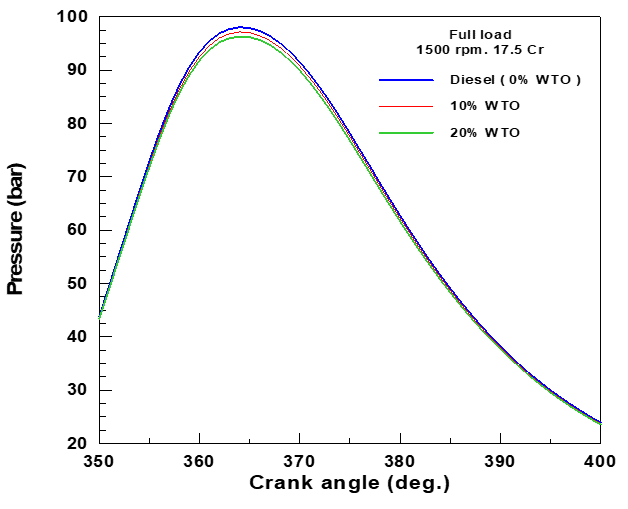
Figure 7. Pressure development for diesel and waste tire pyrolysis oil (WTO) blends
The cylinder pressure history with crank angle for 10% and 20% ratios of WTO at full load, 1500 rpm as speed, and 17.5 a CR of 17.5 is presented in Figure 7. In general, the overall demeanor of cylinder pressure as a function of crank angle, with or without introducing, is similar, apart from variations in the magnitude and timing of the highest pressure, which depend on the use of WTO ratios. It can be observed that, as the ratio of the WTO rises, the ignition lag increases and the maximum cylinder pressure decreases correspondingly. The increase in the delay period is intended for two main reasons. The first is that the amount of diesel fuel spray is minimized, reducing the fuel's momentum for dynamic atomization and blending, thereby supporting ignition. The other reason is that ignition is more difficult to occur when the amount of WTO increases, because WTO has a high resistance to auto-ignition. According to those mentioned above, the maximum cylinder pressure is (98.1, 97.15, and 96.285 bar) for pure diesel, 10%, and 20% of WTO, respectively.
4.2 Effect of variable compression ratio
This section will complete what was illustrated in the previous section, showing that the 20% WTO blend optimizes combustion, performance, and emissions by varying the compression-ignition engine’s CR from 15 to 19. In contrast, the standard CR is set at 17.5:1.
4.2.1 Performance characteristics
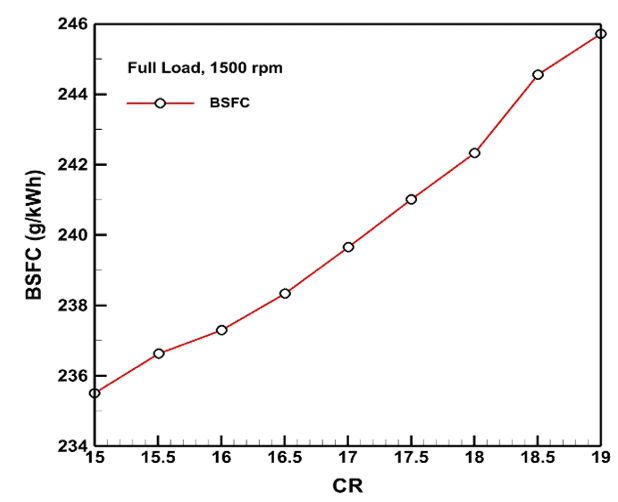
Figure 8 shows fluctuations in BSFC across different CRs. It has been observed that the BSFC is directly proportional to the CR at 20% WTO. The BSFC at 15 CR is 235.5 g/kWh; as the CR increased, the BSFC rose to 245.73 g/kWh at 19 CR, consistent with the trend reported by Al-Dawody et al. [24].
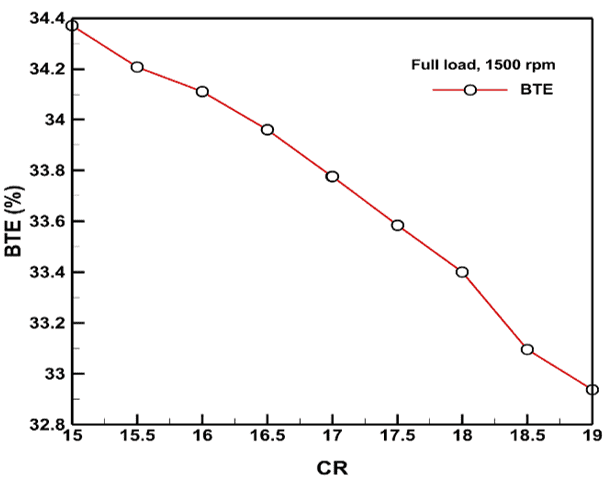
Figure 9 shows the fluctuation in BTE with different compression ratios. It has been observed that the BTE is inversely proportional to the CR when using a 20% WTO. The BTE at 15 CR is 34.368%; when the CR increased to 19, the BTE dropped to 32.937%.
Figure 8. The fluctuation of brake-specific fuel consumption (BSFC) with distinct compression ratios (CRs)
Figure 9. Brake thermal efficiency (BTE) with a different compression ratio (CR)
4.2.2 Combustion characteristics
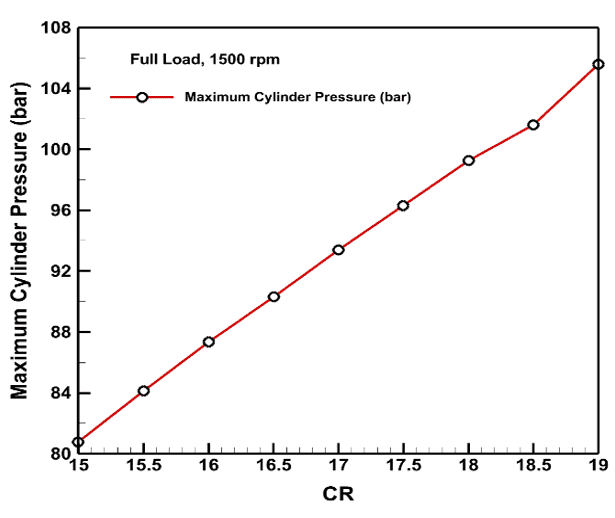
Figure 10 shows the upper-cylinder pressure as a function of the CR. It is noted that the uppermost cylinder pressure is directly proportional to the CR. The maximum cylinder pressure at 15 CR was 80.784 bar, while at 19 CR it was 105.59 bar. Greater pressure levels are associated with more rapid heat release and powerful combustion. The Maximum cylinder pressure increases by 30.706% when the CR is varied from 15 to 19; the same finding is reported by Öner et al. [12].
Figure 10. Maximum cylinder pressure with compression ratio (CR)
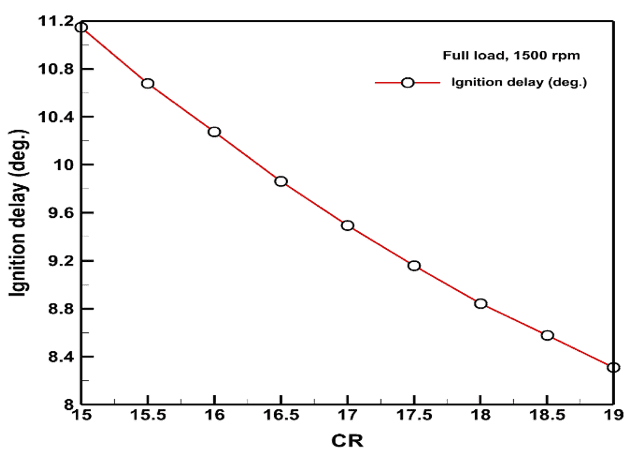
Figure 11. Ignition delay period with compression ratio (CR)
Figure 11 illustrates the ignition delay as a function of CR. It has been noted that the ignition lag is inversely proportional to the CR. The ignition delay at 15 CR was 11.145 degrees, and at 19 CR, it dropped to 8.31 degrees. This outcome aligns with research findings [30, 32]. Greater CRs increase the pressure inside the combustion chamber, promoting the ignition and combustion of the fuel-air mixture [30]. Hence, shorter ignition lags are observed with higher CRs. Higher CRs hasten chemical reactions and spontaneous ignition by elevating the pressure and temperature inside the engine's combustion chamber.
4.2.3 Emission characteristics
This section will present the influence of variant CRs at full load on emissions, including NOx, BSN, and SE (summary of NOx and PM emissions).
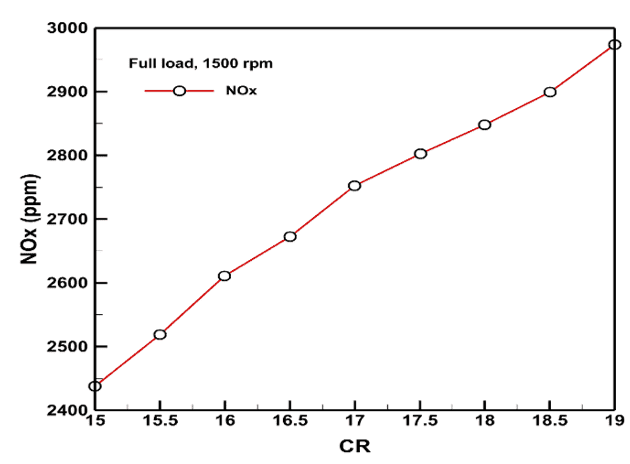
Figure 12 illustrates the variation in CR with NOx. It is noted that NOx increased when the CR rose. The NOx is 2438.2 ppm at 15 CR, while it has been recorded at 2973.7 ppm at 19 CR. NOx emissions increase linearly with growing CR. Combustion temperature is one of the main parameters for determining NOx emissions; increasing the CR raises the cylinder temperature. A higher CR leads to increased NOx emissions, and the temperature rises due to the elevated pressure ratio; the same findings hold from Zhong et al. [32]
Figure 12. NOx emission with different compression ratios (CR)
Figure 13. Variation of Bosch smoke number (BSN) with different compression ratios (CR)
Figure 14. SE emission with different compression ratios (CR)
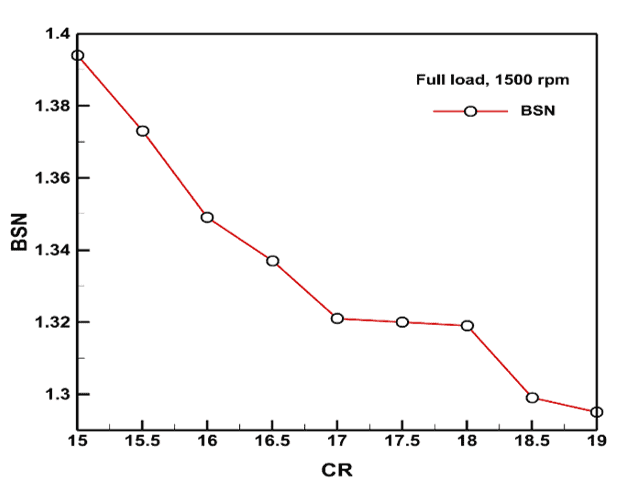
Figure 13 illustrates the variation of the BSN with different CRs. It has been noted that the BSN decreases when the CR increases. It has been recorded that the BSN equals 1.3938, and that when CR rises, the BSN reduces to 1.2953. The reduction rate in BSN at 19 CR is 7.6%, the same as the finding reported by Saravanan et al. [19].
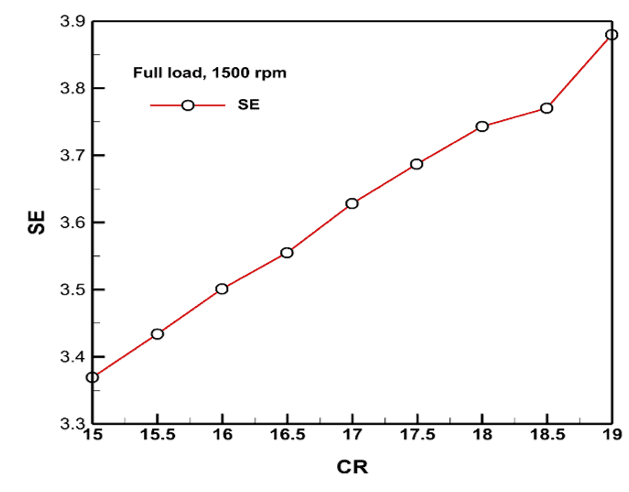
Figure 14 illustrates the variation of the emission summary (SE) with different CR. The SE emission includes NOx and PM, which are directly proportional to CR. The SE emission equals 3.3684, and at CR = 19, it becomes 3.8804. The SE rate increased by 15.2% when the CR changed from 15 to 19.
This comprehensive numerical investigation successfully deciphers the complex interplay between the WTO blends and CR in a diesel engine, delivering actionable insights for its potential implementation. The core conclusions are:
1. Inherent fuel trade-off: WTO blends introduce a fixed trade-off: a substantial diminution in NOx emissions (up to 10.13% for a 20% blend) is achieved at the direct expense of higher fuel consumption (+3.32%) and increased smoke emissions (+6.32%). This is primarily driven by the fuel's lower energy content and poorer ignition quality, which delays and cools the combustion process.
2. CR as a powerful tuner: It is highly effective for manipulating the WTO's combustion behavior. Raising the CR aggressively counteracts its main weakness, slashing ignition delay by 25.4% by providing a hotter, more reactive in-cylinder environment.
3. The calibration dilemma: Using a high CR to improve combustion unlocks a second, more severe trade-off. The resulting high temperatures lead to a 21.9% increase in NOx emissions, nullifying the WTO's inherent NOx advantage and increasing the overall emissions footprint (SE index).
4. Performance paradox: For the 20% WTO blend, fuel consumption and thermal efficiency worsened as CR increased. This indicates that the optimal efficiency point for this fuel is at a CR below standard, likely due to increased heat transfer and friction losses at high CRs that outweigh combustion gains.
5. Strategic implementation framework: This study concludes that no optimal setting exists. The choice is application-specific:
6. For NOx-sensitive applications: Use a higher WTO blend (20%) at a low to medium CR to capitalize on its inherent NOx-reduction benefits, while accepting higher fuel consumption and smoke.
7. Use a lower WTO blend for performance-sensitive applications or avoid high CRs to maintain fuel efficiency.
8. For a balanced approach, a medium WTO blend (10%) at the standard CR may offer a reasonable compromise.
The present results indicate that increasing the CR improves WTO ignition behavior but also results in a significant increase in NOx emissions. Future research should therefore focus on integrated strategies, such as CR–EGR coupling and optimized injection timing, to control NOx formation without compromising combustion stability. In addition, targeted fuel upgrading techniques aimed at reducing aromatic content may help mitigate the observed increase in smoke emissions. Long-term durability studies are also recommended to assess injector fouling and component wear during prolonged WTO operation. The following aspects can be regarded as suggestions for prospective work:
1. NOx-Smoke trade-off resolution: "Investigation of exhaust gas recirculation (EGR) rates between 5–20% specifically calibrated for WTO20 at CR 17.5–19 to reduce the 21.9% NOx increase identified in this study while maintaining the 7.6% smoke reduction benefit."
2. Efficiency paradox resolution: "Exploration of split injection strategies (pilot + main injection) to address the unexpected efficiency decline at high CR observed for WTO blends, with specific timing parameters (pilot: 30–40° BTDC, main: 15–20° BTDC) to optimize the premixed-diffusion combustion balance."
3. Ignition quality enhancement: "Investigation of cetane improver additives (2-ethylhexyl nitrate, di-tert-butyl peroxide) at 0.1–0.5% concentrations to compensate for WTO's lower cetane number and reduce the 1.08% ignition delay penalty observed at 20% blend ratio."
4. Experimental validation protocol: "Systematic experimental validation using the specific operating points identified as optimal in this study (WTO10 at CR 17.5 for balanced performance; WTO20 at CR 15–16 for NOx-sensitive applications) with uncertainty quantification."
|
A₀, A₁, A₂, A₃ |
model constants, dimensionless |
|
BSN |
Bosch smoke number, dimensionless |
|
BSFC |
brake-specific fuel consumption, g‧kWh⁻¹ |
|
BTE |
brake thermal efficiency, % |
|
C |
soot concentration, kg‧m⁻³ |
|
CN |
cetane number, dimensionless |
|
CO |
carbon monoxide |
|
CO₂ |
carbon dioxide |
|
CR |
compression ratio, dimensionless |
|
Eₐ |
apparent activation energy, kJ‧mol⁻¹ |
|
HSU |
Hartridge smoke unit, dimensionless |
|
ID |
ignition delay, °CA |
|
Kᴛ |
temperature factor, dimensionless |
|
l |
instantaneous distance from injector nozzle, m |
|
lm |
maximum penetration length at spray front, m |
|
LHV |
lower heating value, MJ‧kg⁻¹ |
|
mf |
mass of fuel, kg |
|
n |
engine speed, rpm |
|
N |
nitrogen atom |
|
NO |
nitric oxide |
|
NOₓ |
nitrogen oxides, ppm |
|
O |
oxygen atom |
|
O₂ |
oxygen molecule |
|
P |
pressure, bar |
|
PM |
particulate matter, mg‧m⁻³ |
|
R |
universal gas constant, J‧mol⁻¹.K⁻¹ |
|
rv |
relative evaporation rate in ambient zones, dimensionless |
|
rwi |
relative evaporation rate in wall regions, dimensionless |
|
SE |
summary emission index, dimensionless |
|
SOC |
start of combustion, °CA BTDC |
|
t |
time, s |
|
T |
temperature, K |
|
Tᴢ |
local zone temperature, K |
|
U |
instantaneous velocity of EFM, m‧s⁻¹ |
|
U₀ |
initial velocity at injector nozzle, m‧s⁻¹ |
|
Vc |
volume at compression, m³ |
|
Vi |
volume at injection, m³ |
|
WTO |
waste tire pyrolysis oil |
|
x |
heat release fraction, dimensionless |
|
Greek symbols |
|
|
$\gamma$ |
exponent in soot formation equation, dimensionless |
|
$\varepsilon_{\mathrm{b}}$ |
efficiency of air utilization, dimensionless |
|
θ |
crank angle, degrees |
|
θB |
crank angle at start of combustion, degrees |
|
$\sigma_{u}$ |
evaporated fuel fraction, dimensionless |
|
$\sigma_{u d}$ |
mixed fuel fraction under diffusion, dimensionless |
|
$\tau$ |
ignition delay period, s |
|
$\tau_{\mathrm{k}}$ |
travel time of EFM to cover distance l, s |
|
$\tau_{\mathrm{m}}$ |
duration for EFM to reach spray front, s |
|
$\varphi$ |
equivalence ratio, dimensionless |
|
$\varphi_0, \varphi_1, \varphi_2,\varphi_3$ |
switching functions for combustion phases, dimensionless |
|
Subscripts |
|
|
0 |
initial condition/reference state |
|
b |
burning/combustion |
|
c |
compression/cylinder |
|
e |
equilibrium |
|
f |
fuel |
|
i |
injection/index |
|
k |
instantaneous/kinetic |
|
m |
maximum/at spray front |
|
u |
unburned/evaporated |
|
ud |
under diffusion |
|
w, wi |
wall/wall region index |
|
x |
nitrogen oxide component |
|
z |
zone |
[1] Al-Dawody, M.F., Al-Obaidi, W., Aboud, E.D., et al. (2023). Mechanical engineering advantages of a dual fuel diesel engine powered by diesel and aqueous ammonia blends. Fuel, 346: 128398. https://doi.org/https://doi.org/10.1016/j.fuel.2023.128398
[2] Al-Shahrani, A.S. (2017). Theoretical analysis of ignition in diesel engines. Journal of Power and Energy Engineering, 5: 1-13. https://doi.org/10.4236/jpee.2017.56001
[3] Balat, M., Balat, H., Öz, C. (2008). Progress in bioethanol processing. Progress in Energy and Combustion Science, 34(5): 551-573. https://doi.org/10.1016/j.pecs.2007.11.001
[4] Dasari, S.R., Chaudhary, A.J., Goud, V.V., Sahoo, N., Kulkarni, V.N. (2017). In-situ alkaline transesterification of castor seeds: Optimization and engine performance, combustion and emission characteristics of blends. Energy Conversion and Management, 142: 200-214. https://doi.org/10.1016/j.enconman.2017.03.044
[5] Dewangan, A., Ahmad, A., Yadav, A.K. (2024). Recycling waste tires into sustainable biofuel for replacing petroleum fuel in diesel engines using nanoparticles and biohydrogen. Environmental Science and Pollution Research, 31: 61835-61844. https://doi.org/10.1007/s11356-024-35400-5
[6] Ghimire, S., Karn, R.L., Bhatta, K.R., Adhikari, S.P. (2024). Combustion characteristics of crude tyre blends fuel in compression ignition engine. Himalayan Journal of Applied Science and Engineering, 5(1): 33-46. https://doi.org/10.3126/hijase.v5i1.68336
[7] Isah, A.H., Zaki, U.F., Isah, A., Umar, A., Ahmad, A. (2024). Recycling of waste tyres to liquid fuel for automobile application. Caliphate Journal of Science and Technology, 6(2): 230-235. https://doi.org/10.4314/cajost.v6i2.12
[8] Kapilan, N., Ashok Kumar, K., Hari Chandra, B.P. (2021). Studies on pyrolysis oil derived from waste tires as fuel for diesel engine. Journal of Physics: Conference Series, 2070(1): 012232. https://doi.org/10.1088/1742-6596/2070/1/012232
[9] Karagöz, M. (2020). Investigation of performance and emission characteristics of an CI engine fuelled with diesel – waste tire oil – butanol blends. Fuel, 282: 118872. https://doi.org/10.1016/j.fuel.2020.118872
[10] Kondor, I.P., Zöldy, M., Mihály, D. (2021). Experimental investigation on the performance and emission characteristics of a compression ignition engine using waste-based tire pyrolysis fuel and diesel fuel blends. Energies, 14(23): 7903. https://doi.org/10.3390/en14237903
[11] Kumaravel, S.T., Murugesan, A., Vijayakumar, C., Thenmozhi, M. (2019). Enhancing the fuel properties of tyre oil diesel blends by doping nano additives for green environments. Journal of Cleaner Production, 240: 118128. https://doi.org/10.1016/j.jclepro.2019.118128
[12] Öner, İ.V., Atabani, A.E., Durnagöl, T. (2023). Recycling of waste tires to crude pyrolytic oil: Engine performance, combustion characteristics and emissions analysis of diesel-butanol-crude pyrolytic oil blends in CI diesel engines. Sustainable Energy Technologies and Assessments, 56: 103023. https://doi.org/10.1016/j.seta.2023.103023
[13] Hamzah, M.H., Alias, A., Mamat, R., et al. (2019). Performance analysis of diesel engine running with tyre-derived fuel. IOP Conference Series: Materials Science and Engineering, 469(1): 012017. https://doi.org/10.1088/1757-899X/469/1/012017
[14] Mohiuddin, K., Kwon, H., Choi, M., Park, S. (2021). Effect of engine compression ratio, injection timing, and exhaust gas recirculation on gaseous and particle number emissions in a light-duty diesel engine. Fuel, 294: 120547. https://doi.org/https://doi.org/10.1016/j.fuel.2021.120547
[15] Nabi, M.N., Hussam, W.K., Afroz, H.M.M., Rashid, A.B., Islam, J., Mukut, A.N.M.M.I. (2022). Investigation of engine performance, combustion, and emissions using waste tire Oil-Diesel-Glycine max biodiesel blends in a diesel engine. Case Studies in Thermal Engineering, 39: 102435. https://doi.org/10.1016/j.csite.2022.102435
[16] Ghareeb, H.O., Anjal, H.A.A.W. (2023). An investigation of the impacts of ethanol-diesel blends on emission and combustion parameters of diesel engine. International Journal of Heat and Technology, 41(3): 513-528. https://doi.org/10.18280/ijht.410304
[17] Pote, R.N., Patil, R.K. (2018). Evaluation of combustion performance of waste tyre pyrolysis oil on variable compression ratio, single cylinder diesel engine. In Proceedings of the International Conference on Industrial Engineering and Operations Management, Bandung, Indonesia, pp. 1715-1722. https://ieomsociety.org/ieom2018/papers/483.pdf.
[18] Pote, R.N., Patil, R.K. (2019). Combustion and emission characteristics analysis of waste tyre pyrolysis oil. SN Applied Sciences, 1: 294. https://doi.org/10.1007/s42452-019-0308-8
[19] Saravanan, R., Chandrasekar, D., Karthikeyan, S., et al. (2025). Waste tire oil fueled CI engine combustion argumentation for emission reduction by Butylated Hydroxy Anisole (BHA) antioxidant. Engineering Reports, 7(3): e70075. https://doi.org/10.1002/eng2.70075
[20] Doğan, O., Aydın, M. (2022). Experimental combustion analysis of a small-sized diesel engine fueled with tire-derived fuel/diesel fuel blends. International Journal of Automotive Science and Technology, 6(3): 284-293. https://doi.org/10.30939/ijastech..1166994
[21] Kaimal, V.K., Vijayabalan, P. (2015). A detailed study of combustion characteristics of a DI diesel engine using waste plastic oil and its blends. Energy Conversion and Management, 105: 951-956. https://doi.org/10.1016/j.enconman.2015.08.043
[22] Rajak, U., Nashine, P., Singh, T.S., Verma, T.N. (2018). Numerical investigation of performance, combustion and emission characteristics of various biofuels. Energy Conversion and Management, 156: 235-252. https://doi.org/10.1016/j.enconman.2017.11.017
[23] Ghareeb, H.O., Anjal, H.A.A. (2024). Ignition delay period prediction for compression ignition engines fueled with ethanol/diesel blends. Journal of Engineering, 30(8): 48-70. https://doi.org/10.31026/j.eng.2024.08.04
[24] Al-Dawody, M.F., Imtiaz, M., Katbar, N.M., et al. (2024). The effect of biogas and dimethyl ether on the thermal characteristics of a dual-fuel diesel engine: A numerical study. Biofuels, Bioproducts and Biorefining, 18(1): 125-138. https://doi.org/10.1002/bbb.2553
[25] Khairil, Gamell, R.M., Zaki, M.A., Edhy, S.S. (2023). Experimental study the effect of diesel engine performance fuelled by waste tire oil-dexlite blends. BIO Web of Conferences, 62: 04003. https://doi.org/10.1051/bioconf/20236204003
[26] Susilo, S.H., Mashudi, I., Santoso, S., Hardjito, A., Pebrianti, D. (2024). Power and emission estimation of plastic waste pyrolysis-derived fuel blends in internal combustion engines. Eastern-European Journal of Enterprise Technologies, 6(10 (132)): 19-25. https://doi.org/10.15587/1729-4061.2024.318593
[27] Mickevičius, T., Dudziak, A., Matijošius, J., et al. (2025). Evaluation of tire pyrolysis oil–HVO blends as alternative diesel fuels: Lubricity, engine performance, and emission impacts. Energies, 18(16): 4389. https://doi.org/10.3390/en18164389
[28] Uyumaz, A., Aydoğan, B., Solmaz, H., et al. (2019). Production of waste tyre oil and experimental investigation on combustion, engine performance and exhaust emissions. Journal of the Energy Institute, 92(5): 1406-1418. https://doi.org/10.1016/j.joei.2018.09.001
[29] Wu, Y.J., Yuan, Y., Xia, C.L., et al. (2024). Production of waste tyre pyrolysis oil as the replacement for fossil fuel for diesel engines with constant hydrogen injection via air intake manifold. Fuel, 355: 129458. https://doi.org/10.1016/j.fuel.2023.129458
[30] Zerin, N.H., Rasul, M.G., Jahirul, M.I., Sayem, A.S.M., Haque, R. (2025). Physicochemical properties of pyrolytic char and oil from mixed tyre using batch pyrolysis process. Energy Conversion and Management: X, 26: 100941. https://doi.org/10.1016/j.ecmx.2025.100941
[31] Pote, R.N., Patil, R.K., Badadhe, A.M. (2020). Optimisation of performance and emission parameters of diesel engine using tyre pyrolysis oil. Australian Journal of Mechanical Engineering, 20(4): 1172-1184. https://doi.org/10.1080/14484846.2020.1785187
[32] Zhong, Y.L., Xu, J., Pan, Y.H., et al. (2022). Combustion characteristics of aromatic-enriched oil droplets produced by pyrolyzing unrecyclable waste tire rubber. Fuel Processing Technology, 226: 107093. https://doi.org/10.1016/j.fuproc.2021.107093