Mashky Chowdhury Surja* | Md. Moniruzzaman Bhuyan | Mst. Rashida Pervin | Rehana Parvin | Ujjwal Kumar Deb
© 2026 The authors. This article is published by IIETA and is licensed under the CC BY 4.0 license (http://creativecommons.org/licenses/by/4.0/).
OPEN ACCESS
This numerical study focuses on the heat transfer enhancement by water through a pipe due to volume reduction by 0.53% to 1.38% using two to eight pairs of ellipsoid inserts. Numerical simulations are carried out for the full volume of the domain and pipes with volume reduced by inserts measuring 4 mm × 18 mm × 4 mm at equidistant positions of the pipe domain over a Reynolds number (Re) range of 764-3056 under uniform heat flux conditions. The simulation results reveal that the reduction in pipe volume due to ellipsoid inserts causes substantial improvement in heat transfer compared to a full-volume pipe. The maximum Nusselt numbers (Nu) of 5.23–6.09 are obtained for 1.38% volume reduction. In the case of effectiveness, a 1.38% volume reduction yields maximum values of 1.40–1.80. A general decrease in the friction factor (f) was observed across the different volume reductions, with the best results of 0.19–0.85 obtained for 1.38% volume reduction. The maximum thermal performance efficiency of 97.56–97.96% was obtained for 0.53% volume reduction. The vorticity increases at insert positions due to enhanced fluid mixing as pipe volume is reduced.
ellipsoid inserts, volume reduction, laminar flow, heat transfer, numerical simulation
Heat exchangers are becoming popular in this era of the fourth industrial revolution to transfer heat from one medium to another. They are being widely used in petrochemical industries, power plant industries, oil refineries, fertilizer industries, food manufacturing industries, etc. Thus, heat transfer improvement is an important aspect being focused on by researchers around the globe [1-4].
This can be achieved in two methods, active and passive. Passive methods focus on enhancing heat transfer without external power by focusing on surface extension and modification, design and orientation, shedding, geometric modification, utilizing inserts, additives, etc., while active methods focus on mechanical aid, surface vibration, fluid vibration, fluid injection and suction, fluid mixing, etc. [5, 6].
The inclusion of inserts has been found to be effective in the enhancement of heat transfer by interrupting the boundary layer, displacing fluid flow, encouraging static mixing, and promoting swirl flow. Inserts of various types and geometries have been studied, such as turbulator inserts [7], perforated Y-shaped inserts [8], triangular perforated flat cone-shaped inserts [9], bidirectional conical strip inserts [10], curved delta wing vortex generator inserts [11] and helical screw tape inserts [12].
Hossain et al. [13] used a combination of rectangular-box inserts arranged vertically and horizontally to numerically study their impact on the heat transfer under constant heat flux conditions. The results indicate the distance between the inserts to be a crucial factor. The highest outlet temperature was obtained for four inserts. But after altering the positions of the inserts, greater outlet temperatures were obtained for six and eight inserts.
Acherjee et al. [14] used various angles of perforation in a perforated axial insert and observed an inverse relation between heat transfer rate and wall temperature. At the 65° angle of perforation, the Nusselt number (Nu) increases by 11–13% while the thermal performance criterion improves by 10–13% in comparison to the 0° angle.
Nashee et al. numerically investigated the heat transmission and the friction in a channel with two rows of asymmetrical obstacles, rectangular, triangular, and semicircular. Numerical simulations were executed for Reynolds numbers (Re) 500–2500, assuming a constant heat flow. Triangle-shaped barriers were found to result in an enhancement in heat transfer, but they also cause the highest friction factor (f) and fluid pressure drop [15].
The experimental study by Khashaei et al. [16] in 2024 evaluated the heat transfer and pressure drop in deep dimpled tubes for the laminar flow of Al2O3 nanofluid. The dimpled geometry enhances thermal performance through local velocity increase, vortex generation, and flow mixing. The heat transfer coefficient increases 3.42 times with a performance evaluation criterion up to 2.80 for a Reynolds number of 2250 with 1 wt% nanofluid. Although being recommended for higher Reynolds numbers, this modification in tube geometry is not suitable for Reynolds numbers less than 1000.
The numerical study by Kiros et al. [17] focused on multi-leg (2, 3, 4) twisted tape designs of twist ratio five for the optimization of thermal performance for the laminar flow of water. The results reveal that the 2-leg design achieved the highest Thermal Performance Factor. The highest Nusselt number improvements were 134.16%, 152.19%, and 153.32%, while the highest friction factor increments were 329.41%, 486.87%, and 630.09%, respectively.
In 2026, Bidari et al. [18] numerically studied the effect of backward facing flat metallic cone inserts for the laminar flow of water through a tubular heat exchanger. For a constant attack angle of 22°, the maximum thermal performance factor of 1.26 was found for a Reynolds number of 1600 for four strip inserts.
From the above literature, it can be seen that numerous works have been done on the effect of inserts in the pipe on the heat transfer. But the effect of pipe-volume reduction is yet to be explored. This study focuses on the effect of 0.53–1.38% pipe-volume reduction by adding two to eight pairs of ellipsoid inserts on the heat transfer of water through a U-loop pipe compared to the full volume pipe with no inserts for Reynolds number 764-3056 under uniform heat flux conditions. The finite element method (FEM) [19] based COMSOL Multiphysics [20] is used for the numerical simulations. The results obtained by the addition of the novel ellipsoid inserts are found to be comparable to the results of Wongcharee and Eiamsa-ard [21], Sivashanmugam and Suresh [22], Ibrahim [23], and Jaisankar et al. [24], as seen in Table 1.
Table 1. Result comparison with previous works
|
Ref. |
Nu for Plain Tube |
Re |
|
Present Work |
4.98 ≤ Nu ≤ 5.85 |
764 ≤ Re ≤ 3056 |
|
Wongcharee and Eiamsa-ard [21] |
Mean value of 48/11 |
830 ≤ Re ≤ 1990 |
|
Sivashanmugam and Suresh [22] |
4 < Nu < 20 |
110 < Re ≤ 2000 |
|
Ibrahim [23] |
≈[7.8, 10] |
570 < Re ≤ 1310 |
|
Jaisankar et al. [24] |
≈[4, 5.4] |
Re ≈ [180,540] |
Note: Nu = Nusselt number; Re = Reynolds number.
Computational Fluid Dynamics (CFD) is a reliable method for analyzing fluid flow and heat transfer in U-loop pipes. It numerically solves the Navier–Stokes equations using the FEM based on the principles of continuity, momentum, and energy [13, 14]. For fluids initially stationary, the convective heat transfer coefficient (h) and the Nusselt number (Nu) are determined as follows.
$h=\frac{Q}{T_w-T_b}$ (1)
$N u=\frac{h D}{k}$ (2)
The efficiency ($\varepsilon$) is calculated using Eq. (3).
$\varepsilon=\frac{T_o-T_i}{T_{wav}-T_i}$ (3)
The Darcy method is applied to calculate the fluid pressure drop (ΔP) and the friction factor (f) from inlet to outlet.
$\Delta P=h \rho g$ (4)
The fluid’s head loss, h, is calculated using:
$h=\frac{f j u^2}{2 g D}$ (5)
Eqs. (4) and (5) are used to generate Eq. (6).
$\Delta P=\frac{l}{D} \cdot \frac{f u^2 \rho}{2}$ (6)
The thermal performance criterion ($\eta$) is calculated using Eq. (7).
$\eta=\frac{N u / N u_0}{\left(f / f_0\right)^{1 / 3}}$ (7)
The mean average difference (M.A.D.) and the relative mean average difference (R.M.A.D.), compared to the full volume pipe with no inserts, are calculated using:
$M . A . D .=\frac{1}{n} \sum_{i=1}^n\left|f\left(x_i\right)-g\left(x_i\right)\right|$ (8)
$R.M.A.D.=\frac{1}{n} \sum_{i=1}^n\left|\frac{f\left(x_i\right)-g\left(x_i\right)}{g\left(x_i\right)}\right|$ (9)
The consecutive mean average difference (C.M.A.D.) and the relative consecutive mean average difference (R.C.M.A.D.), compared between two consecutive models, is calculated using:
$C.M.A.D.=\frac{1}{n} \sum_{i=1}^n\left|f\left(x_i\right)-f\left(x_{i-1}\right)\right|$ (10)
$R.C.M.A.D.=\frac{1}{n} \sum_{i=1}^n\left|\frac{f\left(x_i\right)-f\left(x_{i-1}\right)}{f\left(x_{i-1}\right)}\right|$ (11)
where, n is the number of observations, $f(x)$ is the insert function and $g(x)=f\left(x_0\right)$ is the no insert function.
The inlet temperature of the working fluid, water, is set as $T=T_0=293.15 \mathrm{~K}$, with a no-slip condition applied at the pipe walls. A normal stress pressure boundary condition is assumed at the outlet [25].
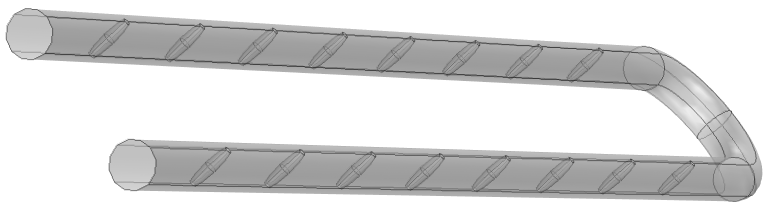
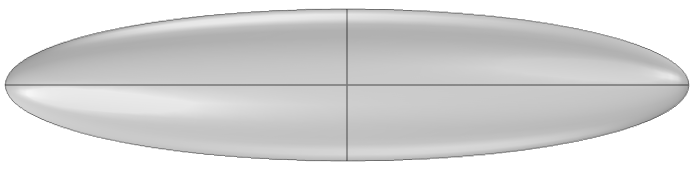
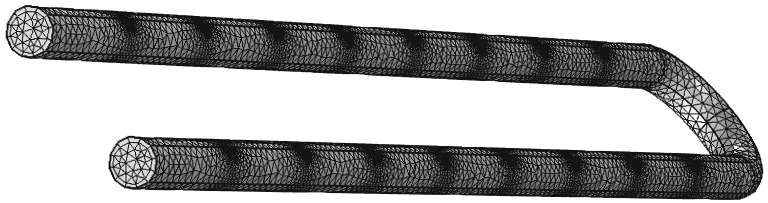
The computational domain consists of a U-loop pipe with the straight sections measuring 1000 mm in length, each with an inner radius of 13.3 mm as shown in Figure 1(a). Ellipsoid inserts measuring 27 mm × 10 mm × 5 mm, positioned perpendicular to the flow of the fluid, can be seen in Figure 1(b). Coarse mesh is used for faster computation and similarity in the results compared to normal and fine meshes. Figure 1(c) shows the coarse mesh used for accuracy assessment, with a dense mesh around the inserts. The mesh element properties for all the models are summarized in Table 2. The comparison of Nusselt number, friction factor, and effectiveness for different mesh sizes can be seen in Table 3.
Table 2. Mesh element properties of all models
|
Property Name |
No Insert |
2 Pairs |
3 Pairs |
4 Pairs |
5 Pairs |
6 Pairs |
7 Pairs |
8 Pairs |
|
Tetrahedral Elements |
23112 |
49226 |
61601 |
74352 |
87106 |
99613 |
111272 |
124724 |
|
Prism Elements |
7362 |
11502 |
13264 |
15230 |
17192 |
19090 |
20898 |
22986 |
|
Triangular Elements |
7522 |
11662 |
13424 |
15390 |
17352 |
19250 |
21058 |
23146 |
|
Edges |
1078 |
1526 |
1738 |
1954 |
2166 |
2392 |
2592 |
2822 |
|
Vertex Elements |
20 |
68 |
92 |
116 |
140 |
164 |
188 |
212 |
|
Number of Elements |
30474 |
60728 |
74865 |
89582 |
104298 |
118703 |
132170 |
147710 |
Table 3. Mesh size comparison for Reynolds number (Re) 764
|
Model |
Mesh Size |
Element Number |
Nu |
f |
ε |
|
Plain Tube |
Coarse |
30474 |
5.366 |
0.233 |
1.584 |
|
Normal |
88830 |
5.148 |
0.236 |
1.549 |
|
|
Fine |
169178 |
5.092 |
0.245 |
1.531 |
|
|
2 Pairs |
Coarse |
60728 |
5.440 |
0.261 |
1.589 |
|
Normal |
127629 |
5.253 |
0.266 |
1.560 |
|
|
Fine |
244785 |
5.135 |
0.276 |
1.536 |
|
|
8 Pairs |
Coarse |
147710 |
5.595 |
0.346 |
1.610 |
|
Normal |
242250 |
5.406 |
0.358 |
1.581 |
|
|
Fine |
471820 |
5.318 |
0.370 |
1.562 |
Numerical simulations are carried out to study the effect of 0.53–1.38% pipe-volume reduction by adding two to eight pairs of ellipsoid inserts on the heat transfer phenomenon compared to the full volume pipe with no inserts for Reynolds number 764-3056 under uniform heat flux conditions. Heat transfer characteristics such as Nusselt number, effectiveness, friction factor, thermal performance criterion, and vorticity are observed, and the results are analysed [21-24].
5.1 Nusselt number analysis
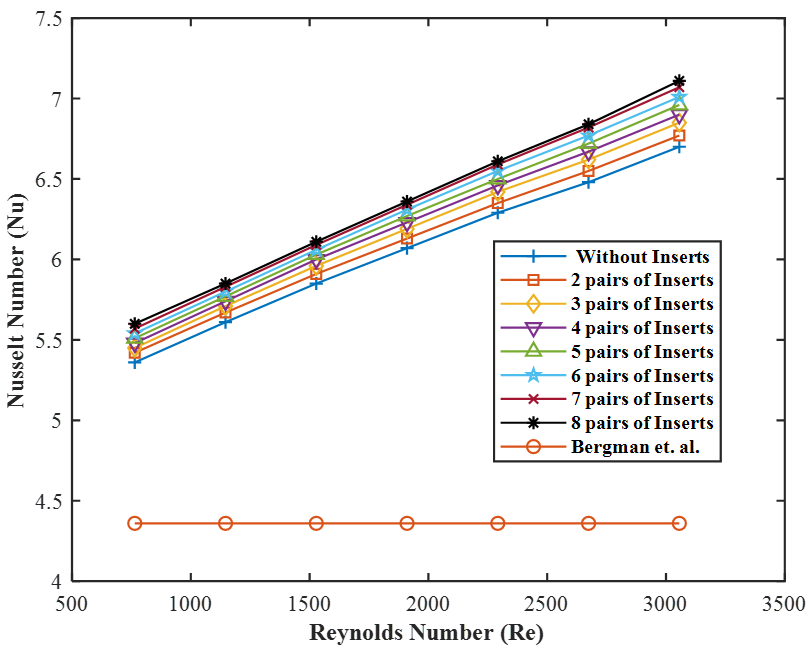
Figure 2 shows the Nusselt number distribution for the full volume, 0.53–1.38% reduced volume U-loop pipe, by adding two to eight pairs of ellipsoid inserts and an empirical relation by Bergman et al. [26] for Reynolds number 764-3056. The Nusselt number is found to increase with increasing Reynolds number. For the aforementioned Reynolds number range, the Nusselt number is greater as more inserts are added, with the highest values yielded by seven pairs of inserts for the initial Reynolds numbers and eight pairs of inserts for the latter Reynolds numbers.
Figure 2. Nusselt number (Nu) distribution
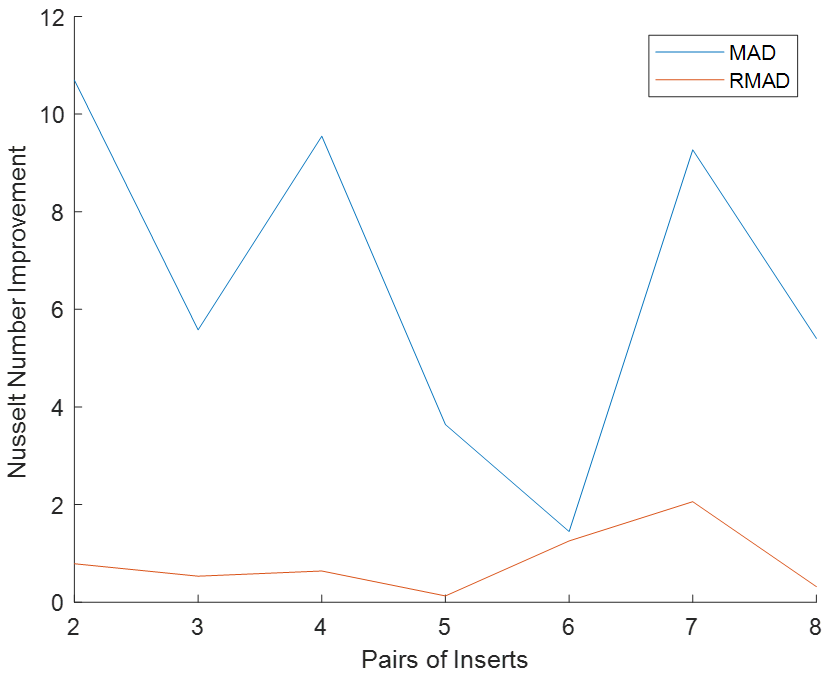
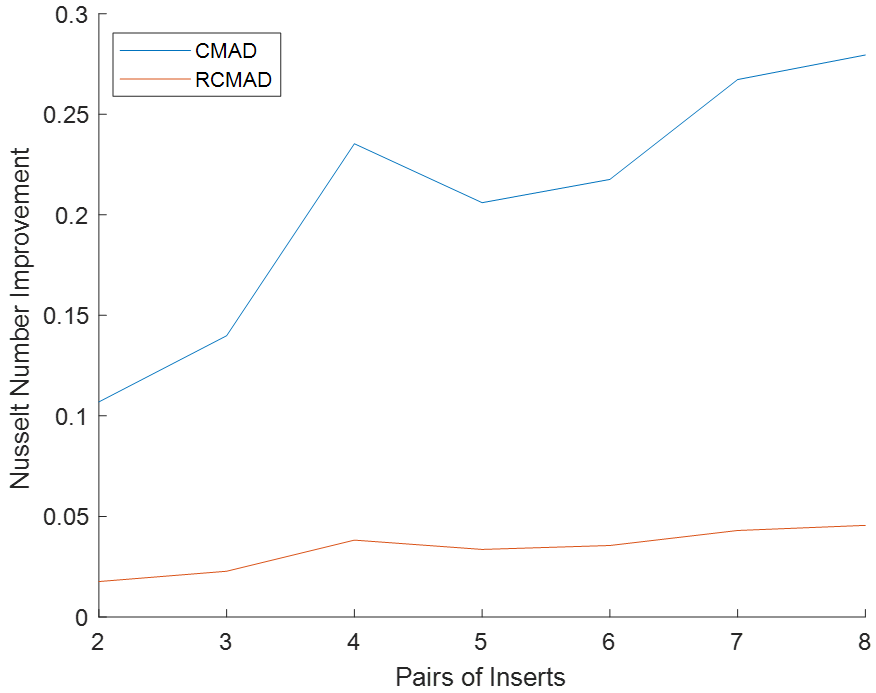
The mean average difference (M.A.D) and the relative mean average difference (R.M.A.D) of Nusselt number compared to the full volume pipe show a fluctuating pattern and range from 10.7–27.9% and 1.76–4.56%, respectively, as seen in Figure 3(a). The consecutive mean average difference (C.M.A.D) and the relative consecutive mean average difference (R.C.M.A.D), which measure the average differences in Nusselt number between two consecutive models, can be seen in Figure 3(b). The values increase in general, indicating improvement in effectiveness compared to the previous model, with a dip at five and six pairs of inserts. This suggests that although the Nusselt number improves as more pipe volume is reduced, the addition of five and six pairs of inserts has less significance in enhancing Nusselt number compared to other consecutive additions.
5.2 Effectiveness analysis
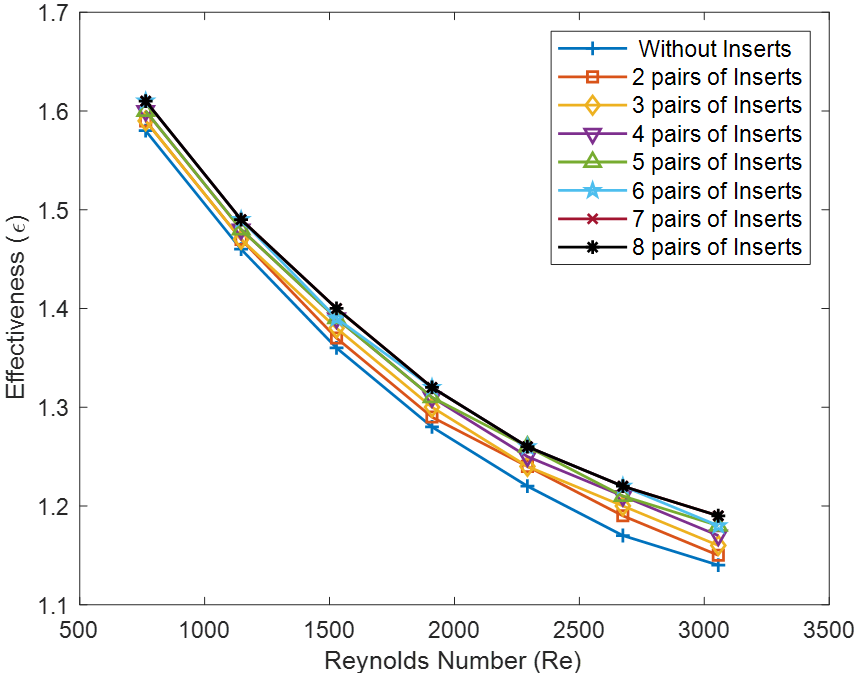
Figure 4 shows the effectiveness distribution for the full volume and 0.53–1.38% reduced volume U-loop pipe by adding two to eight pairs of ellipsoid inserts for Reynolds number 764-3056. The effectiveness is found to decrease with increasing Reynolds number. For the aforementioned Reynolds number range, the effectiveness is greater as more inserts are added, with the maximum effectiveness obtained for eight pairs of inserts.
Figure 4. Effectiveness distribution
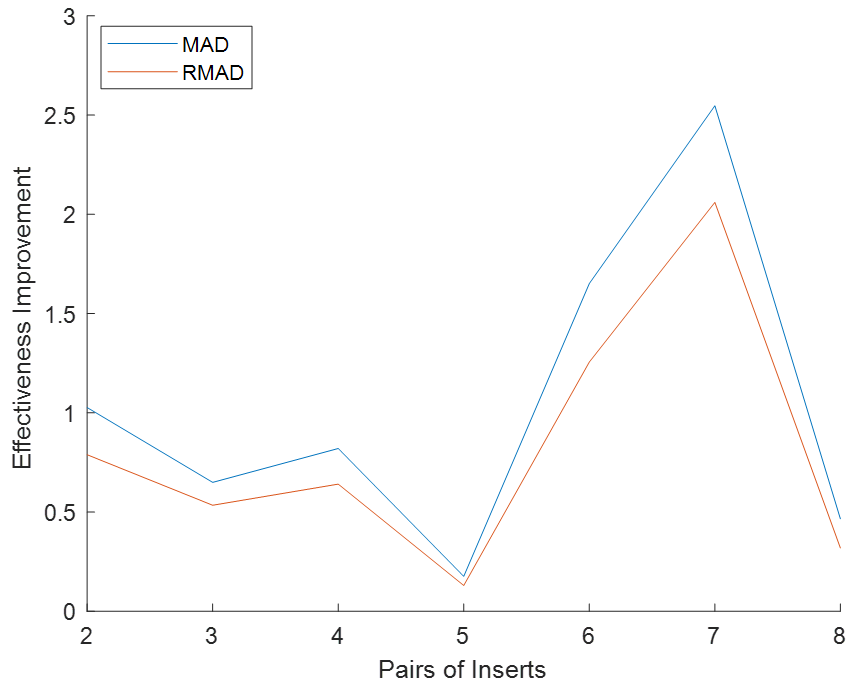
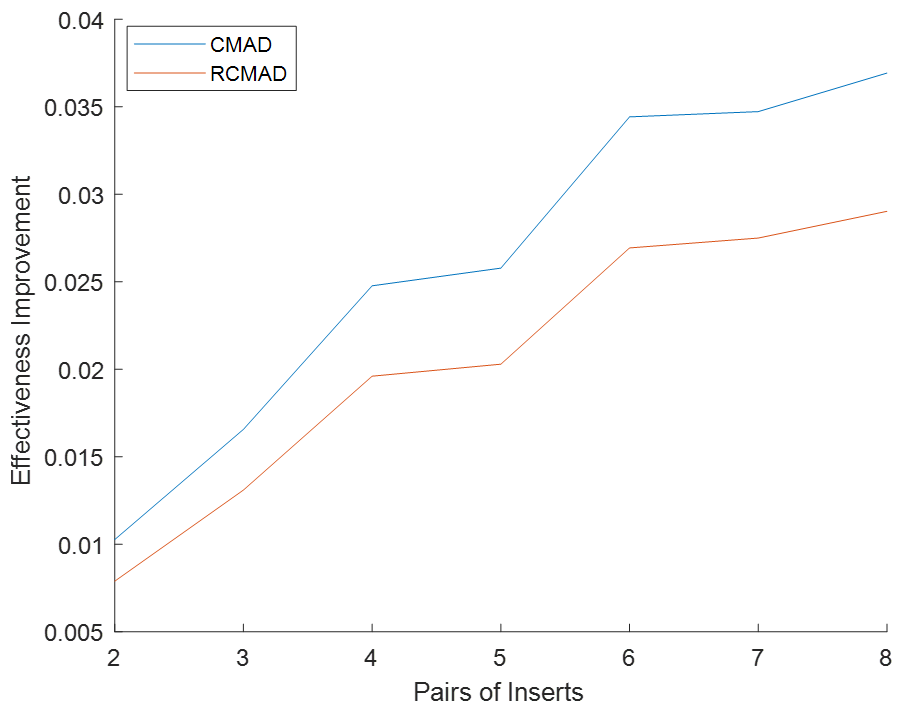
The mean average difference (M.A.D.), compared to the full volume pipe, shows a fluctuating pattern and ranges from 0.18–2.55%, as seen in Figure 5(a). The consecutive mean average difference (C.M.A.D.) and the relative consecutive mean average difference (R.C.M.A.D.), which measure the average differences in effectiveness between two consecutive models, can be seen in Figure 5(b). The values increase in general, indicating improvement in effectiveness compared to the previous model, with a dip at five pairs of inserts. This suggests that although the effectiveness improves as more pipe volume is reduced, the addition of five pairs of inserts has less impact in enhancing effectiveness compared to other consecutive additions.
As quadratic curves are fit through the data points, the gradients of the curves for all the models lie within [−0.0003236, −0.0000944], indicating similarity in their pattern precisely for the studied Reynolds number range. This can be seen in Table 4.
Table 4. Quadratic regression models for effectiveness
|
Model |
Quadratic Equations |
R2 |
Gradient |
|
No Insert |
$y=5 \times 10^{-8} x^2-0.0004 x+1.8448$ |
0.9991 |
−0.0003236 - −0.0000944 |
|
2 Pairs |
$y=5 \times 10^{-8} x^2-0.0004 x+1.8343$ |
0.9973 |
|
|
3 Pairs |
$y=5 \times 10^{-8} x^2-0.0004 x+1.8473$ |
0.9991 |
|
|
4 Pairs |
$y=5 \times 10^{-8} x^2-0.0004 x+1.8525$ |
0.9990 |
|
|
5 Pairs |
$y=5 \times 10^{-8} x^2-0.0004 x+1.8541$ |
0.9984 |
|
|
6 Pairs |
$y=5 \times 10^{-8} x^2-0.0004 x+1.8568$ |
0.9988 |
|
|
7 Pairs |
$y=5 \times 10^{-8} x^2-0.0004 x+1.8372$ |
0.9996 |
|
|
8 Pairs |
$y=5 \times 10^{-8} x^2-0.0004 x+1.8642$ |
0.9975 |
5.3 Friction factor analysis
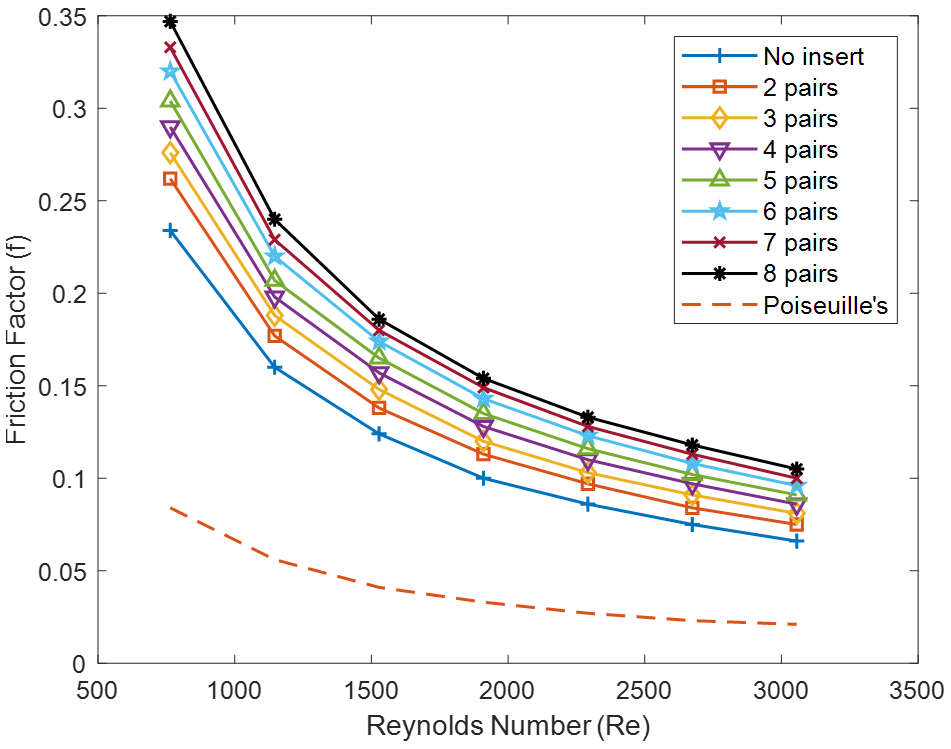
The friction factor distribution for full volume, 0.53–1.38% reduced volume U-loop pipe by adding two to eight pairs of ellipsoid inserts, and the empirical relation represented by the Hagen-Poiseuille equation [26] for Reynolds number 764-3056 can be seen in Figure 6. The friction factor is found to decrease with increasing Reynolds number. For the aforementioned Reynolds number range, the friction factor is greater as more volume of the pipe is reduced, with the maximum friction factor values obtained for eight pairs of ellipsoid inserts.
Figure 6. Friction factor (f) distribution
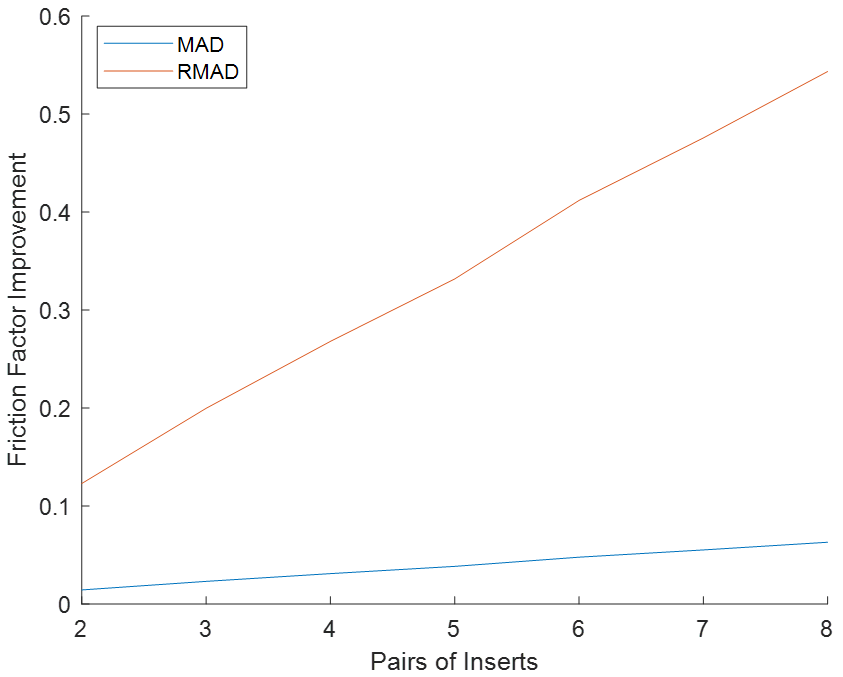
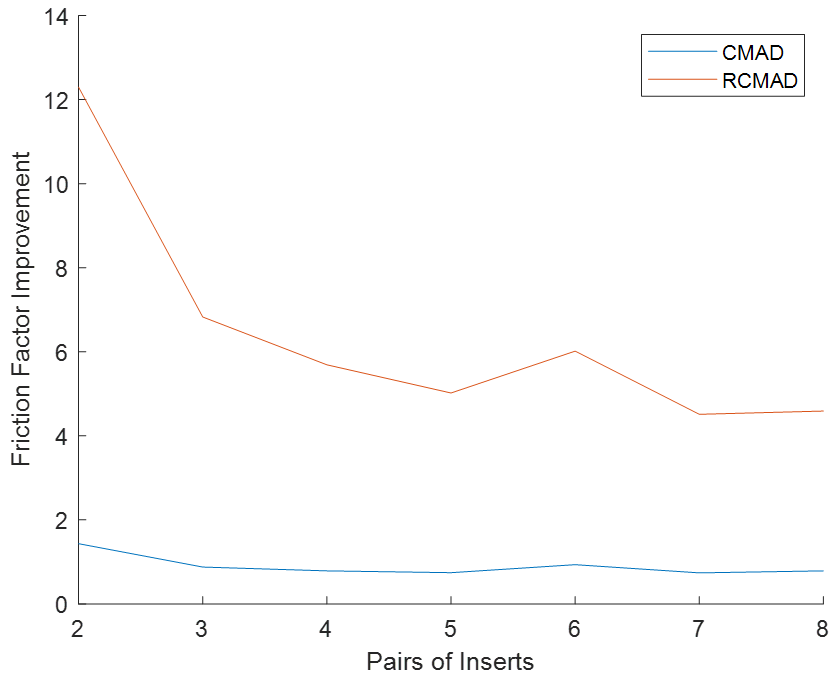
The mean average difference (M.A.D.) and the relative mean average difference (R.M.A.D.), compared to the full volume pipe, increase in general and range from 1.43–6.30% and 12.3–54.3%, respectively, as seen in Figure 7(a). The consecutive mean average difference (C.M.A.D) and the relative consecutive mean average difference (R.C.M.A.D.), which measure the average differences in friction factor between two consecutive models, can be seen in Figure 7(b). The values decrease in general, indicating improvement in friction factor compared to the previous model, with a jump from five to six pairs of inserts. This suggests that although friction factor improves as more inserts are added, the addition of six pairs of inserts has less significance in enhancing friction factor compared to other consecutive additions.
5.4 Thermal performance criterion analysis
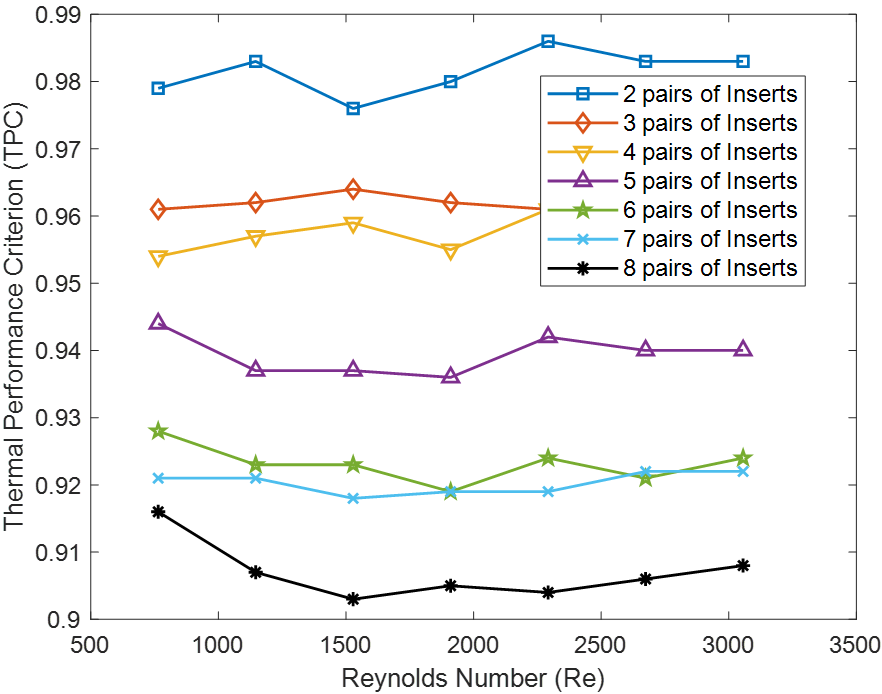
Figure 8 shows the Thermal Performance Criterion (TPC) distribution for 0.53–1.38% reduced volume U-loop pipe by adding two to eight pairs of ellipsoid inserts for Reynolds number 764-3056. The Thermal Performance Criterion remains mostly stable with increasing Reynolds number. For the aforementioned Reynolds number range, the Thermal Performance Criterion is greater as more inserts are added, with the maximum values obtained for two pairs of inserts.
Figure 8. Thermal performance criterion distribution
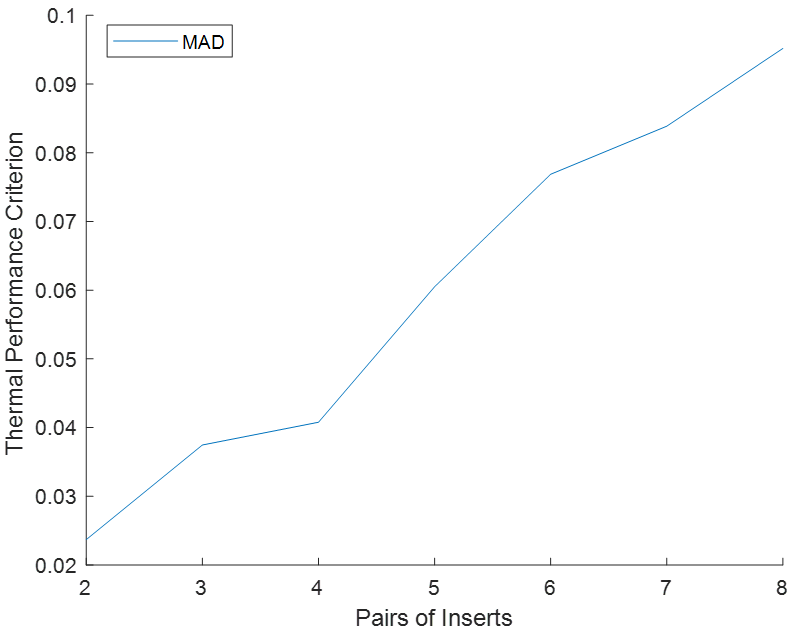
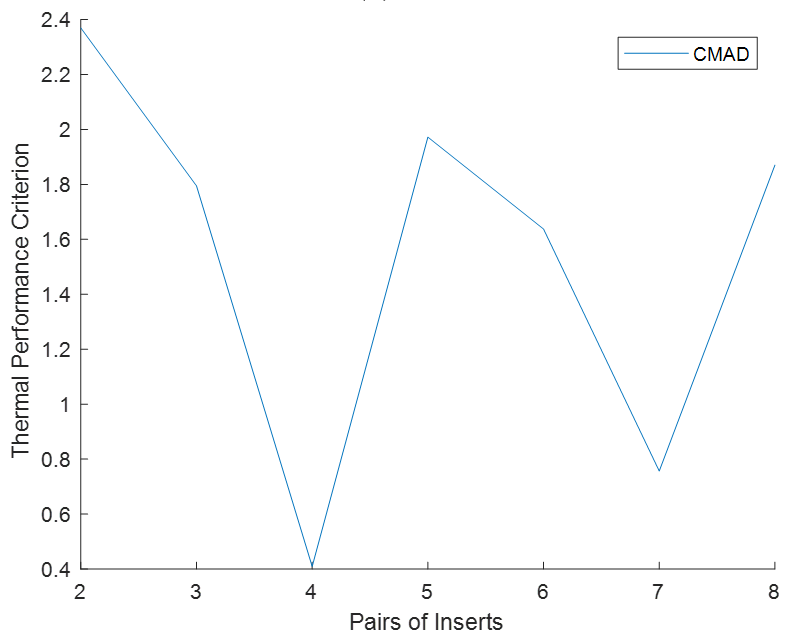
The mean average difference (M.A.D.), compared to the full volume pipe, shows an increasing pattern and ranges from 2.37–9.52%, as seen in Figure 9(a). The consecutive mean average difference (C.M.A.D.), which measures the average difference in Thermal Performance Criterion between two consecutive models, ranges from 0.41–2.37% and can be seen in Figure 9(b). The values fluctuate with a dip at four and seven pairs of inserts. This suggests that although the Thermal Performance Criterion decreases as more pipe volume is reduced, adding four and seven pairs of inserts has a greater impact in the drop in TPC compared to other consecutive additions.
5.5 Vorticity analysis
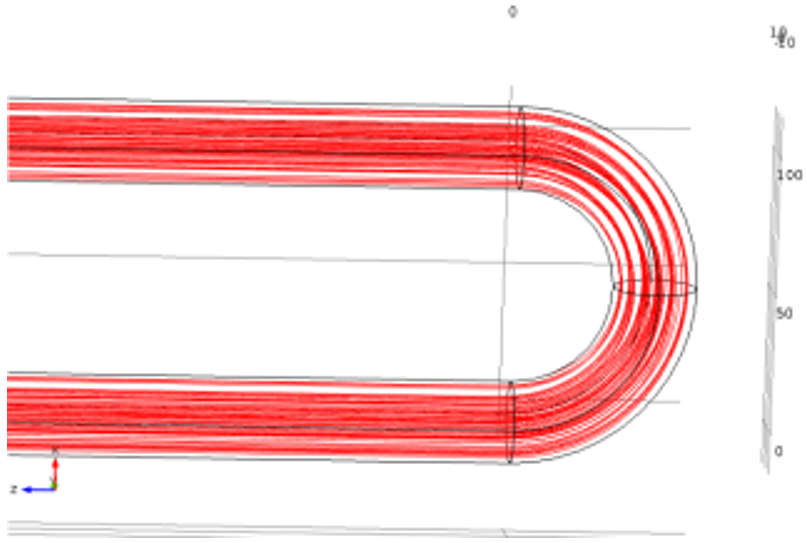
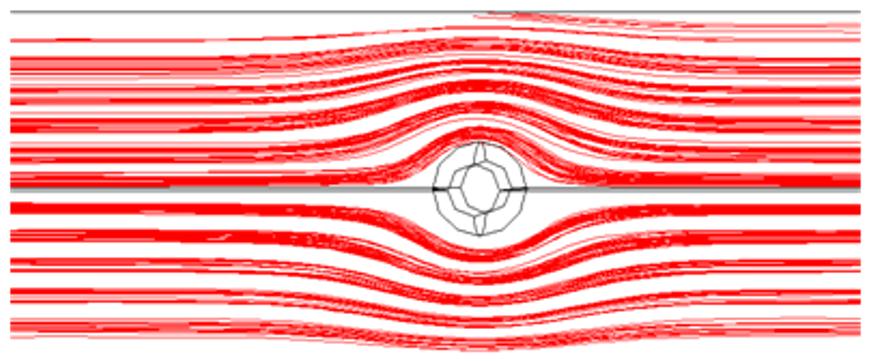
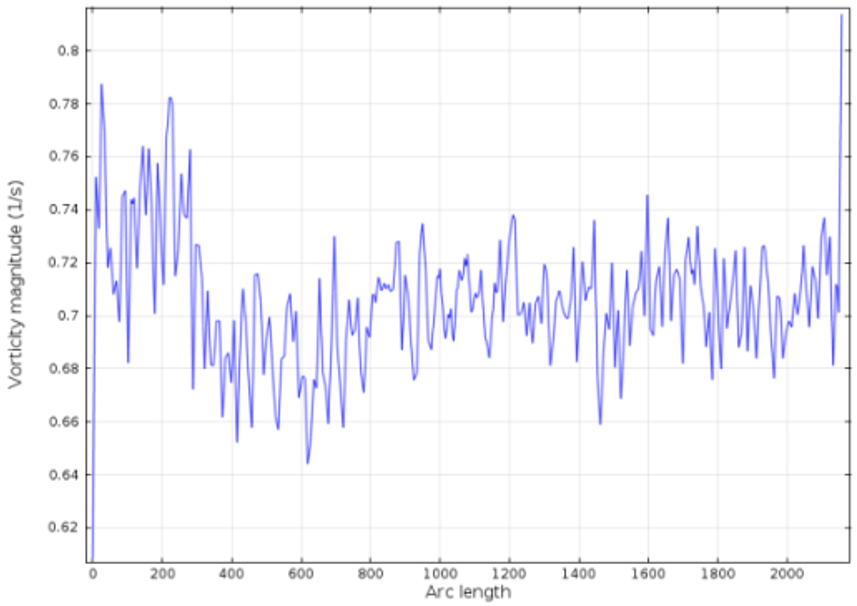
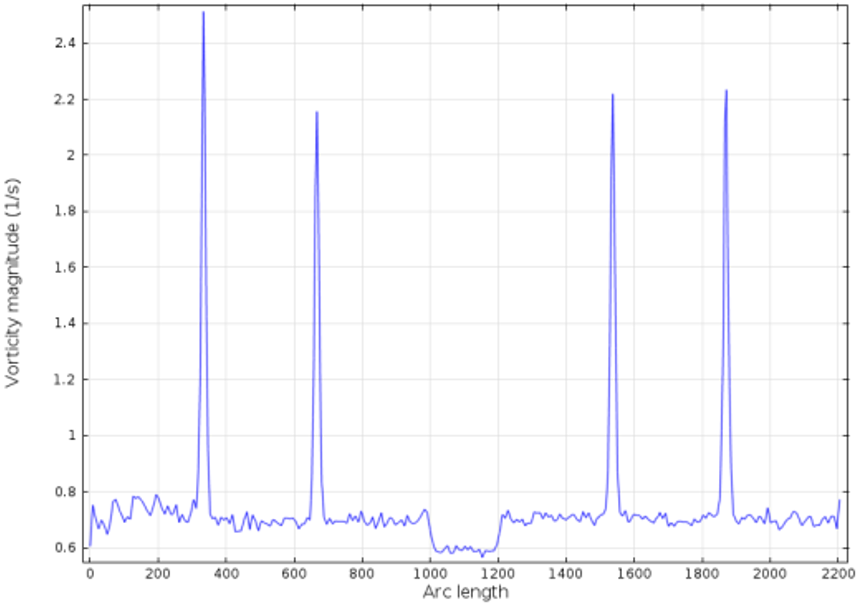
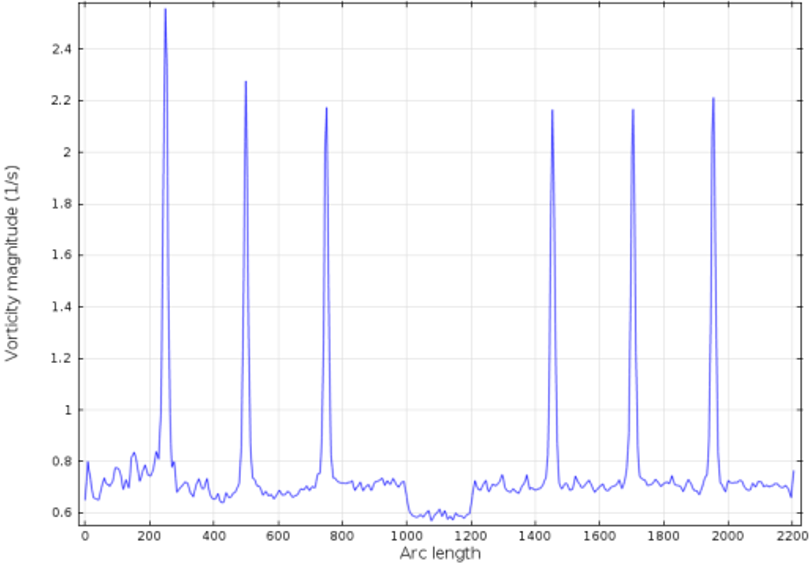
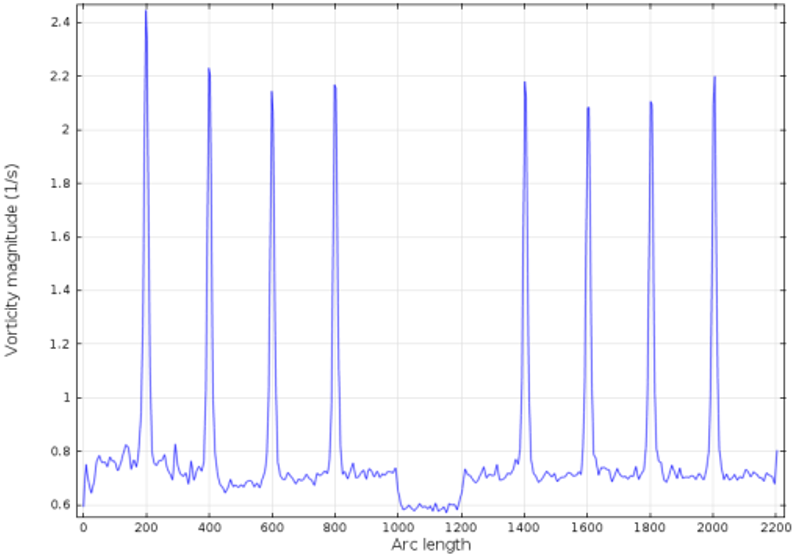
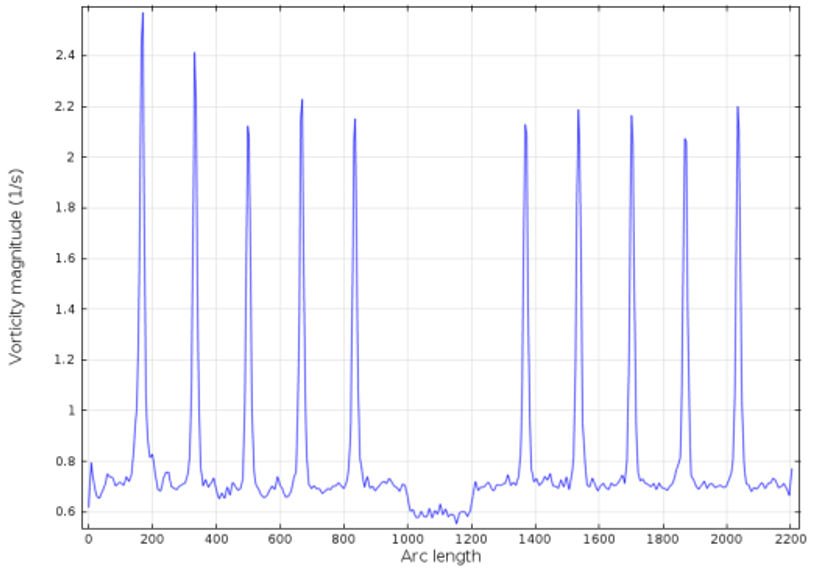
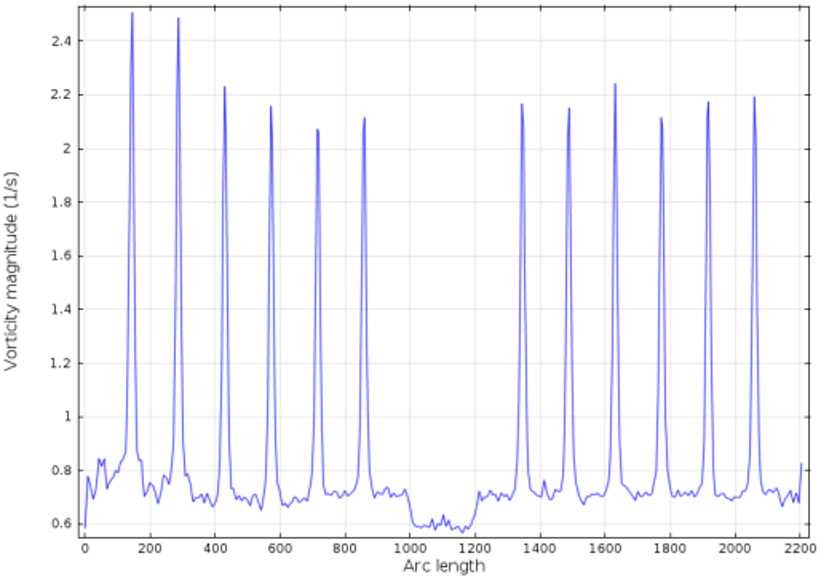
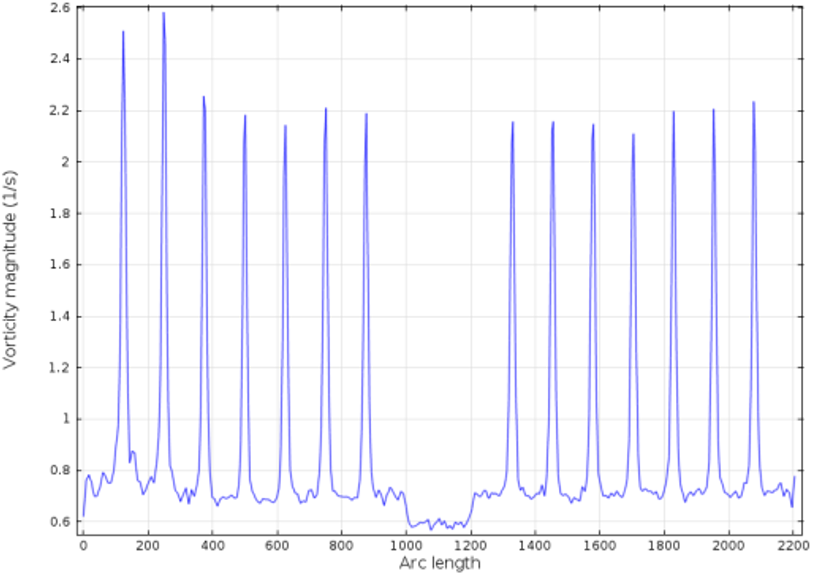
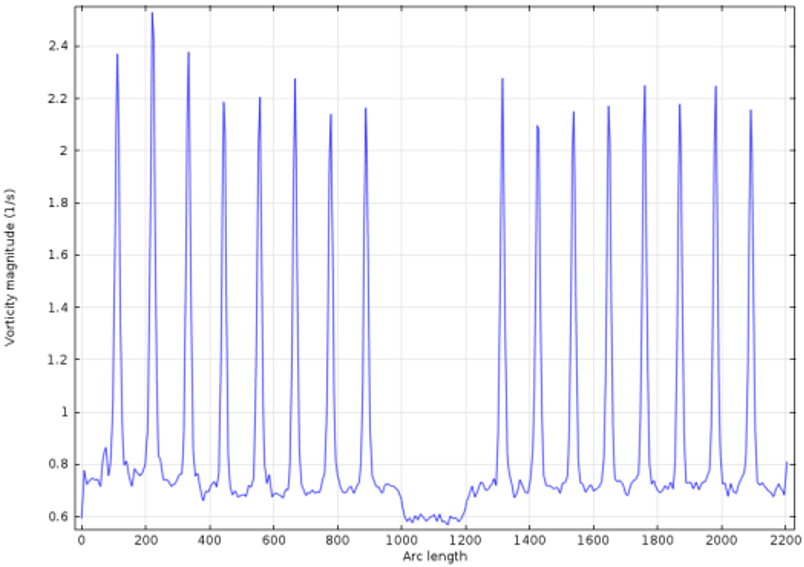
Figure 10 shows the velocity streamlines at insert and no-insert positions. As fluid passes around the insert, its velocity increases while the pressure drops. This improves fluid mixing and induces rotational motion in the fluid, leading to increased vorticity. Figure 11(a)–(h) shows the vorticity line graph for full volume and 0.53–1.38% reduced volume U-loop pipe by adding two to eight pairs of ellipsoid inserts for Reynolds number 1910. For full volume pipe, as seen in Figure 11(a), the vorticity shows slight fluctuations ranging from 0.787–0.644 (1/s), with spikes being observed in the insert positions in Figures 11(b)–(h).
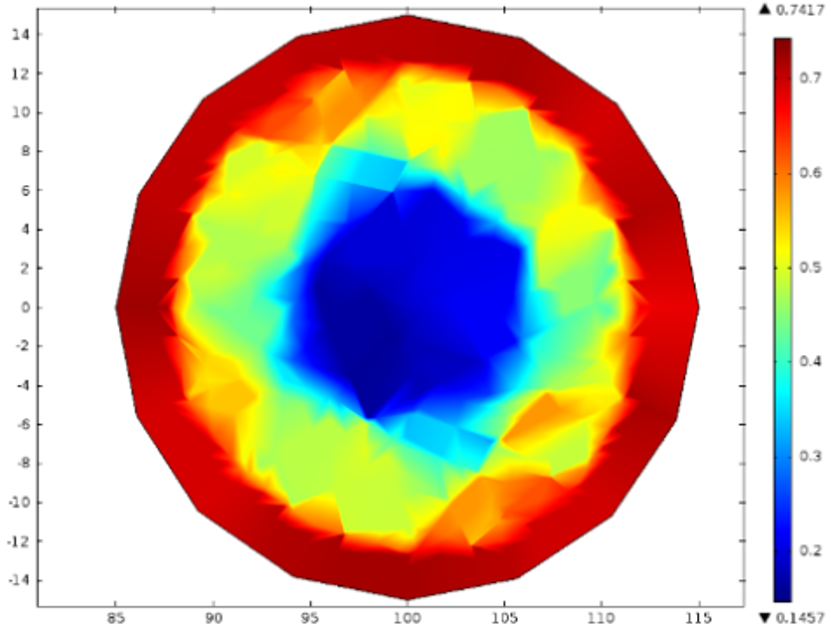
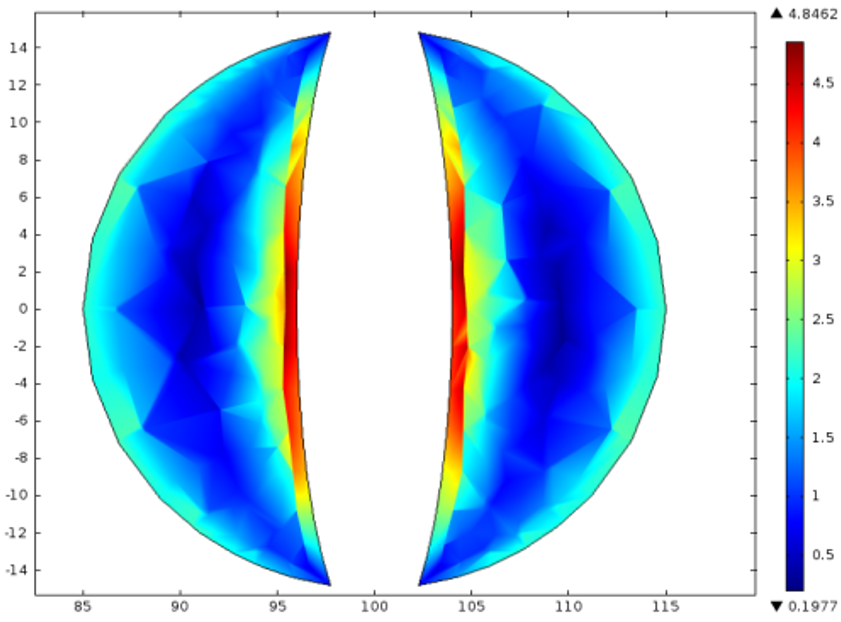
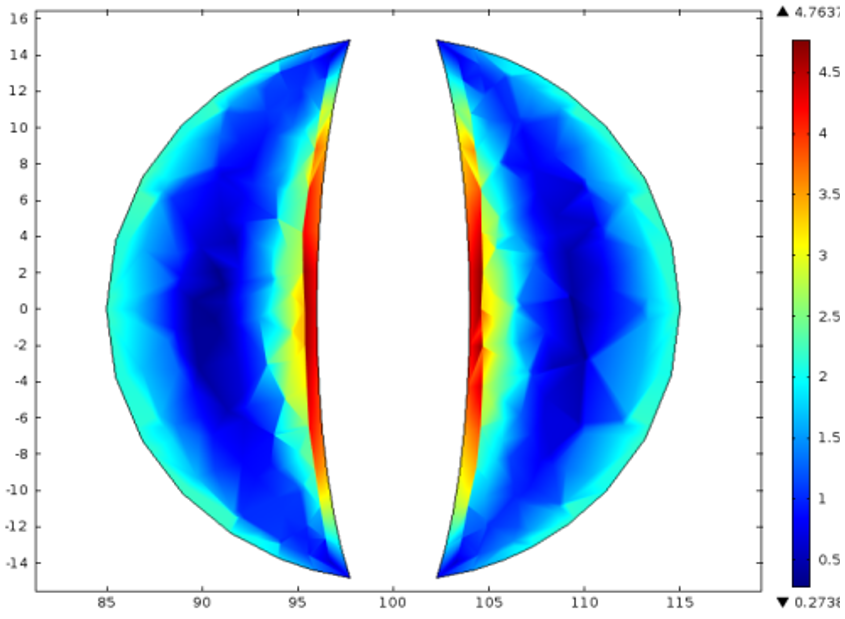
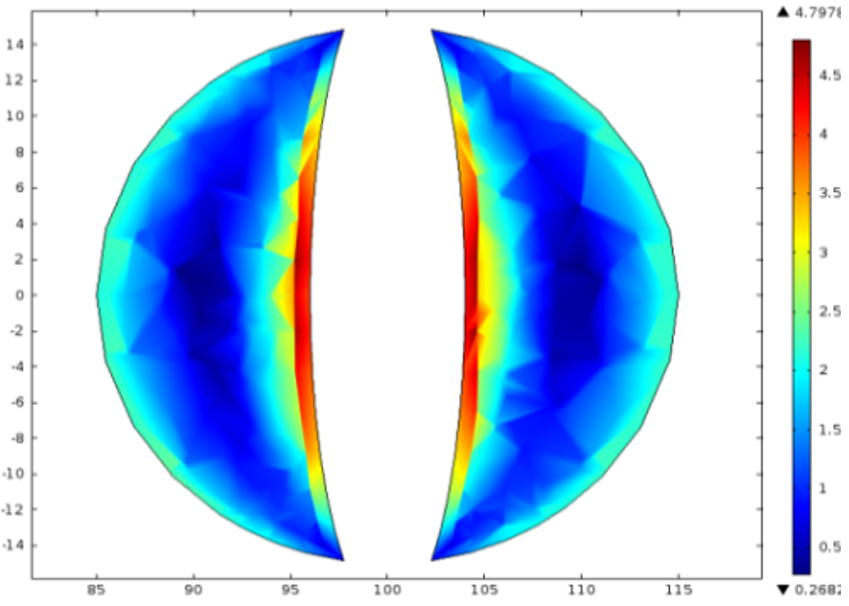
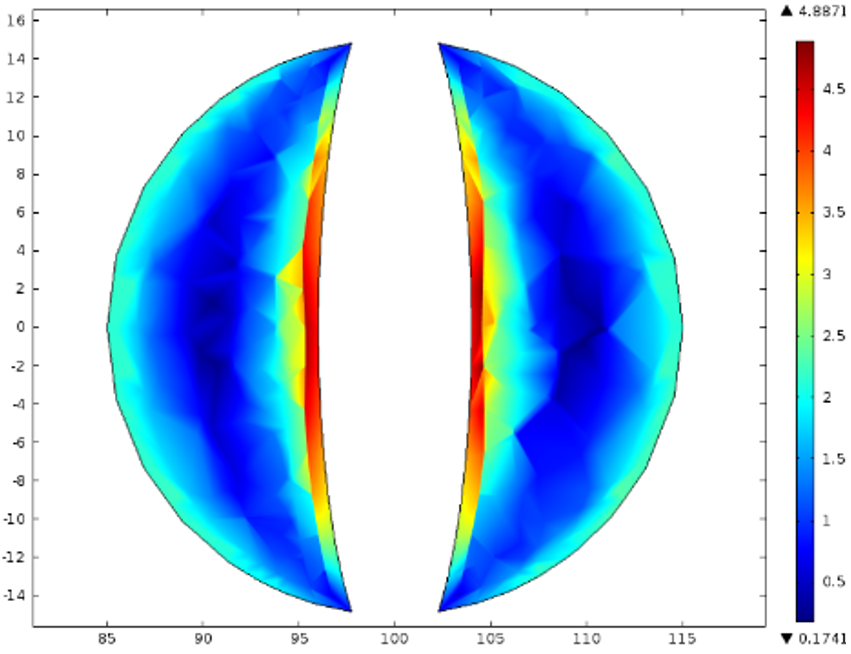
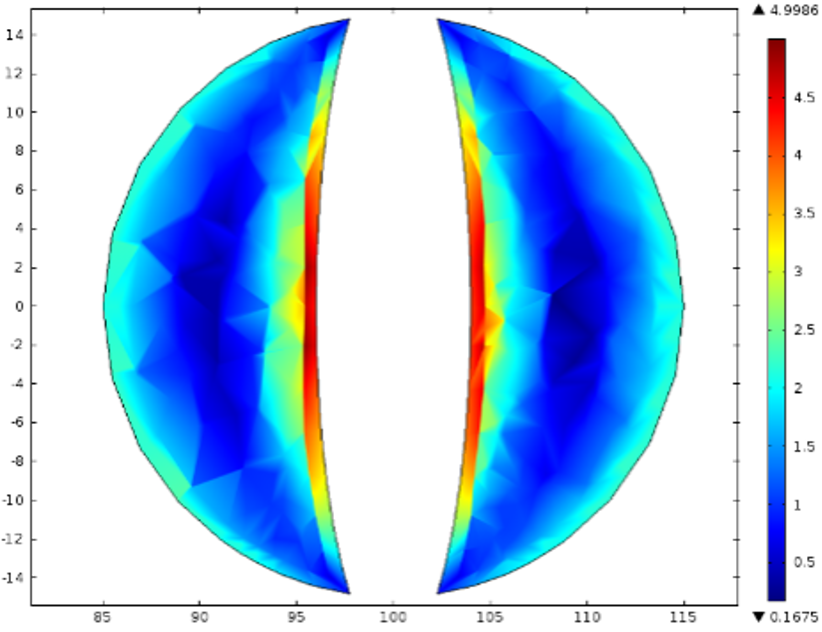
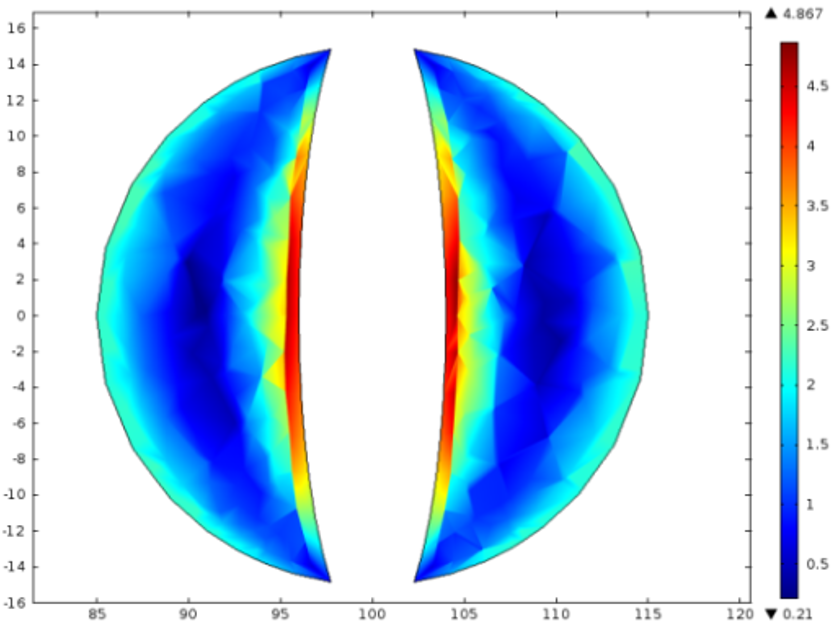
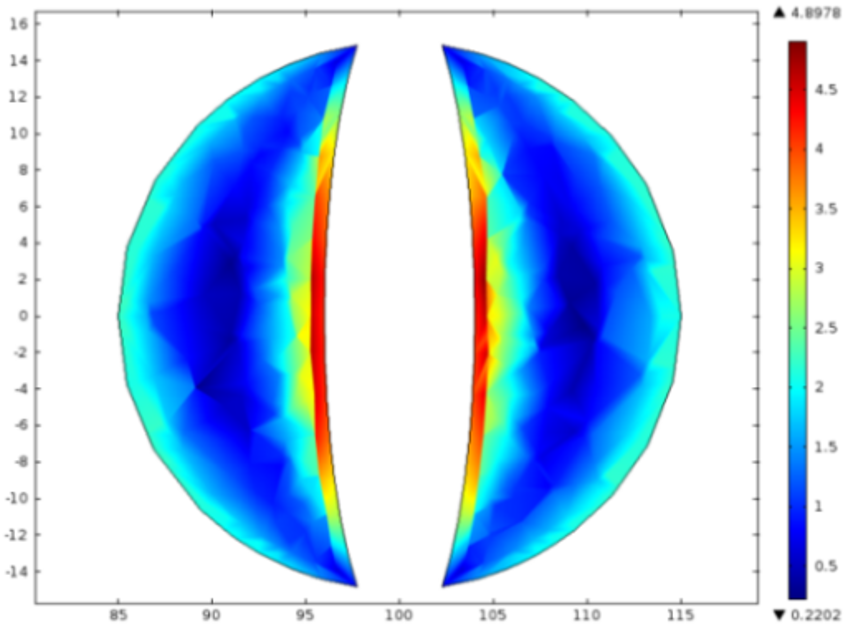
Figures 12(a)–(h) show the vorticity slices for full volume and 0.53–1.38% reduced volume U-loop pipe by adding two to eight pairs of ellipsoid inserts for Reynolds number 1910 at maximum vorticity positions of the pipe. The maximum vorticity of 0.7417 (1/s) for full volume pipe is observed at a position of 226 mm from the inlet. As ellipsoid inserts are added, the maximum vorticities of 4.8462 (1/s), 4.7637 (1/s), 4.7978 (1/s), 4.8871 (1/s), 4.9986 (1/s), 4.867 (1/s) and 4.8978 (1/s) are obtained for two to eight pairs of inserts at positions 333 mm, 250 mm, 200 mm, 166 mm, 284 mm, 250 mm and 223 mm respectively.
Simulations are carried out to numerically study the effect of 0.53–1.38% pipe-volume reduction by adding two to eight pairs of ellipsoid inserts, with two pairs corresponding to minimum volume reduction and eight pairs corresponding to maximum, on the heat transfer phenomenon compared to the full volume pipe with no inserts for Reynolds number 764-3056 under uniform heat flux conditions. Heat transfer characteristics such as Nusselt number, effectiveness, friction factor, thermal performance criterion, and vorticity are observed, and the results are analysed.
•The Nusselt number is greater as more inserts are added, with the maximum values obtained for seven pairs of ellipsoid inserts for the initial Reynolds numbers and eight pairs of inserts for the latter Reynolds numbers, while the lowest values are obtained for full volume pipe.
•The effectiveness is found to decrease with increasing Reynolds number. For the aforementioned Reynolds number range, the effectiveness is greater as more inserts are added, with the maximum effectiveness obtained for eight pairs of inserts and the minimum obtained for full volume pipe.
•The friction factor is greater as more volume of the pipe is reduced, with the maximum friction factor values obtained for eight pairs of ellipsoid inserts and the minimum values obtained for full volume pipe.
•The Thermal Performance Criterion is greater as more inserts are added, with the maximum values obtained for two pairs of inserts while the minimum values are obtained for eight pairs of inserts.
•As fluid passes around the insert, its velocity increases while the pressure drops. This improves fluid mixing and induces rotational motion in the fluid, leading to increased vorticity, which is observed as spikes at the insert positions in the line graphs.
Increased Nusselt number disrupts the boundary layer of the fluid, causing increased fluid friction. This causes increased pressure drops, resulting in higher energy costs. Likewise, a higher friction factor means higher pressure drop, which results in greater operating cost. The crucial metric is the TPC, which indicates whether or not the heat transfer enhancement outweighs the pressure drop. These factors play an important role when it comes to engineers approving a heat exchanger design.
The authors gratefully recognize the Miyan Research Institute and Simulation Lab at the International University of Business Agriculture and Technology, Dhaka, and East Delta University, Chittagong, for their invaluable help and support throughout the research process.
|
T |
temperature, K |
|
P |
pressure, Pa |
|
I |
unit matrix |
|
Nu |
Nusselt number |
|
ρ |
density of water, kg‧m-3 |
|
Re |
Reynolds Number |
|
ε |
effectiveness |
|
f |
friction factor |
|
$\eta$ |
thermal performance criterion |
|
ΔP |
pressure drop |
|
T0 |
outlet temperature |
|
Ti |
inlet temperature |
|
Twav |
wall average temperature |
|
D |
pipe diameter |
|
h |
heat transfer coefficient |
|
M.A.D. |
mean average difference |
|
C.M.A.D. |
consecutive mean average difference |
|
R.M.A.D. |
relative mean average difference |
|
R.C.M.A.D. |
relative consecutive mean average difference |
[1] Chowdhury, M.K., Bhuyan, M.M., Surja, M.C., Dilshad, D., Acherjee, S., Deb, U.K. (2025). Heat transfer efficiency in circular pipes: A simulation study on the effect of multiple geometrical shape inserts. International Journal of Heat and Technology, 43(4): 1540-1554. https://doi.org/10.18280/ijht.430431
[2] Ali, M.R., Al-Khaled, K., Hussain, M., et al. (2023). Effect of design parameters on passive control of heat transfer enhancement phenomenon in heat exchangers–A brief review. Case Studies in Thermal Engineering, 43: 102674. https://doi.org/10.1016/j.csite.2022.102674
[3] Saha, S.K., Mallick, D.N. (2004). Heat transfer and pressure drop characteristics of laminar flow in rectangular and square plain ducts and ducts with twisted-tape inserts. Journal of Heat Transfer, 127(9): 966-977. https://doi.org/10.1115/1.2010493
[4] Kozłowska, E., Szkodo, M. (2024). Contemporary and conventional passive methods of intensifying convective heat transfer—A review. Energies, 17(17): 4268. https://doi.org/10.3390/en17174268
[5] Patil, A.G. (2000). Laminar flow heat transfer and pressure drop characteristics of power-law fluids inside tubes with varying width twisted tape inserts. Journal of Heat Transfer, 122(1): 143-149. https://doi.org/10.1115/1.521448
[6] Hoshi, H.A., Abd, H.S., Rashid, F.L., Hussain, A.A. (2024). Enhancement of heat transfer characteristics by inserted novel turbulators in circular tube heat exchanger. International Journal of Heat and Technology, 42(6): 2164-2172. https://doi.org/10.18280/ijht.420635
[7] Hasan, I., Maki, W. (2023). Effect of the arrangement of a new-type of turbulator inserts on heat pipe exchanger performances. Fluid Dynamics & Materials Processing, 19(10): 2749-2759. https://doi.org/10.32604/fdmp.2023.027260
[8] Ifraj, N.F., Fahad, M.K., Tahsin, S.H., Haque, M.R., Haque, M.M. (2023). Numerical investigation of the thermal performance optimization inside a heat exchanger tube using different novel combination of perforations on Y-shaped insert. International Journal of Thermal Sciences, 194: 108583. https://doi.org/10.1016/j.ijthermalsci.2023.108583
[9] Bidari, M.V., Nagaraj, P.B., Lalagi, G., Rajesh, K. (2023). Effect of triangular perforated flat cone-shaped inserts on performance of double-tube heat exchanger. Physics of Fluids, 35(11). https://doi.org/10.1063/5.0169821
[10] Liu, P., Zheng, N., Shan, F., Liu, Z., Liu, W. (2018). Heat transfer enhancement for laminar flow in a tube using bidirectional conical strip inserts. International Journal of Heat and Mass Transfer, 127: 1064-1076. https://doi.org/10.1016/j.ijheatmasstransfer.2018.07.128
[11] Deshmukh, P.W., Prabhu, S.V., Vedula, R.P. (2016). Heat transfer enhancement for laminar flow in tubes using curved delta wing vortex generator inserts. Applied Thermal Engineering, 106: 1415-1426. https://doi.org/10.1016/j.applthermaleng.2016.06.120
[12] Saha, S.K., Polley, P.P., Dayanidhi, G.L. (2012). Laminar flow heat-transfer enhancement using transverse ribs and helical screw-tape inserts. Journal of Thermophysics and Heat Transfer, 26(3): 464-471. https://doi.org/10.2514/1.t3819
[13] Hossain, S., Deb, U.K., Rahman, K.A. (2015). The enhancement of heat transfer in a circular tube with insert and without insert by using the finite element method. Procedia Engineering, 105: 81-88. https://doi.org/10.1016/j.proeng.2015.05.010
[14] Acherjee, S., Deb, U.K., Bhuyan, M.M. (2020). The effect of the angle of perforation on perforated inserts in a pipe flow for heat transfer analysis. Mathematics and Computers in Simulation, 171: 306-314. https://doi.org/10.1016/j.matcom.2019.10.003
[15] Nashee, S.R., Ibrahim, Z.A., Kamil, D.J. (2024). Numerical investigation of flow in vertical rectangular channels equipped with three different obstacles shape. AIP Conference Proceedings, 3122: 100002. https://doi.org/10.1063/5.0216016
[16] Khashaei, A., Ameri, M., Azizifar, S. (2024). Heat transfer enhancement and pressure drop performance of Al2O3 nanofluid in a laminar flow tube with deep dimples under constant heat flux: An experimental approach. International Journal of Thermofluids, 24: 100827. https://doi.org/10.1016/j.ijft.2024.100827
[17] Kahsay Kiros, A., Goytom Tewolde, D., Kidanu Atsbeha, A., Gebremicheal Gebru, K., Tekleab Teklehaimanot, T. (2025). Effect of multi-leg twisted tape inserts on heat transfer and pressure drop characteristics of a laminar pipe flow: A comparative analysis. Case Studies in Thermal Engineering, 74: 106838. https://doi.org/10.1016/j.csite.2025.106838
[18] Bidari, M.V., Nagaraj, P.B., Rajesh, K., Lalagi, G., Panda, J.K. (2026). Numerical and experimental analysis of laminar flow heat transfer in a circular tube using metallic inserts. Heat and Mass Transfer, 62(7). https://doi.org/10.1007/s00231-026-03725-1
[19] Yu, W.H., Wiwatanapattaphee, B. (2006). Finite Element Method and Application. Mistercopy Publishing Company, Bangkok.
[20] Anika, O.I., Bhuyan, M.M., Deb, U.K. (2024). Enhancement of heat transfer in a pipe fitted with rectangular cut twisted tape inserts. International Journal of Heat and Technology, 42(5): 1501-1506. https://doi.org/10.18280/ijht.420502
[21] Wongcharee, K., Eiamsa-ard, S. (2011). Friction and heat transfer characteristics of laminar swirl flow through the round tubes inserted with alternate clockwise and counter-clockwise twisted-tapes. International Communications in Heat and Mass Transfer, 38(3): 348-352. https://doi.org/10.1016/j.icheatmasstransfer.2010.12.007
[22] Sivashanmugam, P., Suresh, S. (2007). Experimental studies on heat transfer and friction factor characteristics of laminar flow through a circular tube fitted with regularly spaced helical screw-tape inserts. Experimental Thermal and Fluid Science, 31(4): 301-308. https://doi.org/10.1016/j.expthermflusci.2006.05.005
[23] Ibrahim, E.Z. (2011). Augmentation of laminar flow and heat transfer in flat tubes by means of helical screw-tape inserts. Energy Conversion and Management, 52(1): 250-257. https://doi.org/10.1016/j.enconman.2010.06.065
[24] Jaisankar, S., Radhakrishnan, T.K., Sheeba, K.N. (2009). Studies on heat transfer and friction factor characteristics of thermosyphon solar water heating system with helical twisted tapes. Energy, 34(9): 1054-1064. https://doi.org/10.1016/j.energy.2009.03.015
[25] Wilcox, D.C. (1994). Simulation of transition with a two-equation turbulence model. AIAA Journal, 32(2): 247-255. https://doi.org/10.2514/3.59994
[26] Bergman, T.L., Lavine, A.S., Incropera, F.P., DeWitt, D.P. (2017). Fundamentals of Heat and Mass Transfer (8th ed.). John Wiley & Sons.