Yong Sun![]() | Changqi Chen | Congcong Liu | Jing Liu | Xinyu Yao | Jingrun Yan*
| Changqi Chen | Congcong Liu | Jing Liu | Xinyu Yao | Jingrun Yan*![]()
© 2026 The authors. This article is published by IIETA and is licensed under the CC BY 4.0 license (http://creativecommons.org/licenses/by/4.0/).
OPEN ACCESS
With the continuous advancement of carbon neutrality efforts, the application of coal-fired steam boilers has faced increasing restrictions, leading to higher industrial steam costs and unmet steam demand in many small- and medium-sized enterprises, thereby constraining their development. To fully utilize clean electricity and off-peak power, this study proposes a solid thermal storage-based steam production system. A mathematical model of the system is established, and a simulation model is developed using the Simulink module in MATLAB. Through simulation analysis, the influencing factors on the steam generation performance are investigated. The results indicate that the steam generation duration increases with the circulating air velocity. For every 10 ℃ rise in feedwater temperature, the steam generation duration increases by 4.8%–5.6%. Within the temperature range of 450 ℃–600 ℃, each 1 ℃ increase in the heat storage medium temperature extends the steam generation duration by 1.17%–1.21%. However, as the steam pressure increases, the steam generation duration gradually decreases, with an increase of 0.1 MPa reducing the duration by 18.33 minutes.
solid thermal storage, steam generator, steam generation performance
Steam, as the “blood” in industrial production processes, plays an important driving role in industrial production. With the continuous development of China’s industry, the demand for industrial steam has been continuously increasing. Currently, steam production in China is mainly based on coal-fired boilers, which generate a large amount of pollutants during their production process [1]. Under the social background of the “dual-carbon” goal and energy structure transformation, the application of coal-fired steam boilers is subject to many restrictions. Steam boilers mainly fueled by natural gas are affected by rising natural gas prices and limitations in gas pipeline installation, leading to increased steam costs. Therefore, the steam demand for industrial production in many small- and medium-sized enterprises cannot be met, which in turn restricts enterprise development. Meanwhile, new energy power generation technologies such as wind power and photovoltaic power have developed rapidly in China, further promoting green, low-carbon, and high-quality industrial production. Pumped storage plays an increasingly important role in peak regulation, valley filling, and renewable energy consumption [2]. However, during its operation, it has specific requirements for terrain and topography, is limited by regional space, and has high initial investment. Chemical energy storage installation scale has increased simultaneously in China [3]. Existing chemical energy storage materials have limitations in charge-discharge efficiency and cycle life, making them difficult to match the current rapidly growing trend of new energy development, and further development of new energy storage materials is required [4]. Using air as the energy storage medium, the system has low operating costs and can be applied in large-scale energy storage projects. However, current compressed air energy storage technology also faces many issues, such as difficulties in compressed heat management and low energy density, which need to be solved [5]. Solid thermal storage technology has gradually matured, but there are still some problems during operation, such as the heat storage and release characteristics of materials and the system heat storage and release time, which all have room for improvement [6]. This study proposes a solid thermal storage-based steam production system, which uses low-carbon green electricity and off-peak power mainly for industrial steam production, achieving clean, stable, low-cost, and high-quality steam supply.
For solid thermal storage technology, many scholars start from basic principles, verifying the feasibility of solid thermal storage technology through design calculations and heat transfer mechanism analysis, laying the foundation for the current development of solid thermal storage technology. Xiao designed a solid thermal storage unit applied to solar power plants, introduced the specific calculation method of the solid thermal storage unit, and proved the feasibility of solid thermal storage application by comparing three thermal storage materials. Dincer and Dost [7] analyzed that sensible heat storage, latent heat storage, and thermochemical storage technologies can solve the intermittency problem of solar energy itself, improve the system efficiency of solar systems, and discussed various evaluation indicators such as system cost and technical feasibility. Scholars at home and abroad, starting from basic principles, verify the feasibility of solid thermal storage technology through design calculations and heat transfer mechanism analysis.
Solid thermal storage technology relies on the heat storage capacity of the selected solid materials to store heat. Researchers change material properties or use different materials for comparative studies to obtain variations in system thermal storage performance and find thermal storage materials with the best performance, economy, and environmental benefits for specific application scenarios. Laing et al. [8] conducted experimental research on the application of solid sensible heat materials in solar power plants, taking concrete as an example of thermal storage material, equipping solar power plants with energy storage systems. Through the research on the design and control strategy of the energy storage system, it was found that equipping an energy storage system can improve the power generation and system efficiency of the solar power plant. Li et al. [9] carried out simulation studies on the heat storage and release characteristics of three thermal storage materials. The results showed that among the three materials, magnesium oxide had the highest thermal storage performance, but its cost was relatively high; waste ceramics had lower cost as a thermal storage material. Mawire and McPherson [10] introduced an oil-pebble bed thermal storage system. By establishing a one-dimensional model of the system, three different thermal storage materials filled inside were studied, and their thermal performance was evaluated using indicators such as heat storage capacity, thermal efficiency, and temperature distribution. Scholars at home and abroad obtain variations in system thermal storage performance by changing material properties or using different materials for comparison, finding the optimal thermal storage materials for performance, economy, and environmental benefits in specific application scenarios.
With the continuous development of solid thermal storage, researchers have conducted studies from multiple aspects such as system performance, system optimization, and application status. Teng et al. [11] proposed an optimal operation strategy for solid thermal storage electric boilers and thermal inertia CHP systems. The research results show that the control strategy based on thermal inertia can improve system flexibility and economy. Zhao et al. [12] proposed a thermal design calculation method for electric heating solid thermal storage systems and verified the feasibility of this calculation method through simulation and experiments. Wu et al. [13] summarized the current research status of solid thermal storage technology from aspects such as thermal storage materials, thermal storage body structure, and operation modes. The summary points out the existing problems of the current solid thermal storage technology, and in the future, development should be promoted from aspects such as material thermal conductivity and capacity matching.
China’s demand for industrial steam is also continuously increasing. Currently, steam production in China is mainly based on coal-fired boilers. Coal-fired boilers are an important component of steam production [14], and the large amount of pollutants emitted during their production process [15] seriously affects the ecological environment. Improving waste heat recovery, fully recovering flue gas heat during steam production, and producing steam from low-temperature flue gas [16]. Improving boiler efficiency, using new boiler technologies to improve boiler efficiency, and reducing boiler resource waste by controlling air intake, combustion state, and increasing waste heat reuse [17]. Gas boilers have high thermal efficiency and low pollution [18], but investment cost is high, and their use is restricted by natural gas consumption and incomplete pipeline construction. Biomass boilers use agricultural and forestry residues as boiler fuel [19]. Their operation fully utilizes agricultural and forestry residues, is low-carbon and environmentally friendly, and has low operating cost [20], but equipment investment is high. Regarding the application of solid thermal storage technology in steam production, researchers have discussed the prospects of electric thermal storage for steam supply from aspects of production process, development status, and system application direction, and combined with current social policies, believe that electric thermal storage steam supply can be applied in actual production under certain specific scenarios.
In summary, researchers have conducted extensive studies on solid thermal storage through a combination of experimental and simulation studies, focusing on heat storage and release characteristics, economy, operation modes, evaluation indicators, and system optimization, which have promoted the progress of solid thermal storage electric boiler technology. However, applying solid thermal storage technology to industrial steam production, especially for solid thermal storage electric boilers in steam production, has relatively few studies on related system performance, and engineering practice still faces many challenges.
2.1 Solid thermal storage steam production system
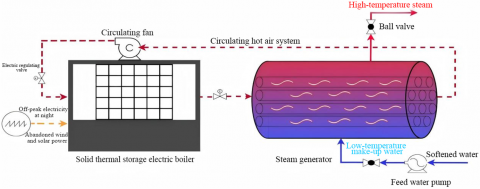
The solid thermal storage steam production system mainly consists of a solid thermal storage electric boiler, a steam generator, a circulation fan, a feedwater pump, a water softener, and other equipment. The dynamic changes of system operation parameters are the result of the combined effect of multiple devices.
The solid thermal storage steam production system belongs to the heat storage type steam production system, which utilizes off-peak electricity at night and abandoned wind and solar power to reduce system operating costs. The process flow diagram of the solid thermal storage steam production system is shown in Figure 1. According to different system working modes, the system is divided into heat storage and heat release stages. During the heat storage stage, the electric heating wire converts electrical energy into thermal energy using off-peak electricity and abandoned wind and solar power, storing heat in the thermal storage body. During the heat release stage, high-temperature hot air from the outlet of the solid thermal storage electric boiler enters the steam generator tube bundle and exchanges heat with low-temperature water, continuously transferring heat to vaporize the water and producing high-temperature steam to meet industrial peak-period steam demand.
Figure 1. Process flow diagram of solid heat storage steam production system
2.2 Establishment of mathematical model
2.2.1 Solid thermal storage steam production system parameters
The designed production parameters of the solid thermal storage steam production system are 0.5 MPa and 0.1 t/h of saturated steam, with a designed steam generation duration of 7.5 h. The thermal storage body is designed with a maximum storage temperature of 750 ℃ and a minimum heat release temperature of 400 ℃. Magnesium oxide bricks sized 250 × 150 × 90 mm, totaling 400 pieces, with a thermal storage body mass of 4034 kg, heating voltage of 380 V, and heating wire power of 86 kW are used.
The steam generator is a horizontal cylindrical device with a diameter of 1.2 m and a length of 2.6 m. The set air temperature is 300 ℃, the set airflow is 3000 m³/h, the maximum allowable pressure is 0.6 MPa, the rated steam flow is 100 kg/h, the rated steam temperature is 164.17 ℃, the heat transfer coefficient is 23 W/m²·℃, and the heat transfer area $F_2$ is 17.5 m². The circulation fan has an airflow of 1688-3517 m³/h, a rotation speed of 2900 r/min, and an air pressure of 1300-792 Pa.
2.2.2 Mathematical model of circulating air system
In the solid thermal storage steam production system, the circulating air links the solid thermal storage electric boiler and the steam generator. The circulating air absorbs heat and rises in temperature within the solid thermal storage electric boiler, carrying the stored heat from the magnesium oxide bricks. In the steam generator, the air releases heat and cools, providing heat for the continuous vaporization of low-temperature water.
(1) Circulating air inside the thermal storage electric boiler
The heat transfer of air inside the solid thermal storage electric boiler mainly has two parts: one part is the heat exchange between air and magnesium oxide bricks, and the other part is the inflow and outflow of air at the boiler inlet and outlet. Therefore, the air energy equation inside the solid thermal storage electric boiler is:
$C_2 M_2 \frac{d\left(T_{g o x}\right)}{d \tau}=C_2 M_2\left(T_{i n x}-T_{g o x}\right)+Q_x$ (1)
where, $C_2$ - specific heat capacity of air, kJ/(kg·℃); $M_2$ - mass of air, kg; $Q_x$ - heat exchange between magnesium oxide bricks and air, kJ; $T_{i n x}, T_{g o x}$ - inlet and outlet air temperature of the solid thermal storage electric boiler, ℃.
When the system is in the steam generation stage, the solid thermal storage electric boiler is in the heat release mode, providing heat to the steam generator through circulating air. At this time, the main heat transfer mode is convective heat transfer. The circulating air exchanges heat with the magnesium oxide bricks under the action of the circulation fan, and the heat transfer equation is:
$Q_x=h_x A_1\left(T_w-T_{x r t}\right)$ (2)
where, $Q_x$ - heat exchange between air and magnesium oxide bricks, kJ; $T_w$ - temperature of magnesium oxide bricks, ℃; $h_x$ - convective heat transfer coefficient between air and magnesium oxide bricks, W/(m²·℃); $A_1$ - convective heat transfer area between air and magnesium oxide bricks, m²; $T_{x r t}$ - average air temperature in the solid thermal storage electric boiler, ℃.
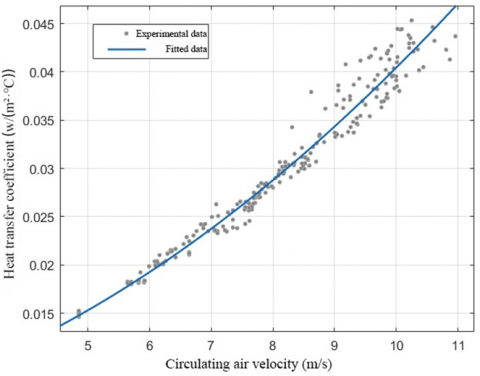
The heat transfer coefficient $h_x$ between air and magnesium oxide bricks is obtained from experimental data of the existing solid thermal storage electric boiler in the research group (Figure 2). It is considered that the boiler structure does not affect $h_x$, and the mathematical relationship between $h_x$ and circulating air velocity $v_f$ is:
$h_x=0.0003 v_f^2+0.001 v_f+0.0036$ (3)
where, $h_x$ - heat transfer coefficient between air and magnesium oxide bricks, W/(m²·℃); $v_f$ - circulating air velocity, m/s.
The root mean square error of the fitting result is 0.96984.
(2) Circulating air inside the steam generator
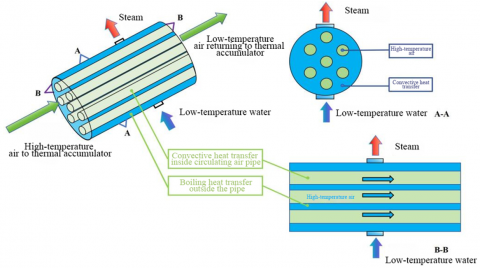
The main heat transfer process inside the steam generator is as follows: high-temperature air from the solid thermal storage electric boiler outlet enters the steam generator tube bundle and exchanges heat with low-temperature water outside the tubes. The low-temperature air after heat exchange is discharged from the steam generator outlet.
Figure 2. Fitting results of heat transfer coefficient
During heat exchange in the steam generator, air enters the tube bundle and transfers heat to the inner tube wall of the horizontal tubes through convective heat transfer. As the inner tube wall temperature rises, heat is conducted from the inner wall to the outer wall. The tube bundle is fully immersed in low-temperature water, and the heat from high-temperature air is transferred to the water by boiling heat transfer through the outer wall. The schematic diagram is shown in Figure 3.
Since the high-temperature air heated by the solid thermal storage electric boiler is the fundamental cause of the continuous vaporization of low-temperature water in the steam generator, the heat transfer process in the steam generator is the heat exchange between high-temperature air and low-temperature water, expressed as:
$Q_h=h_z A_2\left(T_{h r q}-T_{b h s}\right)$ (4)
where, $Q_h$ - heat exchange between high-temperature air and steam generator, kJ; $h_z$ - overall heat transfer coefficient, W/(m²·℃); $A_2$ - contact area between tube bundle and low-temperature water, m²; $T_{b h s}$ - saturated water temperature at the pressure inside the steam generator, ℃; $T_{h r q}$ - average air temperature in the steam generator, ℃.
Figure 3. Heat transfer diagram in the steam generator
The overall heat transfer coefficient $h_z$ is determined by the convective heat transfer coefficient $h_a$ between hightemperature air and inner tube wall, the conduction coefficient $h_b$ from inner to outer tube wall, and the boiling heat transfer coefficient $h_c$ between outer tube wall and low-temperature water.
The convective heat transfer coefficient $h_a$ is calculated according to the air flow state in the tube using the Gnielinski correlation, which accounts for the influence of the length-todiameter ratio. It is applicable for $R e_f=2300 \sim 10^6, P r_f= 0.6 \sim 10^5$:
$N u_f=\frac{(f / 8)(R e-1000) P r_f}{1+12.7 \sqrt{\left(\frac{f}{8}\right)}\left(P r_f^{\frac{2}{3}}-1\right)}\left[1+(d / l)^{2 / 3}\right]$ (5)
where, $N u_f$ - Nusselt number; $R e$ - Reynolds number; $P r_f$ - Prandtl number; $f$ - Darcy friction factor for turbulent flow in the tube; $l$ - tube length, $\mathrm{m} ; d$ - tube inner diameter, m.
The Darcy friction factor $f$ is calculated using the Konakov formula:
$f=(1.8 \log \operatorname{Re}-1.5)^{-2}$ (6)
Reynolds number is calculated as:
$R e=\frac{d v_f}{u}$ (7)
where, $v_f$ is air velocity, m/s, and $v$ is kinematic viscosity, m²/s.
The heat transfer coefficient of circulating air in the steam generator tube bundle $h_a$ is then:
$h_a=\frac{\lambda}{d} \frac{(f / 8)(R e-1000) P r_f}{1+12.7 \sqrt{\left(\frac{f}{8}\right)}\left(P r_f^{\frac{2}{3}}-1\right)}\left[1+(d / l)^{2 / 3}\right]$ (8)
where, λ is the thermal conductivity of air, W/(m·℃).
The convective heat transfer between high-temperature air and inner tube wall causes the inner wall to absorb heat and rise in temperature. Heat is conducted from inner to outer wall:
$h_b=\frac{\delta}{R}$ (9)
where, δ - tube wall thickness, mm; R - thermal resistance of carbon steel, ℃/W.
During system operation, the outer tube wall contacts low-temperature water, transferring heat by pool boiling. The average boiling heat transfer coefficient $h_c$ is calculated by:
The inner tube wall transfers heat to the outer tube wall in the form of conduction, causing the outer tube wall temperature to rise. During system operation, the tube bundle is immersed in water, and the outer tube wall is in contact with the low-temperature water inside the steam generator, transferring heat to the low-temperature water in the form of pool boiling heat transfer.
The phenomenon of boiling heat transfer is widely applied in heat exchange equipment in chemical, energy, and power fields. In practical engineering, it is necessary to know the average heat transfer characteristics of the tube bundle. Therefore, this paper adopts the formula for the average heat transfer characteristics of the tube bundle proposed by previous scholars to calculate the boiling heat transfer coefficient $h_c$, as shown in Eq. (10):
$h_c=c q^d$ (10)
where, hc - average boiling heat transfer coefficient, W/(m²·℃); c - fitting coefficient; d - fitting exponent for different heat flux regions; q - heat flux, W/m².
Using the principle of series thermal resistance superposition, the overall heat transfer coefficient $h_z$ can be calculated using heat transfer coefficients $h_a, h_b, h_c$:
$h_z=\frac{1}{\left(\frac{1}{h_a}+\frac{\delta}{h_b}+\frac{1}{h_c}\right)}$ (11)
where, $h_z$ - overall heat transfer coefficient, W/(m²·℃).
The air inside the steam generator mainly consists of two parts: heat exchange between high-temperature air and low-temperature water, and the inlet and outlet flow. The air energy equation inside the steam generator is:
$C_2 M_2 \frac{d\left(T_{g o h}\right)}{d \tau}=C_2 M_2\left(T_{i n h}-T_{g o h}\right)-Q_h$ (12)
where, $T_{g o h}$ - air temperature at steam generator outlet, ℃; $T_{i n h}$ - air temperature at steam generator inlet, ℃; $Q_h$ - heat exchange inside the steam generator, kJ.
2.2.3 Mathematical model of solid thermal storage electric boiler
This paper mainly studies the solid thermal storage steam production system when it is in the steam release operation. The solid thermal storage electric boiler acts as a heat source, using the energy stored in the thermal storage body to provide heat to the steam generator, and the overall temperature variation of the thermal storage body.
Therefore, combining the main research content, the mathematical model of the solid thermal storage electric boiler is appropriately simplified, and the assumptions are as follows:
(1) At the beginning of heat release, the internal magnesia brick temperature of the solid thermal storage electric boiler is the same and uniformly distributed, and the temperature distribution of the magnesia brick is independent of space, only related to time;
(2) When low-temperature air exchanges heat with high-temperature magnesia bricks, the magnesia brick temperature changes uniformly;
(3) The insulation layer and the outer wall inside the solid thermal storage electric boiler are adiabatic layers, and there is no heat transfer or heat loss with the outside.
By calculating the characteristic size of the magnesia brick, thermal conductivity, surface convective heat transfer coefficient, and other parameters, the Biot number of the thermal storage body is determined. Calculated as Bi < 0.1, the lumped parameter method can be used, i.e., the temperature distribution of the thermal storage body is assumed to be independent of space and only related to time, which verifies the rationality of the model assumptions. The model of the solid thermal storage electric boiler mainly concerns the heat exchange process between the internal air and high-temperature magnesia bricks. With the continuous operation of the system, the high-temperature magnesia bricks inside the boiler continuously exchange heat with low-temperature air, and the heat stored in the magnesia brick temperature decreases continuously [21]. The temperature change equation of the magnesia brick is:
$C_1 M_1 \frac{d T_w}{d \tau}=-h_x A_1\left(T_w-T_{x r t}\right)$ (13)
where, $C_1$ - specific heat capacity of magnesia brick, kJ/(kg·℃); $M_1$ - mass of magnesia brick, kg.
2.2.4 Mathematical model of steam generator
(1) Conditions and assumptions of the model
This paper takes the interface of the gas-liquid two-phase space as the standard, and establishes mass and energy conservation equations for the water side in the steam generator, mass and energy conservation equations for the steam side, and the pressure variation equation inside the steam generator. During modeling, the steam generator mathematical model is appropriately simplified, with the following assumptions:
(2) Mass conservation of the liquid side of the steam generator
According to the law of mass conservation, the main factors causing changes in the water-side mass inside the steam generator are the low-temperature feedwater entering the steam generator through the feedwater pump and the evaporation caused by absorbing heat from high-temperature air. The mass conservation equation of the water side is as follows:
$\frac{d m_w}{d t}=m_{g s}-m_{z f}$ (14)
where, $m_w$ - mass of the water side inside the steam generator, kg; $m_{g s}$ - feedwater mass, kg/h; $m_{z f}$ - evaporation mass, kg/h.
(3) Energy conservation of the liquid side of the steam generator
According to the law of energy conservation, the main factors causing changes in the energy of the water side inside the steam generator are the feedwater entering through the pump, the heat exchange between low-temperature water and high-temperature air, and the evaporation caused by absorbing heat. The water-side energy conservation equation is:
$\frac{d H_w}{d t}=m_{g s} h_{g s}+Q_h-m_{z f} h^{\prime \prime}$ (15)
where, $H_w$ - total energy of the water side inside the steam generator, kJ; $h_{g s}$ - enthalpy of feedwater, kJ/kg; $h^{\prime \prime}$ - saturated steam enthalpy corresponding to the pressure of the steam generator, kJ/kg; $Q_h$ - heat exchanged between air and the steam generator, kJ/h.
The heat exchange between high-temperature air and the steam generator is the main reason for maintaining continuous evaporation of saturated water. The evaporation calculation formula is:
$m_{z f}=\frac{Q_h-m_{g s}\left(h^{\prime}-h_{g s}\right)}{h^{\prime \prime}-h^{\prime}}$ (16)
where, $h^{\prime}$ - saturated water enthalpy corresponding to the pressure of the steam generator, kJ/kg; $h_{g s}$ - feedwater enthalpy, kJ/kg; $h^{\prime \prime}$ - saturated steam enthalpy corresponding to the pressure of the steam generator, kJ/kg; $Q_h$ - heat exchanged between air and steam generator, kJ/h.
(4) Mass conservation of the steam side of the steam generator
According to the law of mass conservation, the main factors causing changes in the steam-side mass inside the steam generator are the evaporation from absorbed heat and the outward delivery of steam. The mass conservation equation of the steam side is:
$\frac{d m_s}{d t}=m_{z f}-m_{c q}$ (17)
where, $m_s$ - mass of the steam side inside the steam generator, kg; $m_{c q}$ - steam generation, kg/h.
(5) Energy conservation of the steam side of the steam generator
According to the law of energy conservation, the main factors causing changes in the steam-side energy inside the steam generator are the evaporation caused by absorbed heat and the outward delivery of steam. The energy conservation equation of the steam side is:
$\frac{d H_s}{d t}=m_{z f} h^{\prime \prime}-m_{c q} h^{\prime \prime}$ (18)
where, $H_s$ - total energy of the steam side inside the steam generator, kJ.
For the steam generator, the overall volume does not change during operation. The mass and volume equations of the steam generator are:
$m=m_s+m_w$ (19)
$v=v_s+v_w$ (20)
At the same time, the total energy $H_s$, $H_w$ contained in the water and steam inside the steam generator can be expressed in terms of energy, mass, and enthalpy:
$H_s=m_s h_s$ (21)
$H_w=m_w h_w$ (22)
where, $h_s$ - enthalpy of water inside the steam generator, kJ/kg; $h_w$ - enthalpy of steam inside the steam generator, kJ/kg.
Taking differential on both sides of (21) and (22), the equations are:
$\frac{d H_s}{d t}=m_s \frac{d h_s}{d t}+h_s \frac{d m_s}{d t}$ (23)
$\frac{d H_w}{d t}=m_w \frac{d h_w}{d t}+h_w \frac{d m_w}{d t}$ (24)
Substitute (23) and (24) into (15) and (18), and after rearrangement, the expressions are:
$\frac{d h_s}{d t}=\left(m_{z f} h^{\prime \prime}-m_{c q} h^{\prime \prime}-h_s \frac{d m_s}{d t}\right) \frac{1}{m_s}$ (25)
$\frac{d h_w}{d t}=\left(m_{g s} h_{g s}+Q_h-m_{z f} h^{\prime \prime}-h_s \frac{d m_w}{d t}\right) \frac{1}{m_w}$ (26)
(6) Internal pressure mathematical model of the steam generator
During operation, the internal pressure of the steam generator is a dynamically changing process. Pressure changes cause the saturated water temperature and enthalpy in the evaporation zone to change, which affects the evaporation. Evaporation changes then further affect the internal pressure.
The internal pressure of the steam generator is calculated as:
$\frac{d m_s}{d t}=\frac{d\left(\rho^{\prime \prime}, v_s\right)}{d t}=v_s \frac{d \rho^{\prime \prime}}{d t}$ (27)
According to the state equation ρ=f(p, h), substituting into Eq. (19) yields:
$v_s \frac{d \rho}{d p} \frac{d p}{d t}+v_s \frac{d \rho}{d h} \frac{d h}{d t}=\frac{d m}{d t}$ (28)
Let $\frac{d \rho}{d p}=L_1, \frac{d \rho}{d h}=L_2$ the differential equation for the internal pressure of the steam generator is obtained:
$\frac{d p}{d t}=\frac{1}{v_s L_1} \frac{d m}{d t}-\frac{L_2}{L_1} \frac{d h}{d t}$ (29)
2.2.5 Physical property parameter equations
This paper establishes mathematical models for the thermal physical property parameters of various working fluids, calculating the required thermal physical property parameters under different operating conditions during system operation.
(1) Air thermal physical property parameters
To allow the established system mathematical model to more accurately reflect the changes of heat exchange, supply air temperature, and return air temperature in each system, the data provided in the air thermal physical property table are used. Using data fitting methods, the mathematical relationship between air thermal physical property parameters and temperature is obtained, as shown in (30):
$\rho=0.6408 e^{-0.005 t_a}+0.6256 e^{-0.0008 t_a}$ (30)
where, ρ - air density, kg/m³; $t_a$ - air temperature, ℃.
The root mean square error of the fitting result is 0.0072.
(2) Saturated water thermal physical property parameters
For calculation convenience, the data provided by the Thermodynamic Property Table of Water and Steam are used. Using mathematical fitting methods, the mathematical relationship between saturated water temperature and pressure is obtained, as shown in (31):
$T_{b h s}=134.6587 e^{-0.3046 p}-64.2519 e^{-5.1070 p}$ (31)
where, p - internal pressure of the steam generator, MPa.
The root mean square error of the fitting result is 0.18202.
(3) Saturated steam thermal physical property parameters
Using the water and steam thermal property parameters provided by the Thermodynamic Property Table of Water and Steam, the mathematical relationships required by this paper’s mathematical model are obtained by mathematical fitting, as shown in (32):
$\begin{aligned} v_s=-0.8075+ & 20.39 p+0.000312 h_s +0.01915 p^2-0.00517 p h_s\end{aligned}$ (32)
where, $v_s$ - specific volume of steam, m³/kg; $h_s$ - enthalpy of steam, kJ/kg.
The root mean square error of the fitting result is 0.007508.
3.1 Construction of the circulating air system simulation model
This paper selects Simulink to build the simulation model of the solid thermal storage steam production system. According to the circulating air mathematical model established in the previous chapters, it is divided into two parts: the circulating air model inside the solid thermal storage electric boiler and the circulating air model inside the steam generator. Different functional simulation modules are connected according to the mathematical relationships between input quantities, and Simulink simulation programs are built respectively.
(1) Circulating air model inside the solid thermal storage electric boiler
The circulating air exchanges heat with the magnesia bricks inside the solid thermal storage electric boiler, absorbing the heat stored in the magnesia bricks and delivering it to the steam generator. Using the encapsulation function in Simulink, the circulating air simulation model inside the solid thermal storage electric boiler is encapsulated as a subsystem within the overall simulation system.
This subsystem takes the low-temperature air temperature $T_{\text {inx }}$, flow velocity $V_f$, and heat exchange between lowtemperature air and magnesia bricks $Q_x$ as input variables, and using set state quantities such as air density and specific volume as physical property parameters, outputs the hightemperature air temperature $T_{g o x}$ after heat absorption and temperature rise.
(2) Circulating air model inside the steam generator
The circulating air carries heat from the thermal storage body to the steam generator, where the low-temperature water absorbs heat from the high-temperature air and continuously evaporates. Using the encapsulation function in Simulink, the circulating air simulation model inside the steam generator is encapsulated as a subsystem within the overall simulation system.
This subsystem takes high-temperature air temperature $T_{i n h}$, low-temperature water temperature $T_{b h s}$, and hightemperature air flow velocity $v_f$ as input variables. Using set state quantities such as heat transfer coefficient between air and steam generator, air density, specific volume, and other physical property parameters, it outputs the cooled lowtemperature air temperature $T_{g o h}$ and the heat exchanged between high-temperature air and low-temperature water $Q_h$.
3.2 Construction of the solid thermal storage electric boiler simulation model
When the solid thermal storage electric boiler is used as a heat source for steam production, the heat stored in the thermal storage body is continuously carried out by circulating air, and the temperature of the thermal storage body continuously decreases. Using the encapsulation function in Simulink, the simulation model of the thermal storage body inside the solid thermal storage electric boiler is encapsulated as a subsystem within the overall simulation system.
This subsystem takes the low-temperature air temperature $T_{i n x}$, the initial temperature of magnesia bricks, and lowtemperature air flow velocity $v_f$ as input variables. Using set state quantities such as heat transfer coefficient between air and the thermal storage body, air density, and specific volume as physical property parameters, it outputs the cooled magnesia brick temperature $T_w$ and the heat exchanged between air and thermal storage body $Q_x$.
3.3 Construction of the steam generator simulation model
Inside the steam generator, there is a coexisting state of vapor and liquid. Based on the mathematical model established using the vapor-liquid interface as the boundary, simulation block diagrams for the vapor and liquid spaces are built separately.
(1) Liquid space model inside the steam generator
The liquid space inside the steam generator absorbs the heat of high-temperature air and continuously evaporates, while the feedwater system delivers low-temperature feedwater into the steam generator. Using the encapsulation function in Simulink, the liquid space simulation model inside the steam generator is encapsulated as a subsystem within the overall simulation system.
This subsystem takes the heat exchange between hightemperature air and saturated water $Q_h$ and the mass flow rate of the feedwater pump $m_{b s}$ as input variables. Using set state quantities such as water density, enthalpy, and other physical property parameters, simulation block diagrams for mass conservation and energy conservation of the steam generator liquid space are established. The mass change $m_w$, energy change $H_w$, and the internal evaporation $m_{z f}$ during system operation are output variables.
(2) Vapor space model inside the steam generator
The vapor space inside the steam generator absorbs the vapor generated by the evaporation of high-temperature water, and simultaneously produces steam with certain parameters through the steam delivery pipeline to meet user steam demand. Using the encapsulation function in Simulink, the vapor space simulation model inside the steam generator is encapsulated as a subsystem within the overall simulation system.
This subsystem takes the evaporation amount of saturated water $m_{z f}$ and the steam generation amount $m_{c q}$ of the steam generator as input variables. Using set state quantities such as steam density, enthalpy, and other physical property parameters, simulation block diagrams for mass conservation and energy conservation of the steam generator vapor space are established. The mass change $m_s$ and energy change $H_s$ during system operation are output variables.
3.4 Simulation model of internal pressure of the steam generator
The pressure variation inside the steam generator is an important factor to determine whether the produced steam parameters meet user demand. Using the encapsulation function in Simulink, the simulation model of internal pressure of the steam generator is encapsulated as a subsystem within the overall simulation system.
This subsystem takes the differential term of steam mass $d m_s / d t$, the differential term of steam enthalpy $d h_s / d t$, steam mass $m_s$, and steam enthalpy $h_s$ as input variables. Using set state quantities such as steam density, enthalpy, and other physical property parameters, the simulation block diagram for pressure variation inside the steam generator is established. The internal pressure $p$ during system operation is the output variable.
3.5 Mathematical relationships between simulation subsystems
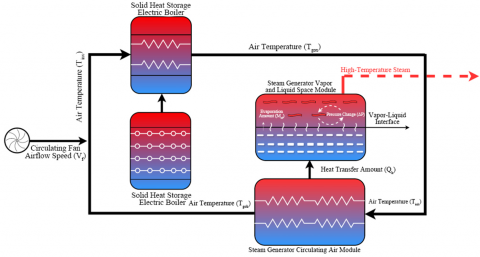
The solid thermal storage steam production system realizes the complete steam production process through energy exchange and material transfer between components during operation. The mathematical coupling relationships between simulation systems are determined according to the energy and material transfer and exchange relationships between components.
Figure 4. Relationship diagram between subsystems
Using the mathematical relationships between system components, the simulation programs of different subsystems in the system are connected, thereby constructing the simulation model of the solid thermal storage steam production system. The relationship diagram between subsystems is shown in Figure 4.
When the system starts running, the initial temperature of the magnesia bricks $T_{w 0}$ and the initial air temperature $T_{t {inxo }}$ are input as initial conditions into the solid thermal storage electric boiler and circulating air subsystems. Circulating air exchanges heat with the magnesia bricks inside the solid thermal storage electric boiler, absorbing heat and increasing in temperature, while the magnesia bricks release heat and decrease in temperature. The cooled magnesia bricks are fed back as input to the solid thermal storage electric boiler subsystem for the next heat exchange, forming a closed loop of the solid thermal storage electric boiler subsystem.
The high-temperature air $T_{g o x}$ heated by the solid thermal storage electric boiler is input as $T_{i n h}$ into the steam generator subsystem. It exchanges heat with saturated water under the internal pressure of the steam generator, allowing the saturated water to continuously absorb heat and vaporize, ensuring steam supply. The low-temperature air $T_{g o h}$ after heat exchange with saturated water is output from the steam generator subsystem and returned as input $T_{i n x}$ to the solid thermal storage electric boiler subsystem. It again exchanges heat with magnesia bricks inside the solid thermal storage electric boiler, participating in the next cycle, further forming the closed loop of the entire system.
During the above heat exchange process, the heat exchanged is output from the subsystem to the steam generator water-side mass conservation subsystem, affecting the evaporation amount inside the steam generator. This in turn affects the mass and energy conservation of the vapor-liquid inside the steam generator, causing changes in vapor-liquid states, and consequently affecting internal pressure. The simulation subsystems of the entire system are closely connected and mutually influence each other.
4.1 Validation of the simulation model
The accuracy of the simulation model is verified by comparing the experimental data of the solid thermal storage steam production system test bench from the research group with the simulation data.
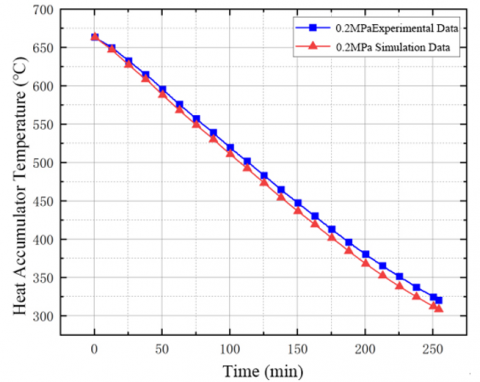
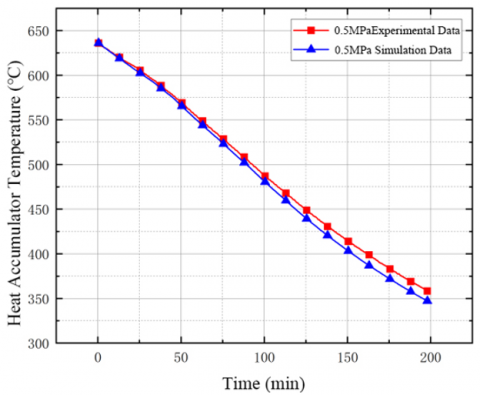
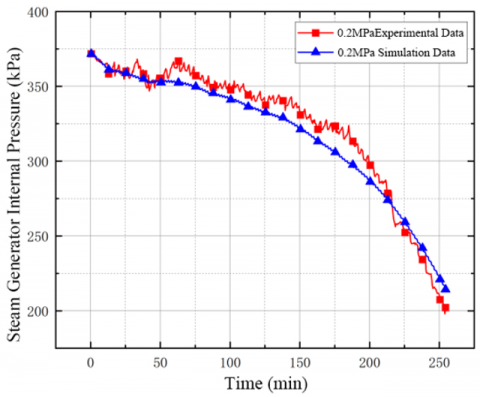
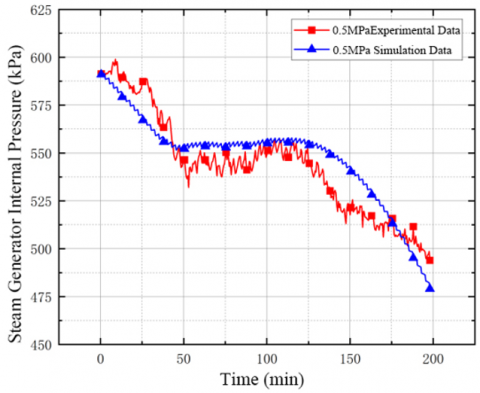
Figures 5 to 21 show the comparison of experimental data and simulation data of heat accumulator temperature, steam generator internal pressure, supply air temperature, and return air temperature under different experimental conditions.
From Figures 5 to 20, it can be seen that under different experimental conditions, the variation trends of heat accumulator temperature and steam generator internal pressure in the experimental data are consistent with the simulation data. Comparing the experimental data and simulation data, under the 0.2 MPa experimental condition, the maximum error of heat accumulator temperature change between the two is 3.82%; the maximum error of steam generator internal pressure change is 7.78%. Under the 0.5 MPa experimental condition, the maximum error of heat accumulator temperature change is 3.18%; the maximum error of steam generator internal pressure change is 6.25%. The above analysis proves the accuracy of the established solid thermal storage steam production system simulation model, which can reflect the variation of each component parameter during system operation and can be used for subsequent simulation studies.
Figure 5. Comparison of temperature change of heat accumulator
Figure 6. Comparison of steam generator pressure changes
4.2 Effect of circulating air velocity on steam production performance
The duration for which the steam production system can stably produce steam to meet user demand is an important index to evaluate the system's steam production performance. Whether the system can continuously produce steam at or above the set parameters can be judged by observing the internal parameter changes of the steam generator, thereby determining the steam production duration of the system.
The temperature difference between the initial temperature of the heat accumulator and the minimum temperature at the end of steam production is defined as the effective temperature range of the heat accumulator. The change of the effective temperature range after altering system operating conditions is defined as the variation rate of the heat accumulator effective temperature range.
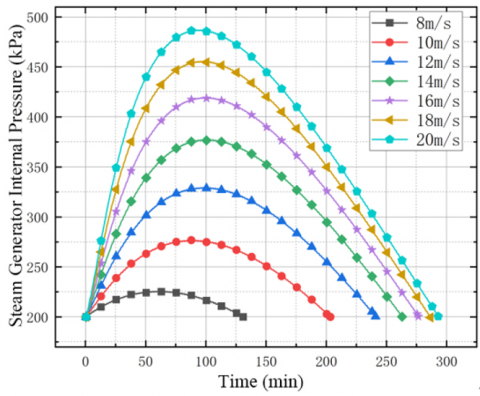
Figure 7. The pressure changes with different circulating wind speed
Based on the system simulation model, the internal pressure of the evaporator and the heat accumulator temperature variation are obtained. According to the simulation results, the variation laws of system operating parameters under different circulating air velocities are analyzed to determine the effect of circulating air velocity on system steam production performance. Based on the experimental test of circulating fan power changes, different simulation conditions are set. The system is simulated to produce steam at 0.2 MPa and 0.1 t/h, and the internal pressure variation of the steam generator is shown in Figure 7. The internal pressure variation rate is calculated from the simulation results and shown in Figure 8. The heat accumulator temperature variation is shown in Figure 9, and the temperature change rate is calculated as shown in Figure 10.
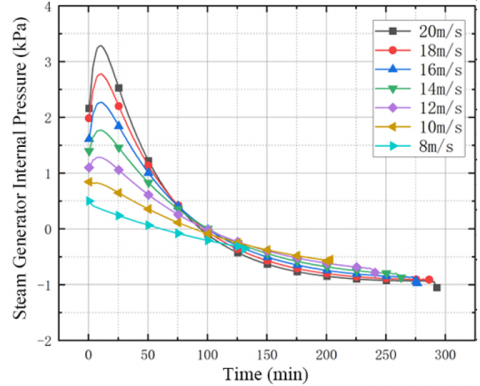
Figure 8. Rate of pressure change at different circulating wind speeds
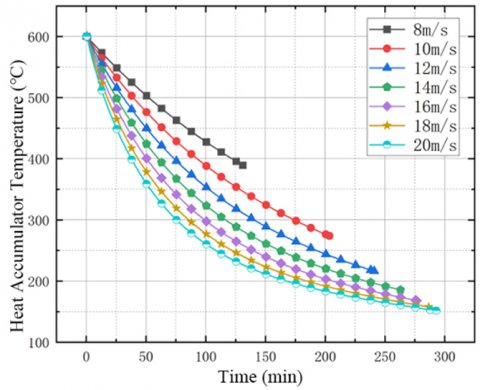
Figure 9. Temperature of accumulator at different circulating wind speed
From Figures 7 and 9, it can be seen that under different circulating air velocities, the variation trends of steam generator internal pressure and heat accumulator temperature are consistent. In the early stage of the simulation, the internal pressure rapidly rises from 0.2 MPa; the subsequent pressure rise gradually slows down; after a certain running time, the internal pressure begins to continuously decrease, and the rate of pressure decrease accelerates with running time. From Figure 9, it can be seen that under different circulating air velocities, the heat accumulator temperature variation trends are consistent, showing a rapid decrease at the initial stage; with the increase of system running time, the rate of temperature decrease gradually slows down.
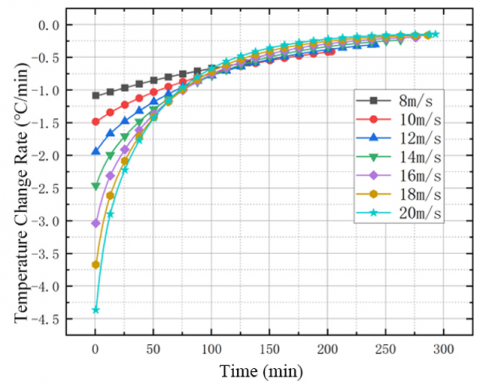
Figure 10. Temperature change rate at different circulating wind speeds
From Figures 8 and 10, it can be seen that under the same simulation condition, the maximum values of steam generator internal pressure change rate and heat accumulator temperature change rate occur at the initial stage of system operation, and the minimum values occur at the end of system operation. Under different circulating air velocities, the trends of pressure change rate and temperature change rate are consistent, and the maximum value occurs in the simulation group with a circulating air velocity of 20 m/s. During system operation, the difference between pressure change rate and temperature change rate under different simulation conditions gradually decreases, and after a certain period, the pressure and temperature change rates of each group begin to intersect. The intersection occurs at approximately 100 minutes.
At the initial stage of simulation, the system parameters are the same. The greater the circulating air velocity, the greater the heat exchange between circulating air and the heat accumulator, the greater the heat loss of the heat accumulator, and the greater the heat absorption of the steam generator. Therefore, the simulation group with a circulating air velocity of 20 m/s shows the maximum rate of steam pressure and heat accumulator temperature change. With the increase of system running time, under the same time, the higher the circulating air velocity, the lower the heat accumulator temperature in the simulation group. In the high-speed simulation condition, the temperature difference for heat exchange between circulating air and the heat accumulator begins to decrease, and the heat exchange amount begins to decrease. In the low-speed simulation group, the heat exchange temperature difference remains large, and the increased heat exchange amount caused by the temperature difference gradually compensates for the difference in heat exchange amount caused by the circulating air velocity. The heat exchange amounts of each group begin to approach, and the difference between pressure change rate and heat accumulator temperature change rate under different conditions first decreases and then intersects.
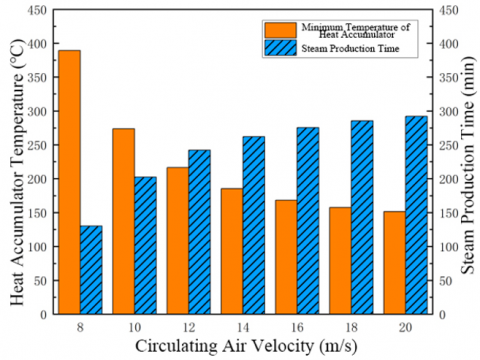
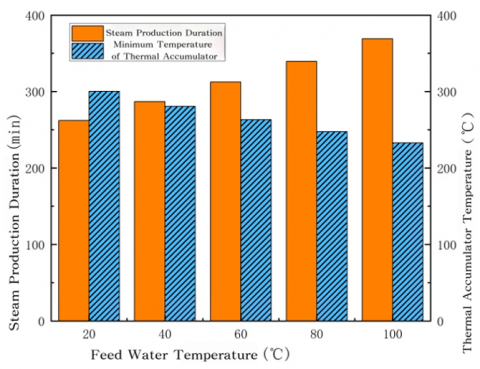
The system steam production duration and the minimum heat accumulator temperature at the end of steam production are shown in Figure 11; the variation of system steam production duration and effective temperature range of the heat accumulator are shown in Figure 12.
Figure 11. Steam production duration and minimum temperature of regenerator
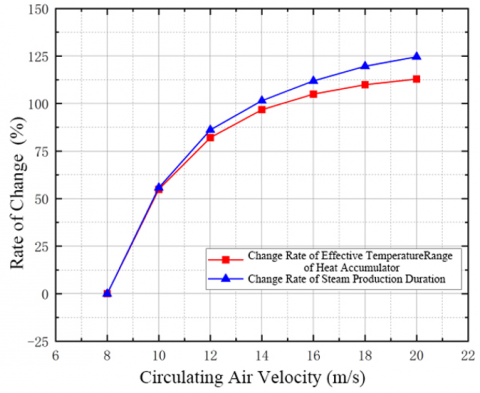
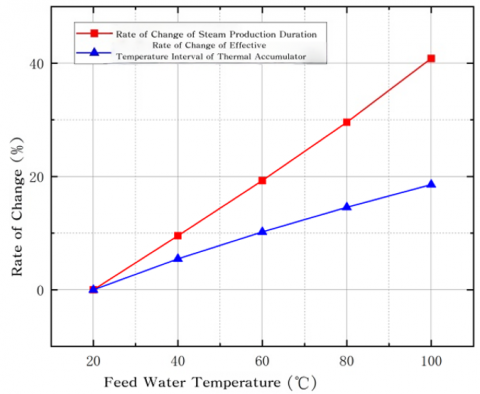
Figure 12. Effective temperature interval and steam production time change rate
Under the experimental condition of 8 m/s, the system steam production duration is 130 min, and the heat accumulator temperature is 389.29 ℃; under the experimental condition of 10 m/s, the system steam production duration is 202.5 min, and the heat accumulator temperature is 273 ℃; under the experimental condition of 12 m/s, the system steam production duration is 242 min, and the heat accumulator temperature is 216.34 ℃. The remaining simulation results are shown in Figure 15. It can be seen that with the continuous increase of system circulating air velocity, the system steam production duration continuously increases, and the minimum temperature of the heat accumulator continuously decreases. Taking the 8 m/s simulation data as the control group, the variations of system steam production duration and heat accumulator effective temperature interval under different circulating air velocities are calculated. When the circulating air velocity increases from 8 m/s to 10 m/s, the system steam production duration increases by 55.77%, and the heat accumulator effective temperature interval increases by 54.81%; when the air velocity increases from 10 m/s to 12 m/s, the system steam production duration increases by 30.38%, and the heat accumulator effective temperature interval increases by 27.26%. The remaining simulation group increase situations are shown in Figure 12.
With the increase of circulating air velocity, both the system steam production duration and the heat accumulator effective temperature interval show an upward trend, but the improvement effect of circulating air velocity on both gradually weakens as the velocity increases. When the heat accumulator temperature decreases to a specific level, further increasing the circulating air velocity to extend the steam production duration has very limited effect; at this time, the additional energy consumption is far less than the benefit brought by the extension of steam production duration. Therefore, appropriately increasing the circulating air velocity can extend steam production duration and achieve high-parameter steam production; while unrestrictedly increasing circulating air velocity will increase system operating costs and cause resource waste.
4.3 Effect of feed water temperature on steam production performance
The feed water of the solid thermal storage steam production system is delivered by the feed water pump into the steam generator for system steam production. During the simulation, based on the test data of the 0.2 MPa experimental condition, the same initial values of the system simulation model are set. By setting different feed water temperatures, the system is simulated to produce steam at 0.2 MPa and 0.1 t/h. The operating data of each component in the system under different simulation conditions are obtained, and the variation laws of system operating parameters under different feed water temperatures are analyzed to study the effect of feed water temperature on system steam production performance. The feed water temperature settings under different simulation conditions are shown in Table 1.
Table 1. Feed water temperature
|
Experimental Group (℃) |
Simulation Group 1 (℃) |
Simulation Group 2 (℃) |
Simulation Group 3 (℃) |
Simulation Group 4 (℃) |
|
20 |
40 |
60 |
80 |
100 |
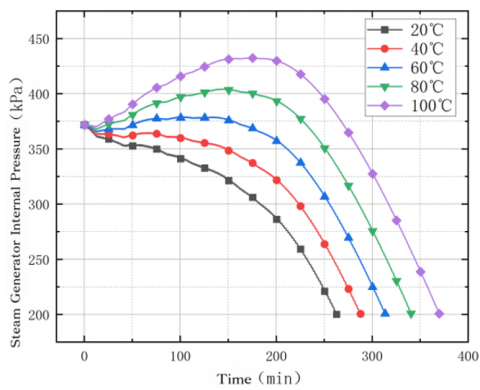
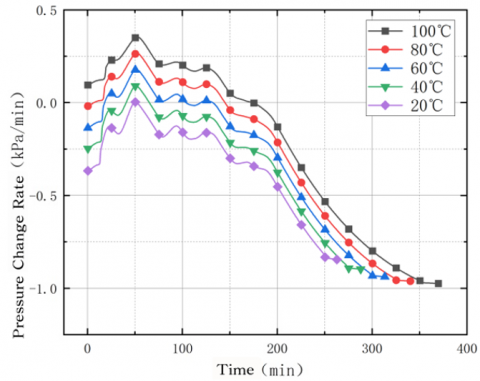
The internal pressure variation of the steam generator under different feed water temperatures is shown in Figure 13. The simulation results of the steam generator internal pressure are organized and calculated to obtain the pressure change rate, as shown in Figure 14.
From Figure 13, when the feed water temperature is 20℃, the steam generator internal pressure initially decreases slowly, and the pressure decline gradually accelerates with running time. As the feed water temperature increases, the internal pressure variation of the steam generator changes, showing a gradual increase in the initial stage of operation, and after a period of running, the internal pressure begins to decrease slowly. The maximum pressure increase occurs when the feed water temperature is 100 ℃. From Figure 14, the variation trends of steam generator internal pressure change rate under each simulation condition are basically consistent. Under the same condition, the pressure change rate fluctuates up and down in the first half of the simulation operation, and after about 200 minutes of operation, the pressure change rate begins to decrease smoothly.
Figure 13. Pressure changes at different feed water temperatures
Figure 14. Pressure change rate at different feed water temperature
The variation of steam generator internal pressure is essentially the result of the combined effects of phase change between vapor and liquid, density change, and volume effect: at the initial start, the heat accumulator releases heat intensely, and water rapidly vaporizes on the high-temperature heating surface. The steam generation rate is much higher than the steam output rate, the vapor phase fraction rapidly increases, the liquid phase density decreases, and the average density of the two-phase mixture significantly decreases, forming a rapid pressure rise stage in the closed or semi-closed space. As the heat release process continues, the heat accumulator temperature gradually decays, the evaporation rate decreases, and the steam continues to output. The mass and volume of the two-phase mixture in the system are redistributed, and when the steam generation rate is less than the output rate, the pressure begins to decline.
The system steam production duration and the minimum heat accumulator temperature at the end of steam production are shown in Figure 15; the variation of system steam production duration and the heat accumulator effective temperature interval are shown in Figure 16. Both the system steam production duration and the heat accumulator effective temperature interval increase. The effect on steam production duration shows a growing trend, but the effect on the heat accumulator effective temperature interval shows a decreasing trend.
Figure 15. Steam production duration and minimum temperature of regenerator
Figure 16. Effective temperature interval and steam production time change rate
4.4 Effect of heat accumulator temperature on steam production performance
With the same initial parameters set for each component of the simulation system, based on the test data of the 0.2 MPa experimental group, by setting different heat accumulator temperatures, the system is simulated to produce steam at 0.2 MPa and 0.1 t/h. The operating data of each component in the system under different simulation conditions are obtained, and the variation laws of system operating parameters under different heat accumulator temperatures are analyzed to study the effect of heat accumulator temperature on system steam production performance. The heat accumulator temperature settings under different simulation conditions are shown in Table 2.
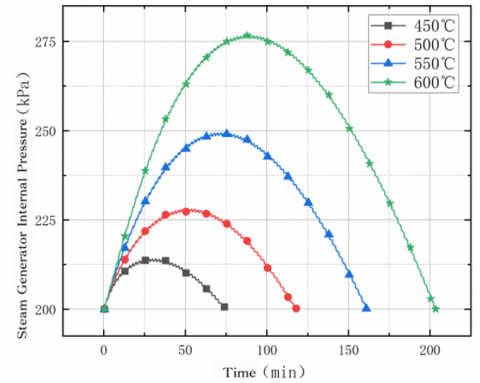
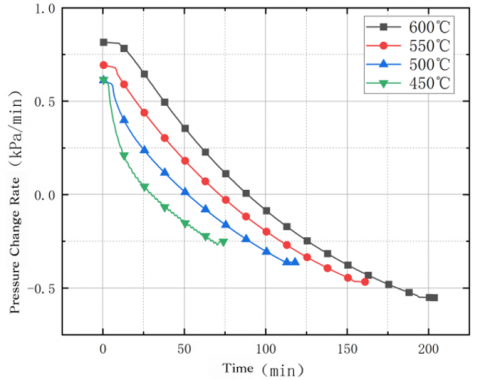
The internal pressure variation of the steam generator under different heat accumulator temperatures is shown in Figure 15. The simulation results of the steam generator internal pressure are organized and calculated to obtain the pressure change rate, as shown in Figure 17.
Table 2. Thermal accumulator temperature
|
Simulation Group 1 (℃) |
Simulation Group 2 (℃) |
Simulation Group 3 (℃) |
Simulation Group 4 (℃) |
|
450 |
500 |
550 |
600 |
Figure 17. The pressure changes with different heat accumulator temperature
Figure 18. Pressure change rate at different accumulator temperatures
The internal pressure variation trends are consistent. With the continuous increase of heat accumulator temperature, the maximum value of internal pressure continuously increases, and the maximum value occurs when the heat accumulator temperature is 600 ℃. From Figures 17 and 18, under the same simulation condition, the steam generator internal pressure shows a trend of rising first and then falling. When the pressure rises, the pressure change rate increases with the increase of heat accumulator temperature; when the pressure decreases, the pressure change rate decreases with the increase of heat accumulator temperature.
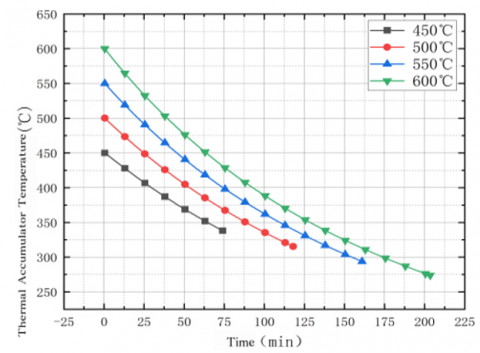
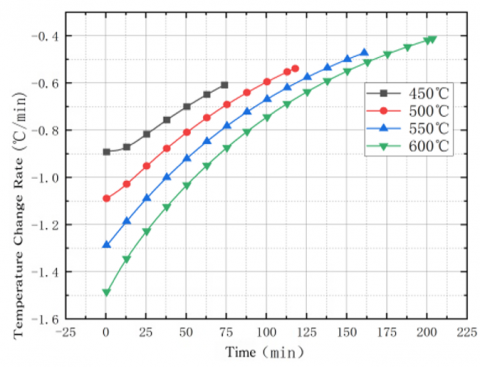
The variation of heat accumulator temperature is shown in Figure 19. The simulation results of heat accumulator temperature are organized and calculated to obtain the temperature change rate, as shown in Figure 20. From Figures 18 and 19, under different simulation conditions, the variation trends of heat accumulator temperature and temperature change rate are consistent. With the continuous increase of heat accumulator temperature, the heat accumulator temperature continuously decreases at the end of simulation. The temperature change rate increases with the increase of heat accumulator temperature, and as system running time increases, the difference between temperature change rates of each group gradually decreases.
The reason for the above variation is that when the system operates at the same circulating air velocity, with the increase of initial heat accumulator temperature, the heat exchange temperature difference between circulating air and heat accumulator increases, and the heat exchange amount between heat accumulator and circulating air correspondingly increases. The heat loss of the heat accumulator increases, which leads to the temperature change rate of the heat accumulator increasing with the increase of heat accumulator temperature. The increased heat exchange between circulating air and heat accumulator causes the heat absorbed by the steam generator to rise correspondingly, so the internal pressure of the steam generator continuously increases, and the higher the heat accumulator temperature, the greater the pressure change rate. After running for a period, the heat absorbed by the steam generator is less than the heat delivered outward, and its internal pressure begins to decrease. The heat delivered outward from the heat accumulator with higher initial temperature is higher, which can slow down the decrease rate of steam generator internal pressure. When the heat accumulator temperature drops to a certain level, the heat exchange temperature difference between circulating air and heat accumulator gradually decreases, and the heat exchange amounts of different groups gradually approach each other, resulting in the gradual narrowing of the difference between heat accumulator temperature change rates of each group.
Figure 19. Heat accumulator temperature change
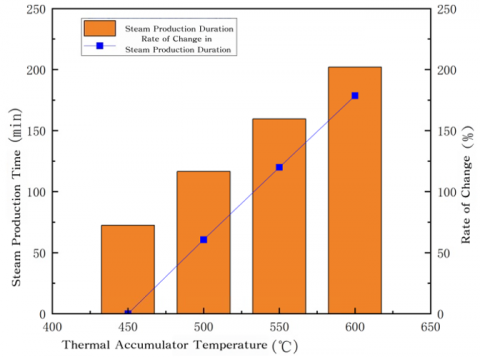
The system steam production duration and system steam production duration change rate under different heat accumulator temperatures are shown in Figure 21.
Under the experimental condition of 450 ℃, the system steam production duration is 72.5 min; under 500 ℃, the duration is 116.5 min; under 550 ℃, the duration is 159.5 min; under 600 ℃, the duration is 200 min. It can be seen that with the continuous increase of heat accumulator temperature, the system steam production duration continuously increases. Taking the simulation data at 450 ℃ as the control group, the change rate of system steam production duration under different heat accumulator temperatures is calculated, as shown in Figure 21. When the heat accumulator temperature increases from 450 ℃ to 500 ℃, the system steam production duration increases by 60.69%; from 500 ℃ to 550 ℃, it increases by 59.31%; from 550 ℃ to 600 ℃, it increases by 58.62%.
Figure 20. Temperature change rate of regenerator
Figure 21. Hours of steam production and rate of change in hours of steam production
With the increase of heat accumulator temperature, the system steam production duration continuously increases, but the effect on increasing steam production duration shows a decreasing trend. The reason is that increasing the heat accumulator temperature to extend the system steam production duration mainly changes the heat exchange amount between the heat accumulator and circulating air, thereby increasing the heat absorbed by the steam generator, slowing down the internal pressure change of the steam generator, and increasing the system steam production duration. The increase of heat accumulator temperature improves the system steam production duration, while the minimum heat accumulator temperature gradually decreases. At this time, for every 1 ℃ decrease in heat accumulator temperature, the heat that can be provided by the heat accumulator rapidly decreases. The ability of circulating hot air to extract heat from the heat accumulator rapidly weakens compared with the previous moment, resulting in a decreasing effect on the system steam production duration.
This study applied the simulation research method to the proposed solid thermal storage electric boiler, and based on the system simulation model, conducted simulation studies on the effects of circulating air velocity, feed water temperature, and heat accumulator temperature on system steam production performance.
(1) Based on actual production requirements, a solid thermal storage steam production system was proposed. The research results show that the system can stably achieve steam production with certain parameters.
(2) The system steam production duration and heat accumulator effective temperature interval increase with the increase of circulating air velocity, but the improvement effect gradually weakens. When the fan operates at 8 m/s–12 m/s, the system energy efficiency ratio is optimal. Increasing circulating air velocity can increase the system steam production duration and achieve high-parameter steam production, but unrestrictedly increasing the circulating air velocity will only increase system operating costs and cause resource waste.
(3) The system steam production duration and heat accumulator effective temperature interval increase with the increase of feed water temperature. The improvement effect on system steam production duration gradually increases, while the effect on heat accumulator effective temperature interval gradually decreases. Within the feed water temperature range of 20 ℃–100 ℃, for each 1 ℃ increase, system steam production duration increases by 0.48%–0.56%, and heat accumulator effective temperature interval increases by 0.201%–0.273%.
(4) The system steam production duration increases with the increase of heat accumulator temperature, but the improvement effect on steam production duration gradually weakens. Within the heat accumulator temperature range of 450 ℃–600 ℃, for each 1 ℃ increase, system steam production duration increases by 1.17%–1.21%.
The study of system steam production performance shows that, under consistent initial and steam production conditions, system steam production performance improves with the increase of circulating air velocity, feed water temperature, and heat accumulator temperature. Future work will further study the solid thermal storage steam production system, optimize its operating principles, and improve system control strategies to provide strong reference for its application in practical engineering.
This work is funded by Science and Technology Project of Hebei Education Department (Grant No.: QN2023076); and by Hebei innovation capability improvement project (Grant No.: 19244503D).
[1] Kang, Y.B., Yan, J.G., Liu, J.J. (2024). Developing industrial steam heat pumps to create new quality productive forces. China Energy, 46(4): 13-19. https://doi.org/10.3969/j.issn.1003-2355.2024.04.003
[2] Kong, Y., Kong, Z., Liu, Z., Wei, C., Zhang, J., An, G. (2017). Pumped storage power stations in China: The past, the present, and the future. Renewable and Sustainable Energy Reviews, 71: 720-731. https://doi.org/10.1016/j.rser.2016.12.100
[3] Revankar, S.T. (2019). Chemical Energy Storage. In Storage and Hybridization of Nuclear Energy, Academic Press, pp. 177-227. https://doi.org/10.1016/B978-0-12-813975-2.00006-5
[4] Goodenough, J.B. (2015). Energy storage materials: A perspective. Energy Storage Materials, 1: 158-161. https://doi.org/10.1016/j.ensm.2015.07.001
[5] Wang, J., Lu, K., Ma, L., Wang, J., Dooner, M., et al. (2017). Overview of compressed air energy storage and technology development. Energies, 10(7): 991. https://doi.org/10.3390/en10070991
[6] Seyitini, L., Belgasim, B., Enweremadu, C.C. (2023). Solid state sensible heat storage technology for industrial applications-a review. Journal of Energy Storage, 62: 106919. https://doi.org/10.1016/j.est.2023.106919
[7] Dincer, I., Dost, S. (1996). A perspective on thermal energy storage systems for solar energy applications. International Journal of Energy Research, 20(6): 547-557. https://doi.org/10.1002/(SICI)1099-114X(199606)20:6<547::AID-ER173>3.0.CO;2-S
[8] Laing, D., Bahl, C., Bauer, T., Fiss, M., Breidenbach, N., Hempel, M. (2011). High-temperature solid-media thermal energy storage for solar thermal power plants. Proceedings of the IEEE, 100(2): 516-524. https://doi.org/10.1109/JPROC.2011.2154290
[9] Li, W., Jing, Y., Li, Y., Xing, Z., Chen, L. (2023). Heat release simulation research based on solid heat storage and release materials. Journal of Physics: Conference Series, 2584(1): 012011. https://doi.org/10.1088/1742-6596/2584/1/012011
[10] Mawire, A., McPherson, M. (2008). Experimental characterisation of a thermal energy storage system using temperature and power controlled charging. Renewable Energy, 33(4): 682-693. https://doi.org/10.1016/j.renene.2007.04.021
[11] Teng, Y., Sun, P., Leng, O., Chen, Z., Zhou, G. (2019). Optimal operation strategy for combined heat and power system based on solid electric thermal storage boiler and thermal inertia. IEEE Access, 7: 180761-180770. https://doi.org/10.1109/ACCESS.2019.2958877
[12] Zhao, H., Yan, N., Xing, Z., Chen, L., Jiang, L. (2020). Thermal calculation and experimental investigation of electric heating and solid thermal storage system. Energies, 13(20): 5241. https://doi.org/10.3390/en13205241
[13] Wu, J., Bi, Y.H., Lu, Y.H. (2022). Research status and prospects of solid electric heat storage technology. Power Demand Side Management, 24(2): 65-71. https://doi.org/10.3969/j.issn.1009-1831.2022.02.011
[14] Saidur, R., Ahamed, J.U., Masjuki, H.H. (2010). Energy, exergy and economic analysis of industrial boilers. Energy Policy, 38(5): 2188-2197. https://doi.org/10.1016/j.enpol.2009.11.087
[15] Tumanovskii, A.G. (2017). Prospects for the development of coal-steam plants in Russia. Thermal Engineering, 64(6): 399-407. https://doi.org/10.1134/S0040601517060108
[16] Liu, C., Han, W., Xue, X. (2022). Experimental investigation of a high-temperature heat pump for industrial steam production. Applied Energy, 312: 118719. https://doi.org/10.1016/j.apenergy.2022.118719
[17] Bhatia, A. (2012). Improving energy efficiency of boiler systems. Continuing Education and Development Engineering, 2012: 1-55.
[18] Shnaiderman, M., Keren, N. (2014). Cogeneration versus natural gas steam boiler: A techno-economic model. Applied Energy, 131: 128-138. https://doi.org/10.1016/j.apenergy.2014.06.020
[19] Lora, E.S., Andrade, R.V. (2009). Biomass as energy source in Brazil. Renewable and Sustainable Energy Reviews, 13(4): 777-788. https://doi.org/10.1016/j.rser.2007.12.004
[20] Saidur, R., Abdelaziz, E.A., Demirbas, A., Hossain, M.S., Mekhilef, S. (2011). A review on biomass as a fuel for boilers. Renewable and Sustainable Energy Reviews, 15(5): 2262-2289. https://doi.org/10.1016/j.rser.2011.02.015
[21] Zhao, D., Wang, Q.M., Wang, D., Qiu, Z.L., Xu, P. (2023). Analysis of heat storage and release characteristics of different solid material heat storage bricks. Journal of Shenyang Institute of Engineering (Natural Science Edition), 19(4): 30-33. https://doi.org/10.13888/j.cnki.jsie(ns).2023.04.007
[22] Duan, S.Q., Li, J.M., Li, T.X., Li, M.G., Nie, C.H. (2025). Study on measurement performance of different water level gauges under operating conditions of steam generator. Metrology & Measurement Technology, 51(5): 54-57. https://doi.org/10.15988/j.cnki.1004-6941.2025.5.015
[23] Zhao, X.Y. (2024). Wind speed and direction measurement method based on cyclostationary characteristics. Jilin University, Jilin, China.