Ahmed Hani Ghanim![]() | Wijdan Ahmed Jalal
| Wijdan Ahmed Jalal![]() | Kadhim Al-Chlaihawi*
| Kadhim Al-Chlaihawi*![]() | Asmaa Taha Ahmed
| Asmaa Taha Ahmed![]()
© 2026 The authors. This article is published by IIETA and is licensed under the CC BY 4.0 license (http://creativecommons.org/licenses/by/4.0/).
OPEN ACCESS
This study presents an experimental comparison of a conventional single-glass, double-pass flat plate (FP) solar air heater (SAH) and an enhanced model featuring a V-corrugated plate (VCP) with steel wool (SW) as a porous absorber. The VCP enlarges the area of effective heat transfer, and the SW serves as a turbulator and a secondary heat absorber, improving convective heat transfer and thermal retention. Both 2 m² collectors were tested simultaneously under the same climatic conditions in Mosul, Iraq, during winter, with a fixed airflow rate of 0.025 kg/s. Results demonstrate that the VCP-SW configuration significantly improves thermal performance. The enhanced SAH achieved a maximum monthly thermal efficiency of 67.07%, substantially higher than the 49.70% efficiency of the conventional FP model. Furthermore, the enhanced heater consistently produced higher outlet air temperatures across all testing dates, providing clear evidence that the proposed modifications effectively increase thermal efficiency and outlet air temperature.
solar air heater, V-corrugated, steel wire, thermal efficiency
The last few decades have witnessed a dramatic increase in greenhouse gas emissions, predominantly due to anthropogenic energy use. This is exemplified by global CO2 emissions, which grew by roughly 64% from approximately 20,511.1 Mt in 1990 to over 33,621 Mt in 2019 [1]. The need for creating renewable energy systems has grown as a result of the rising use of conventional fossil fuels, their limitations, price changes, and environmental issues. Cooling, desalination, heating, drying, and power generation are only a few of the connected uses for renewable energy [2-5]. Many technologies are available for use in power generation, including wind turbines, geothermal power plants, solar photovoltaic (PV) cells, thermal plants that use biofuels, and solar thermal systems. Moving beyond traditional fossil fuel-based systems, renewable energy sources like geothermal and solar energy offer sustainable methods for heating and cooling. Among these, technologies such as solar collectors are prominent examples of renewable energy-based heating [6, 7]. Thermal energy can be used for a variety of applications. For household application, it can be used to heat water and air or as a thermal energy source in power plants. Weather and operating circumstances have a great impact on solar system performance. The use of solar air heaters (SAHs) with appropriate design and setup can be preferred in terms of cost and energy usage when compared to conventional heating systems, such as electric heaters [8-11]. In many investigations, SAHs have been examined as a clean technology for meeting space or drying needs for heat [12-14]. Exergy, energy, the coefficient of performance (COP), and the variables influencing these performance metrics have all been the subject of these investigations. The thermal performance of the trial SAH was examined by Mzad et al. [15]. By lowering the bottom and top of the system, they found that using the right materials for the components, such as the absorber, glass cover, and insulation, can increase system efficiency. A hybrid solar air heating system's performance was examined by Yu et al. [16] using an operation method. They discovered that the southern room was better heated by the passive solar heating approach, whereas the northern room was better heated by the active solar heating technique. When Kumar et al. [17] employed both bubble wrap and ceramic wool insulation in a V-corrugated absorber SAH, they discovered that the use of ceramic wool improved the system's efficiency.
Seeking to achieve better energy use, there has been much study into changing the internal geometry of SAHs, especially by the addition of ribbed surfaces, to increase convective heat transfer. The effectiveness of rib-induced turbulence in improving system efficiency has been validated by both experimental studies and computational modeling [18-22]. According to Aharwal et al. [23], the use of combined wedge-shaped ribs and grooves significantly enhances the performance of an SAH. The Nu was enhanced by 1.5–3 times and f by 2–3 times, resulting in a TPF ranging from 1.29 to 2.16. In the experimental studies of Kumar [24, 25], applying concave dimple ribs to three sides of the absorber plate—rather than a single side—resulted in a 44–67% increase in thermal efficiency relative to the conventional design.
Ceramic wool has a lower thermal conductivity than bubble wrap, which results in less heat loss from the system and a higher SAH efficiency when applied. A SAH was experimentally examined by Biçer et al. [26] under two different settings, including with and without copper wool on the absorber plate. The measurement showed that employing copper wool raised the fluid's temperature at the collector's outflow by about 8% to 14%, but it also caused a 40% increase in pressure loss. Pathak et al. [27] created dual purpose double-pass solar collectors (DPSCs) with corrugated absorbers and studied energy and exergy analysis using various air and water mass flow rates (MFRs). They created three distinct varieties of collectors: Type 1 (DPSC flat absorber plate), Type 2 (DPSC corrugated absorber plate), and Type 3 (DPSC corrugated absorber plate with straight fins). After conducting an experimental inquiry based on energy and exergy analysis, they came to the conclusion that the MFR of water and air increases as thermal efficiency increases and exergy efficiency decreases. Additionally, Type 3 DPSC was found to perform better than Types 1 and 2. A novel SAH with an absorber plate covered in copper wire mesh was constructed and produced by Devecioğlu et al. [28]. It was evaluated at two mass flow rates of 0.030 and 0.055 kg/s with collector tilt angles of 25° and 35°. Using the first and second laws of thermodynamics, respectively, as well as thermo-hydraulic efficiency, they investigated energy and exergy analysis. The findings showed that ηI ranged from 34 to 82%, ηeff from 25 to 66%, and ηII from 3.70 to 9.65%.
In this landscape, we identified a gap in regard to the combined, strategic application of a low-cost, high-surface-area corrugated geometry (V-corrugated plate (VCP)) with a low-cost and highly accessible porous turbulator/heat storage platform (steel wool (SW)), in the specific configuration within the lower air flow of a two-pass design. Though the addition of individual components (corrugations, porous media) has been explored, the combination of these components in this particular and cost-efficient, lightweight to manufacture geometry, where the objective is to maximize heat transfer while controlling pressure drop, is not well documented in SAHs, considering the Iraqi climate and operational limitations. Thus, this study's goal is to increase the effectiveness of traditional SAH with an FP by applying SAH with VCP and SW to the air channel's lower surface. The two models were analyzed under identical weather conditions and at the same airflow rate. All of the models were set up in Mosul, Iraq (36.34° latitude, 43.13° longitude, 223 m above sea level), with a 48° tilt angle with respect to the horizontal, pointing south (zero azimuth angle), and oriented south. Three test days on January 15, February 17, and March 20, 2025, were used to evaluate the performance of the two SAH models. Over the course of the three test days, information was collected on two models' solar radiation, glass, plate, air temperatures, power production, and thermal efficiency.
2.1 Experimental setup
The current research performed a comparative experimental investigation to evaluate the thermal performance of two distinct single-glass, double-pass SAH designs having a combined collector area of 2 m². The collective objective was to measure the difference in thermal efficiency improvement obtained by an advanced design over a baseline reference model under the same operating and environmental conditions.
The investigation focused on two specific configurations:
Conventional Model: A standard Flat Plate (FP) collector served as the baseline for performance comparison.
Improved Model: An enhanced design incorporating a VCP with SW integrated as a porous, low-cost heat transfer enhancer. An essential design aspect was the positioning of this VCP-SW assembly only inside the lower air path of the heater. For comparing the two collectors fairly, every external dimension, glazing, and insulation characteristic was maintained the same for both collectors.
The side-by-side tests were conducted in Mosul, Iraq, between winter months (January to March) to evaluate performance under actual seasonal conditions. Data was logged from 0800 to 1600 daily in order to capture the peak solar irradiation hours. Key to the experimental rigor was to ensure that throughout the trial period, a constant air mass flow rate of 0.025 kg/s was maintained for both heaters. Also, by simultaneous testing of the collectors, the study ensured that both the devices were subjected to the same transient weather conditions, i.e., solar irradiance and ambient temperature, thus isolating the material and geometric changes as the sole variables affecting the performance.
(a)
(b)
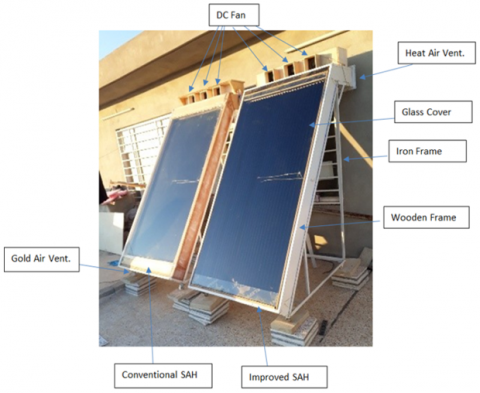
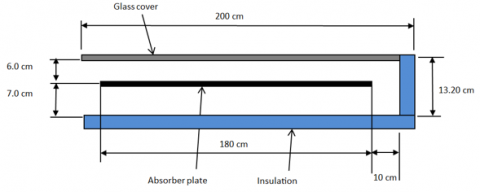
Figure 1. (a) Visual representation of the experimental setup, and (b) dimensions of SAH for two models
Figure 1(a) presents the pictorial view of the experimental setup of SAH, while Figure 1(b) shows a detailed schematic diagram illustrating the specific configuration of the absorber plate. The external structure of both models was constructed from 2 cm thick smooth compressed wood. Each collector was fitted with a single 4 mm thick glass cover and insulated with 2 cm thick compressed cork. The absorber plate of both was constructed from 1 mm thick aluminum alloy 1060-H16, but differed significantly in their surface areas. The traditional flat plate absorber had a surface area of 1.8 m², whereas the enhanced VCP with SW inserts had a larger effective area of 2.54 m². Both collectors were south-facing at a zero azimuth angle when they were tested.
To obtain maximum solar radiation absorption, the aluminum absorber plates of both collectors were painted uniformly with high-absorptivity black charcoal paint. The paint coating was applied and cured under controlled conditions in special thermal furnaces for durability and uniformity of optical properties. One of the distinguishing features of the enhanced collector was the strategic use of SW as the porous filler material. A precisely weighed quantity of 0.2 kg of SW was charged into the lower airway, measuring 1.8 m in length and 0.07 m in height. It was discovered that this quantity was sufficient to pack the cavity completely, hence offering maximum heat exchange surface area without causing too much restriction to flow. For a comprehensive overview of the system's geometry, a complete summary of the critical dimensions for both SAH models is provided in Table 1.
Table 1. Dimensions of the solar air heater (SAH) models
|
Items |
Symbol |
Dimensions |
|
Collectors slope angle |
$\beta$ |
48° |
|
Collector's orientation |
--- |
South |
|
Length of collector |
L |
2 m |
|
Width of collector |
W |
1 m |
|
Collectors total surface area |
$A_s$ |
2.0 m2 |
|
Conventional collector flat plate area |
--- |
1.8 m2 |
|
Improved collector-corrugated plate surface area |
--- |
2.54 m2 |
|
Distance between the plate and the glass cover |
--- |
0.05 m |
|
Steel wool (SW) height |
--- |
0.07 m |
|
Thickness of insulation |
--- |
0.02 m |
|
Number of covers |
$N$ |
1 |
|
Glass cover thickness |
--- |
0.004 m |
|
Plate thickness |
--- |
0.001 m |
|
Glass emissivity |
--- |
0.88 |
|
Glass transmissivity |
$\tau$ |
0.92 |
|
Absorber absorptivity |
$\alpha$ |
0.9 |
2.2 Experimental procedure
SAHs serve as a fundamental component in solar thermal systems. The conventional design consists of a glass cover, an absorber plate, and an air channel, with an electric fan controlling the airflow in active configurations. This work presents an enhanced SAH design, achieved through two key modifications to the traditional setup. First, the flat absorber plate was replaced with a VCP (45° grooved angle) to increase the surface area exposed to solar radiation. Second, SW was added as a porous insert in the lower air passage. The SW acts simultaneously as a turbulator, disrupting the boundary layer, and as a secondary heat-absorbing material that receives energy via conduction from the plate and releases it via convection to the air. The impact of these design changes was assessed by comparing the thermal efficiency and heat transfer rate of the improved and conventional models under identical, constant airflow conditions.
Both the standard and enhanced SAH models were positioned with their faces pointing due south (zero surface azimuth angle) on the roof of the Engineering Technical College laboratory building in Mosul, Iraq. ASHRAE guidelines indicate that the ideal collector tilt angles for January, February, and March are approximately 56°, 49°, and 39°, respectively [29]. The horizontal plane, which is represented by the arithmetic mean angle of the months of January, February, and March, indicates that the collector has been tilted by 48° in order to avoid the frame building complications and to maximize solar radiation.
The hourly thermal efficiency of two SAH models was used to evaluate their performance. Since the collectors were placed outside the room and immediately pointed toward the sun, the sunlight is unhindered. The exterior glass cover of the absorbers was cleaned to get rid of any dust or contaminants that might have affected the collectors' transmissivity before the results were measured. The air inside the collectors of both models has been circulated using tiny fans, three for each collector, that are controlled by variable speed regulators. With the fan turned on, air is forced through the collector at a specific speed. Every 30 minutes between 8:00 am and 4:00 pm, measurements of the incident solar irradiance, surrounding air temperature, glass surface temperature, absorber plate temperature, outlet and inlet air temperatures, and air velocity were measured during the testing process. The observations were collected concurrently over the course of these three months in order to compare the two models.
In order to estimate the intensity of solar radiation from 8:00 am to 4:00 pm, a Seaward Sun Survey 100 irradiance meter model was utilized, which allowed for an accuracy of ±0.85 W/m².
The temperature of the surrounding air, plate surface, glass, input, and outflow air was also measured at specific locations using K-type thermocouples, which have an accuracy of ±0.2 ℃. The temperature was recorded at a number of locations using two data loggers (type 8002-16A), which were set up as follows: Three channels were positioned on the glass's surface to measure the average temperature of the glass cover, and one channel was positioned to track the temperature of the surrounding air.
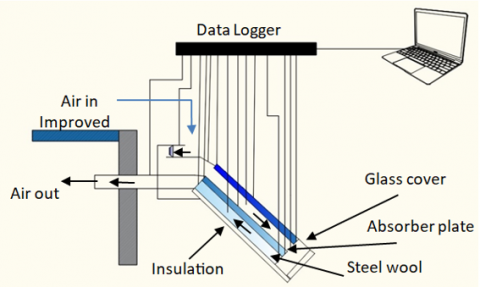
To determine the average temperature of the input air, three thermocouples were positioned halfway between the absorbent plate and the clear cover. Furthermore, as illustrated in Figure 2, three thermocouples were fixed at a midpoint between the absorbent plate and the lower surface to measure the hot air temperatures at the lower air passage, and three channels were installed at the absorbent plate's top surface to measure the mean plate temperature. The SAH air channel's air velocity was measured using a GM 816 anemometer.
Figure 2. Improved solar air heater (SAH) with data logger installation
2.3 Data reduction
The thermal efficiency can be defined as the ratio of usable energy to total incident solar radiation at a specific time [30]:
$\eta_{t h}=\frac{Q_u}{I A_s}$ (1)
The usable heat gained can be calculated using:
$Q_u=\dot{m} c_p\left(T_{\text {out }}-T_{\text {in }}\right)$ (2)
It is possible to calculate the air mass flow rate at the end of the hot air passage duct as follows:
$\dot{m}=\rho V A_f$ (3)
where, ρ is the air density, and Af is the cross-sectional area of the outlet air duct.
The useful heat gain (Qᵤ) of the solar heater is defined as the difference between the incident solar radiation absorbed and the total thermal losses from the system. The amount of heat received by the solar collector is [30]:
$Q_i=I \times A_s(\tau . \alpha)_e$ (4)
Because the temperature of the absorber plate rises and surpasses the ambient temperature when the solar heater absorbs solar energy, some of the energy will be lost to the environment. The amount of heat lost ($Q_l$) from the solar heater depends on the temperature of the air entering the heater as well as the value of the total heat loss coefficient ($U_L$).
The value of $Q_l$ can be represented as follows:
$Q_l=U_L A_s\left(T_P-T_a\right)$ (5)
The amount of usable heat ($U_u$), as determined by the steady-state heat balance equation, is the difference between the heat received and the heat lost from the solar collector.
$Q_{\mathrm{u}}=Q_{\mathrm{i}}-Q_{\mathrm{l}}$ (6)
In general, according to the Hottel-Bliss equation,
$Q_u=A_s I(\tau \alpha)_e-U_L A_s\left(T_P-T_a\right)$ (7)
In this case, As is the surface area of the SAH's glass cover, while TP and Ta are the absorber plate's and the ambient temperature, respectively.
The following represents the instantaneous thermal efficiency (η) at a given time based on the above:
$\eta=(\tau \alpha)_e-\frac{U_L\left(T_P-T_a\right)}{I}$ (8)
The Reynolds number, which is determined using the following formula, must be determined in order to determine the kind of air flow inside the SAH:
$\operatorname{Re}=\frac{\left(\dot{m} D_h\right)}{\left(A_f \mu\right)}$ (9)
where, μ is the dynamic viscosity of the air, and Af and Dh are the cross-sectional area of the hot air duct and the hydraulic diameter, respectively.
The hydraulic diameter is determined using the following formula:
$D_h=\frac{4 \times \text { cross sectional area of the flow }}{\text { wetted perimeter }}$ (10)
As air flows through the heater duct, frictional forces cause a pressure drop along its length. This total pressure loss, ΔP, can be calculated as [31]:
$\Delta p=f \frac{m^2}{\rho}\left(\frac{L}{D_h}\right)^3$ (11)
where, L is the length of the SAH, and f is the coefficient of friction. The following formula can be used to get the coefficient of friction [31]:
$f=f_0+y\left(\frac{D_h}{L}\right)$ (12)
where, $f_0$ and $y$ are constants calculated from practical experiments and their values change depending on the nature of the flow as shown in the equations below [30]:
$\begin{gathered}f_o=\frac{24}{R e}, y=0.9 \text { for laminar flow }(\operatorname{Re}<2550), \\ f_o=0.0094, y=2.93 R e^{-0.15} \text { for transitional flow }(2550< \operatorname{Re}<10^4), \\ f_o=0.059 R e^{-0.2}, y=0.73 \text { for turbulent flow }\left(10^4<\operatorname{Re}<10^5\right)\end{gathered}$
2.4 Uncertainty analysis
To ascertain the proportion of error related to pre-experiment practical measurements, the variables that directly influence the thermal efficiency value derived from the following relationship must be identified:
$\eta=\left[\frac{\dot{m} c_p\left(T_{\text {out }}-T_{\text {in }}\right)}{I A_s}\right]$ (13)
The quantity of air flowing is a function of air velocity for a fixed cross-sectional area (air stream) $A_f$, assuming that the air properties stay constant across the range of temperature variations documented in the experiment.
The error rate of the measured and determined parameters utilized in the experiment is displayed in Table 2, and the uncertainty or error rate of the measuring equipment can be calculated using the following method [32].
$\frac{\omega_\eta}{\eta}=\left[\left(\frac{\omega_m}{\dot{m}}\right)^2+\left(\frac{\omega_{\Delta T}}{\Delta T}\right)^2+\left(\frac{\omega_I}{I}\right)^2\right]^{\frac{1}{2}}$ (14)
The partial error percentage of the air temperature differential is represented by ($\left(\frac{\omega_I}{I}\right)$), the partial error percentage of the solar radiation intensity measurement by ($\frac{\omega_m}{\dot{m}}$), and the partial error percentage of the flowing air quantity by ($\frac{\omega_{\Delta T}}{\Delta T}$). The accuracy of the measuring apparatus is displayed in Table 2.
Table 2. The accuracy of measuring devices
|
Equipment |
Accuracy |
|
Digital anemometer |
±0.1 m/s |
|
Solar irradiance meter |
±0.85 W/m2 |
|
The energy meter of the fan |
± 1 W |
|
Thermocouple sensor |
±0.2 ℃ |
In this work, the performance of single-glass, double-pass classic SAH (with FP) and upgraded SAH (with VCP and SW) has been empirically evaluated for comparison. For testing both collectors, the same conditions and flow rate (0.025 kg/s) were applied. Keeping all the measurements for the two collectors' constant, the corrugated plate with the additional SW was positioned in the air heater's bottom air route. From early January to late March 2025, both collectors were built and studied on the roof of the Engineering Technical College laboratory building in Mosul, Iraq, concurrently for three months from 8:00 a.m. to 4:00 p.m., using the identical air flow (0.025 kg/s).
The findings from the readings taken in Mosul City, Iraq, in January, February, and March will be discussed in this section. examining how various elements and factors, such as the amount of energy gained, the temperature of the surrounding environment, the intensity of solar radiation, and other factors that we will go into detail about, have influenced the specifications of the two types of solar heaters (traditional and improved).
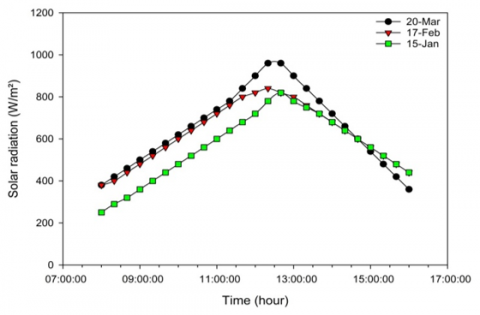
Three clear sky days were selected from each month to illustrate the differences in the quantity of daily solar radiation falling on the traditional and improved SAHs, such as January 15, February 17, and March 20, 2025, in order to investigate the factors and variables that influenced the efficiency and specifications of the traditional and improved SAHs. Generally speaking, the primary aspect influencing the effectiveness of the SAH models is the strength of the sun's radiation. For the three months of January 15, February 17, and March 20, Figure 3 displays the variation in the monthly mean daily solar radiation falling on the air heater for a daily reading time of 8:00 a.m. to 4:00 p.m. for the Mosul atmosphere. This figure makes it evident that the sun's peak position in the sky at that time limits the maximum radiation intensity values between 12:00 and 1:00 p.m. Because Mosul, Iraq, had the highest sun elevation in March, the highest figure of solar radiation intensity was recorded on March 20.
Figure 3. Variation of solar radiation intensity
(a)
(b)
(c)
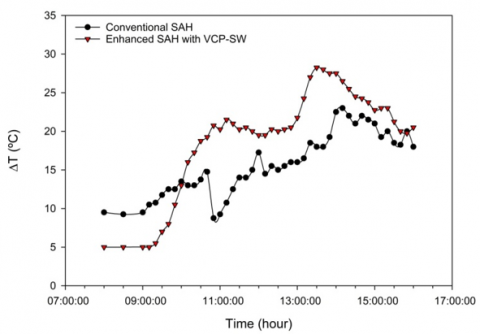
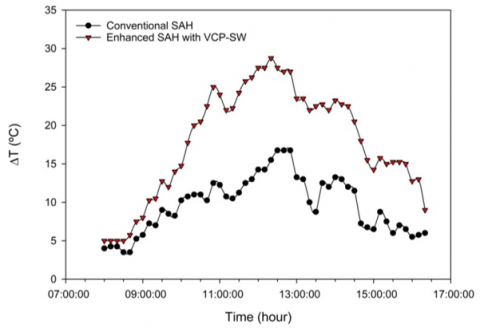
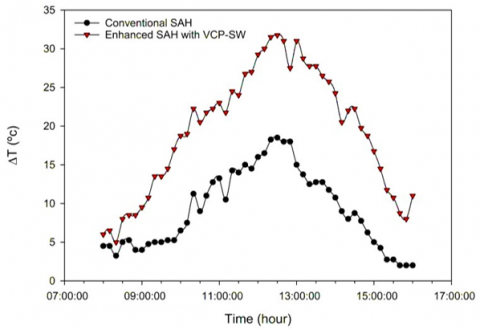
Figure 4. Temperature difference for conventional and improved SAH models for: (a) January 15, 2025, (b) February 17, 2025, and (c) March 20, 2025
The difference in the inlet and output air temperatures for the conventional and upgraded SAH models on January 15, February 17, and March 20, 2025, respectively, is displayed in Figure 4. According to Figure 4(a), the greatest difference for the better model was observed to be 28 ℃ on January 15 between 12:00 and 1:00 p.m., whereas the biggest difference for the conventional model was 23 ℃ on January 15, 2025, during the same time frames. Also, as seen in Figure 4(b), the greatest difference for the better model was observed to be 28.8 ℃ on February 17 between 12:00 and 1:00 p.m., whereas the biggest difference for the conventional model was 17.2 ℃ on February 17, 2025, during the same time frames. Furthermore, on March 20, 2025, Figure 4(c) showed that the biggest difference for the improved model was 32 ℃ between 12:00 and 1:00 p.m., whereas the top difference for the conventional model was 19 ℃ between the same time intervals on the same test day. For both the enhanced and conventional models, the difference value is near the beginning of operation at 8:00 a.m., and after 9:30 a.m., it starts to increase as the intensity of solar radiation increases. Even after noon, the difference between the improved model and the standard model is still greater because the corrugated absorbing plate absorbs more heat than the FP does, and the SW in the lower channel increases the amount of heat that is convectively transferred to the air.
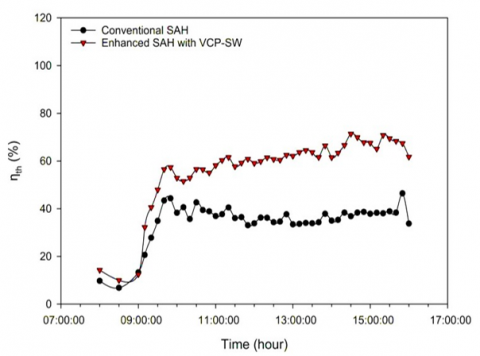
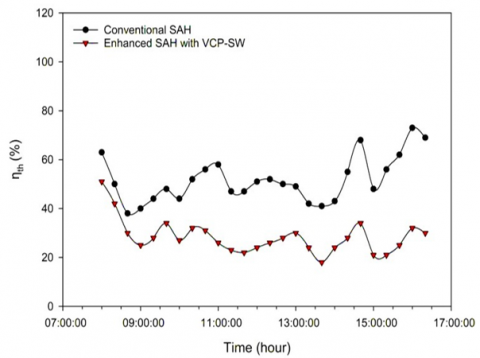
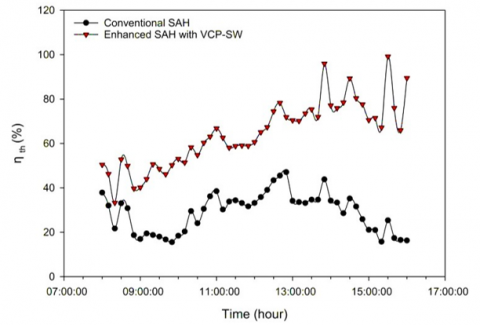
The variation of thermal efficiency for January, February, and March between the conventional and modified SAH models is displayed in Figure 5. These numbers demonstrate how the air flow velocity, the temperature differential at the entrance and output, and the amount of solar radiation all affect thermal efficiency. The enlarged surface area of the V-shaped absorber plate and the use of steel wire in the lower passage of the upgraded model's outgoing air duct during all months covered in this study make it evident that the improved SAH performs better than the conventional model. Additionally, when solar noon draws near, we can observe that the thermal efficiency value falls because of the increased intensity of solar radiation, which in turn influences the temperature differential between the air inlet and output.
(a)
(b)
(c)
Figure 5. Variation of thermal efficiency with time for conventional and improved SAH models for: (a) January 15, 2025, (b) February 17, 2025, and (c) March 20, 2025
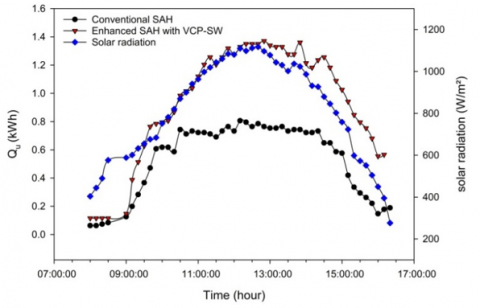
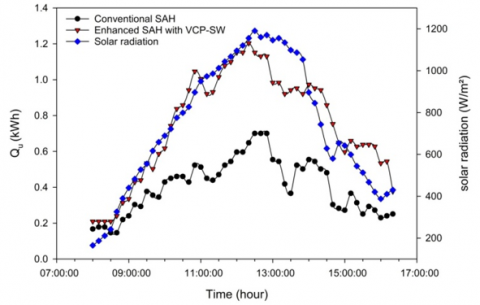
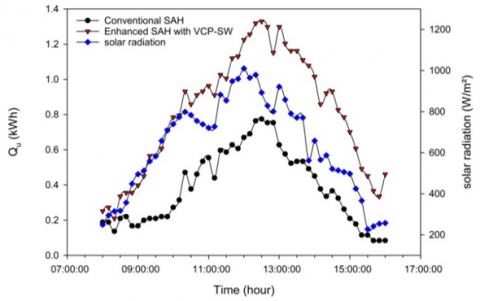
Figure 6 illustrates useful energy and solar radiation intensity on January 15, February 17, and March 20, 2025, for both traditional and upgraded SAHs. Over these months, it is clear that the amount of usable heat for the upgraded model is more than the amount for the conventional model. The additions (VCP and SW) that improved the efficiency and specifications of the standard heater are responsible for the increase in the amount of useful heat for the improved air heater, as both models receive the same amount of radiation, have a constant air flow rate of 0.025 kg/s, and have the same temperature of the air entering the solar heater. Therefore, the absorbing plate's presence increased the surface area that absorbed the rays that passed through the glass cover, and the SW helped to raise the temperature of the air in the solar heater's lower passage. On March 20, 2025, the improved SAH's useful energy was 1.38 kWh, compared to 0.87 kWh for the normal heater at solar noon. Likewise, useful energy for the normal heater at solar noon was 0.63 kWh, while the useful energy of the improved SAH was 1.18 kWh on February 17, 2025. Finally, useful energy for the normal heater at solar noon was 0.77 kWh, while the useful energy of the improved SAH was 1.36 kWh on January 15, 2025.
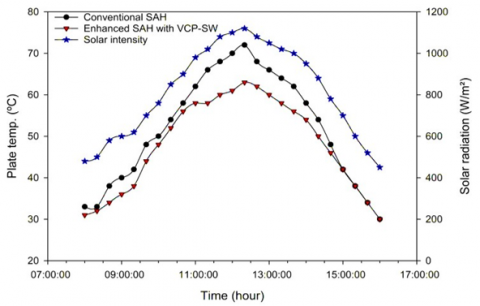
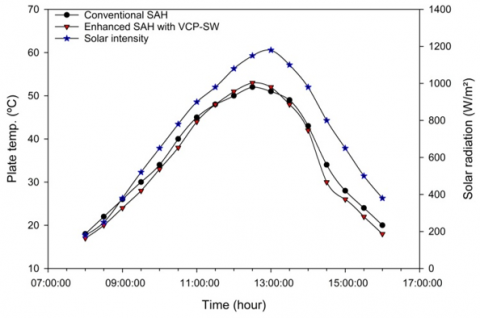
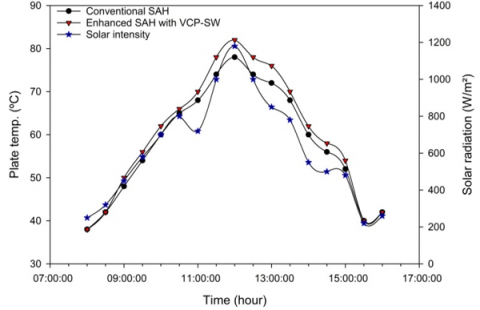
Figure 7 shows how the absorber plate's temperature varies with solar radiation intensity for the conventional and improved models on January 15, February 17, and March 20, 2025. This figure clearly shows that the amount of solar energy has a direct effect on the absorber plate's average temperature. On March 20, 2025, when solar radiation intensity peaked at 1:00 p.m., the improved model's absorber plate average temperature was 80 ℃, whereas the FP absorber's average temperature was 68.5 ℃ on the same day.
Figure 8 shows the monthly average daily fluctuation in usable heat over the three months during which this experiment was conducted. With the same quantity of solar energy hitting the glass cover, the same surface area, and the same air mass flow rate of 0.025 kg/s, the greatest average amount of heat acquired in March was 54.5 kWh for the upgraded heater and 40.4 kWh for the conventional heater. This suggests that the enhanced SAH produces more usable heat on average than the traditional one. Additionally, the enhanced heater's heat acquisition in February and January was 52.1 kWh and 40.7 kWh, whereas the traditional heater's was 38.6 kWh and 34.1 kWh.
(a)
(b)
(c)
Figure 6. Variation of useful energy and solar radiation intensity for conventional and improved SAH models for: (a) January 15, 2025, (b) February 17, 2025, and (c) March 20, 2025
(a)
(b)
(c)
Figure 7. Mean absorbent plate temperature and solar radiation intensity for conventional and improved SAH models for: (a) January 15, 2025, (b) February 17, 2025, and (c) March 20, 2025
Figure 8. Mean useful heat for conventional and improved SAH models over January 15, February 17, and March 20, 2025
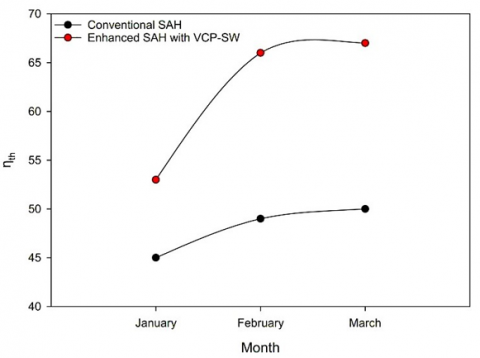
The monthly rate of change in thermal efficiency for the three months covered in this investigation is displayed in Figure 9. It is evident that the intensity of solar radiation has a significant impact on the pace of change in thermal efficiency. On March 20, 2025, the enhanced model's maximum monthly thermal efficiency rate was 67.07%, whereas the conventional model's monthly thermal efficiency rate was 49.70%. Additionally, on January 15, 2025, the data revealed that the lowest thermal efficiency for the traditional and enhanced models was 44.99% and 53.72%, respectively.
Figure 9. Variation of thermal efficiencies for conventional and improved SAH models over January 15, February 17, and March 20, 2025
When the SAH is operated, a primary pressure drop occurs for the air working in the system due to friction and a secondary drop due to the change in the direction of air flow. It was shown from the pressure drop calculations through the SAH using Eq. (11) that the pressure drop value reached 2.65 Pa for the improved model, while the pressure drop for the traditional model was 1.49 Pa for a Reynolds number of 14655. We note the high pressure drop rate for the improved model due to the presence of SW in the lower duct, which increases the friction value and thus the pressure drop.
3.1 Preliminary economic viability
One of the determinants of implementing any technical improvement is its economic viability. To compare the enhanced (VCP-SW) SAH and the traditional (FP) model, a simple payback period (SPP) analysis was carried out.
Based on local market prices in Mosul, the total estimated incremental cost ΔC is about $16.
$\Delta$ Eannual $=\frac{11.4 \mathrm{kWh}}{\text { month }} \times 8$ months $=91.2 \mathrm{kWh} / year$
$S P P($ years $)=\frac{\Delta C}{\text { Value of } \Delta E \text { per year }}$ (15)
Since the displaced energy is traditional electric heating, which has an average efficiency and a local electricity price of \$0.10 per kWh, the annual savings amount to \$9.12. Therefore:
$S P P=[\$ 16] /[9.12 \$ /$ year $] \approx 1.75 years$.
This initial calculation suggests that this minor investment in the VCP and SW improvements can be recouped in under two years in terms of saved energy expenditure, and it is an economically viable change to implement to increase the performance of SAH.
In order to expand on this research, the following research directions are suggested:
The authors extend their appreciation to the Northern Technical University, Engineering Technical College of Mosul as well as the College of Engineering, University Al-Qadisiyah, Iraq for supporting this work.
|
$A_c$ |
absorber plate surface area, m2 |
|
$A_s$ |
collector surface area, m2 |
|
$C_p$ |
air specific heat, J‧kg-1‧K-1 |
|
$D_h$ |
hydrodynamic diameter of air channel, m |
|
$I$ |
solar radiation intensity, W‧m-2 |
|
$k$ |
thermal conductivity, W‧m-1‧K-1 |
|
$L$ |
air channel length, m |
|
$\dot{m}$ |
air mass flow rate, kg‧s-1 |
|
$\Delta p$ |
pressure drop, N‧m-2 |
|
$Q_L$ |
heat loss, KW |
|
$Q_u$ |
useful heat, KW |
|
$T$ |
temperature, ℃ |
|
$U_L$ |
overall heat transfer coefficient, W‧m-2‧K-1 |
|
$V$ |
air velocity, m‧s-1 |
|
Greek symbols |
|
|
$\rho$ |
air density, kg‧m-3 |
|
$\alpha$ |
absorptivity |
|
$\eta$ |
instantaneous thermal efficiency, % |
|
$\sigma$ |
Stefan Boltzmann constant, W‧m-2‧K-4 |
|
$(\tau . \alpha)_e$ |
transmissivity-absorptivity product |
|
$\mu$ |
dynamic viscosity, kg‧m-1‧s-1 |
|
Subscript |
|
|
a |
ambient |
|
c |
cover |
|
g |
glass cover |
|
in |
inlet air |
|
out |
outlet air |
[1] Temesgen, A.L., Wassie, Y.T., Bekele, G., Ahlgren, E.O. (2025). Long-term spatially explicit electricity demand scenarios for rural electrification: The case of Ethiopia. Energy Strategy Reviews. 62: 101931. https://doi.org/10.1016/j.esr.2025.101931
[2] Enibe, S. (2002). Performance of a natural circulation solar air heating system with phase change material energy storage. Renewable Energy, 27(1): 69-86. https://doi.org/10.1016/S0960-1481(01)00173-2
[3] Rafiei, A., Loni, R., Mahadzir, S.B., Najafi, G., Sadeghzadeh, M., Mazlan, M., Ahmadi, M.H. (2022). Hybrid solar desalination system for generation electricity and freshwater with nanofluid application: Energy, exergy, and environmental aspects. Sustainable Energy Technologies and Assessments, 50: 101716. https://doi.org/10.1016/j.seta.2021.101716
[4] Dhivagar, R., Shoeibi, S., Kargarsharifabad, H., Ahmadi, M.H., Sharifpur, M. (2022). Performance enhancement of a solar still using magnetic powder as an energy storage medium-exergy and environmental analysis. Energy Science & Engineering, 10(8): 3154-3166. https://doi.org/10.1002/ese3.1210
[5] Sadeghzadeh, M., Ghorbani, B., Ahmadi, M.H., Sharma, S. (2021). A solar-driven plant to produce power, cooling, freshwater, and hot water for an industrial complex. Energy Reports, 7: 5344-5358. https://doi.org/10.1016/j.egyr.2021.08.168
[6] Qu, M., Yin, H., Archer, D.H. (2010). A solar thermal cooling and heating system for a building: Experimental and model based performance analysis and design. Solar Energy, 84(2): 166-182. https://doi.org/10.1016/j.solener.2009.10.010
[7] Sivaram, P., Mande, A.B., Premalatha, M., Arunagiri, A. (2020). Investigation on a building-integrated passive solar energy technology for air ventilation, clean water and power. Energy Conversion and Management, 211: 112739. https://doi.org/10.1016/j.enconman.2020.112739
[8] Al-damook, A., Khalil, W.H. (2017). Experimental evaluation of an unglazed solar air collector for building space heating in Iraq. Renewable Energy, 112: 498-509. https://doi.org/10.1016/j.renene.2017.05.051
[9] Al-Chlaihawi, K., Hasan, M., Ekaid, A. (2024). Optimizing of a metal foam-assisted solar air heater performance: A thermo-hydraulic analysis of porous insert placement. Environmental Science and Pollution Research, 31(24): 34995-35017. https://doi.org/10.1007/s11356-024-33593-3
[10] Sreekumar, A. (2010). Techno-economic analysis of a roof-integrated solar air heating system for drying fruit and vegetables. Energy Conversion and Management, 51(11): 2230-2238. https://doi.org/10.1016/j.enconman.2010.03.017
[11] Al‐Chlaihawi, K., Alyas, B.H., Abdullah, B.N. (2024). Optimizing of heat transfer and flow characteristics within a roughened solar air heater duct with compound turbulators. Asia-Pacific Journal of Chemical Engineering, 19(5): e3126. https://doi.org/10.1002/apj.3126
[12] Kareem, M., Habib, K., Ruslan, M., Saha, B.B. (2017). Thermal performance study of a multi-pass solar air heating collector system for drying of Roselle (Hibiscus sabdariffa). Renewable Energy, 113: 281-292. https://doi.org/10.1016/j.renene.2016.12.099
[13] Koyuncu, T. (2006). Performance of various design of solar air heaters for crop drying applications. Renewable Energy, 31(7): 1073-1088. https://doi.org/10.1016/j.renene.2005.05.017
[14] Nemś, M., Kasperski, J., Nemś, A., Bać, A. (2018). Validation of a new concept of a solar air heating system with a long-term granite storage bed for a single-family house. Applied Energy, 215: 384-395. https://doi.org/10.1016/j.apenergy.2018.02.020
[15] Mzad, H., Bey, K., Khelif, R. (2019). Investigative study of the thermal performance of a trial solar air heater. Case Studies in Thermal Engineering, 13: 100373. https://doi.org/10.1016/j.csite.2018.100373
[16] Yu, Z., Ji, J., Sun, W., Wang, W., Li, G., Cai, J., Chen, H. (2014). Experiment and prediction of hybrid solar air heating system applied on a solar demonstration building. Energy and Buildings, 78: 59-65. https://doi.org/10.1016/j.enbuild.2014.04.003
[17] Kumar, P.G., Balaji, K., Sakthivadivel, D., Vigneswaran, V., Meikandan, M., Velraj, R. (2019). Effect of using low-cost thermal insulation material in a solar air heating system with a shot blasted V-corrugated absorber plate. Thermal Science and Engineering Progress, 14: 100403. https://doi.org/10.1016/j.tsep.2019.100403
[18] Prakash, C., Saini, R.P. (2019). Use of artificial roughness for performance enhancement of solar air heaters—A review. International Journal of Green Energy, 16(7): 551-572. https://doi.org/10.1080/15435075.2019.1598418
[19] Arunkumar, H.S., Vasudeva Karanth, K., Kumar, S. (2020). Review on the design modifications of a solar air heater for improvement in the thermal performance. Sustainable Energy Technologies and Assessments, 39: 100685. https://doi.org/10.1016/j.seta.2020.100685
[20] Rashid, F.L., Eleiwi, M.A., Mahdi, A.J., Al-Obaidi, M.A., Alrasheedi, N., Ben Hamida, M.B. (2025). Enhancing the performance of a solar air heater by alphabetic-shaped ribs: A comprehensive review. Journal of Thermal Analysis and Calorimetry, 150: 17073-17100. https://doi.org/10.1007/s10973-025-14621-x
[21] Al-Chlaihawi, K.K.I., Alyas, B.H., Badr, A.A. (2023). CFD based numerical performance assessment of a solar air heater duct roughened by transverse-trapezoidal sectioned ribs. International Journal of Heat & Technology, 41(5): 1273-1281. https://doi.org/10.18280/ijht.410517
[22] Abbas Alhilali, H.A., Al-Chlaihawi, K., Zarzoor, A.K., Flayyih, M.A. (2025). Optimization of thermohydraulic parameters in solar air heater ducts featuring I-shaped ribs. Heat Transfer, 54(6): 3790-3814. https://doi.org/10.1002/htj.23384
[23] Aharwal, K.R., Pawar, C.B., Chaube, A. (2014). Heat transfer and fluid flow analysis of artificially roughened ducts having rib and groove roughness. Heat and Mass Transfer, 50(6): 835-847. https://doi.org/10.1007/s00231-014-1292-6
[24] Kumar, V. (2019). Thermal and thermohydraulic performance analysis of three sides artificially roughened solar collectors. Solar Energy, 190: 212-227. https://doi.org/10.1016/j.solener.2019.08.018
[25] Kumar, V. (2019). Nusselt number and friction factor correlations of three sides concave dimple roughened solar air heater. Renewable Energy, 135: 355-377. https://doi.org/10.1016/j.renene.2018.12.002
[26] Biçer, A., Devecioğlu, A.G., Oruç, V., Tuncer, Z. (2020). Experimental investigation of a solar air heater with copper wool on the absorber plate. International Journal of Green Energy, 17(15): 979-989. https://doi.org/10.1080/15435075.2020.1818245
[27] Pathak, P.K., Chandra, P., Raj, G. (2024). Comparative analysis of modified and convectional dual purpose solar collector: Energy and exergy analysis. Energy Sources, Part A: Recovery, Utilization, and Environmental Effects, 46(1): 2687-2703. https://doi.org/10.1080/15567036.2019.1692974
[28] Devecioğlu, A.G., Oruç, V., Tuncer, Z. (2018). Energy and exergy analyses of a solar air heater with wire mesh-covered absorber plate. International Journal of Exergy, 26(1-2): 3-20. https://doi.org/10.1504/IJEX.2018.092500
[29] Hamdoon, O.M., Alomar, O.R., Salim, B.M. (2020). Performance analysis of hybrid photovoltaic thermal solar system in Iraq climate condition. Thermal Science and Engineering Progress, 17: 100359. https://doi.org/10.1016/j.tsep.2019.100359
[30] Bashria, A., Yousef, A., Adam, N., Sopian, K., Zaharim, A., Alghoul, M. (2007). Analysis of single and double passes V-grooves solar collector with and without porous media. International Journal of Energy and Environment, 2(1): 109-114.
[31] Singh, A.P., Kumar, A., Singh, O. (2020). Efficient design of curved solar air heater integrated with semi-down turbulators. International Journal of Thermal Sciences, 152: 106304. https://doi.org/10.1016/j.ijthermalsci.2020.106304
[32] Mahmood, A.J. (2017). Experimental study of a solar air heater with a new arrangement of transverse longitudinal baffles. Journal of Solar Energy Engineering, 139(3): 031004. https://doi.org/10.1115/1.4035756
[33] Dhiman, A., Sachdeva, G. (2021). Comparative analysis of the payback period for different types of solar energy systems used in India. In: Patnaik, A., Kozeschnik, E., Kukshal, V. (eds) Advances in Materials Processing and Manufacturing Applications. iCADMA 2020, Lecture Notes in Mechanical Engineering, Springer, Singapore. https://doi.org/10.1007/978-981-16-0909-1_53