Farhan Lafta Rashid![]() | Abbas Fadhil Khalaf
| Abbas Fadhil Khalaf![]() | Mudhar A. Al-Obaidi*
| Mudhar A. Al-Obaidi*![]() | Nayef Almetlaqem
| Nayef Almetlaqem![]() | Nashi Alajmi
| Nashi Alajmi![]() | Dhifaf Sadeq
| Dhifaf Sadeq![]() | Sara Almeer
| Sara Almeer![]()
© 2026 The authors. This article is published by IIETA and is licensed under the CC BY 4.0 license (http://creativecommons.org/licenses/by/4.0/).
OPEN ACCESS
This paper provides a numerical inquiry of fluid flow and heat transfer in a horizontal channel where the bottom is heated to maximize thermal systems such as electronic coolers and heat exchangers. The impact of the inlet velocity ranging between 0.1 and 0.7 m/s was studied using ANSYS/FLUENT simulations, where water was used as the working fluid. The findings are in quantitative form, showing that an increase in the inlet velocity improves thermal performance and facilitates more equilibrium temperature distributions. In particular, the temperature increased at an inlet velocity of 0.1 m/s by 289.5 K at point 1 and 292 K at point 4, which is close to the heat source. This amplification was found to increase further with higher velocities up to a high of 300 K at point 4 with an inlet velocity of 0.7 m/s. The results obtained make it possible to come up with efficient temperature-control systems by directly connecting flow dynamics and convective heat transfer efficiency.
fluid flow, heat transfer, horizontal channel, thermal performance
Several technical implications depend on forced and free convection cooling mechanisms [1]. The thermal performance of these systems can be defined via the proportional impact of buoyancy-induced flows and forced fluid motion, which consequently result in complex flow patterns and heat transfer characteristics, particularly in horizontal channel layouts. Kennedy and Zebib [2] introduced the basic concept of the flow interactions that inspected a single discrete heat source between horizontal parallel plates and under mixed convection conditions. This concept was further ascertained by Incropera et al. [3] who studied heat transfer of single and arrays of flush-mounted heat sources in a channel (rectangular) using water and FC-77, consequently, offering essential information about the convective cooling properties in channel flows.
Similar studies have also been done with respect to mixed convection under horizontal channels, usually with geometric tweaking to improve thermal performance [4-6]. There are examples based on the experimental studies of the thermal properties of longitudinal fins in a horizontal rectangular channel under mixed convection with the great influence of natural convection by Dogan and Sivrioglu [7, 8]. They found in their parametric research, where fin geometry and heat flux were varied, that fin spacing and height were two important factors in determining optimal performance of a heat sink. In addition, they also came up with a correlation of Nusselt number involving Reynolds number, modified Grashof number, as well as fin parameters [9]. In parallel to this experimental study, Mokhtari et al. [10] conducted a computational fluid dynamics (CFD) simulation to assess the total thermal performance of different fin designs in a rectangular duct, giving numerical confirmation of a fin-proved thermal performance.
The dynamics of interactions of surface radiation and mixed convection in horizontal channels have also been studied in detail [11]. Hidki et al. [12] numerically simulated mixed convection in the presence of surface radiation in a vented horizontal channel with three spherical sources of heat, and showed that the thermal performance of the system was optimized by an increase in Reynolds number and surface emissivity. Related computational studies include Guo et al. [13], who used Direct Numerical Simulation (DNS) to study turbulent mixed convection of liquid metal (Pr = 0.025) in a horizontal channel by systematically assessing how Richardson number (Ri = 0, 0.25, 0.50, and 1.00) influences turbulence budgets, mixing efficiency, and heat transport parametrization. Their findings revealed that turbulent kinetic energy in the viscous sublayer was rapidly dissipated, and this is a unique process to low-Prandtl-number fluids under mixed convection.
Recent studies are still improving the knowledge of flow manipulation in horizontal channels. Menni et al. [14] analytically investigated forced convection of turbulent air in a horizontal channel with the two arc-shaped baffles on the bottom wall and with a heated wall. They compared baffles directed to the channel inlet and outlet and realized that the latter were better heat transfers by approximately 14% and reached a higher bulk temperature. This is in line with a larger range of research on baffled channels [15-22], all of which investigate the effects of obstacles and baffle geometries, including porous, diamond-shaped, perforated, Z-shaped, and grooved baffles, on the solution of hydrothermal performance, entropy generation, and an increase in the convective heat transfer in channel flows.
Similar studies on cylindrical-based micro-/mini-channel heat sinks (CMHSs) to cool cylindrical sources, including the work of Zhao et al. [23] on thermal management of lithium-ion batteries and the series of numerical and experimental investigations of mini-channel oblique-finned channels by the previous studies [24-28], also offer some insight into channel-based cooling through a different geometry. Through these studies, the channel number, channel inlet size, flow rate, direction of flow, and secondary flow channels were studied, and their impact on thermal performance and temperature uniformity was studied.
There is also the study of magnetohydrodynamic (MHD) flows, entropy generation, and special configurations, which provide useful insights into coupled transport. As an example, Nazeer et al. [29] examined the entropy generation in an electro-osmotic flow of blood including nanoparticles in an asymmetric channel, and Rashid et al. [30] and Hussain et al. [31] examined the entropy generation in Ag- and Au-H2O nanofluids over an exponential sheet. Akbar et al. [32] examined the entropy generation in MHD flow using a ciliated tube. These studies may be characterized by various physical contexts; however, they are adding to the general knowledge of convective transport and irreversibilities of fluid systems.
Returning to the case of horizontal channels containing heating elements, Wong and Saeid [33] numerically examined the cooled mixed convection at impingement of air jets over a bottom-mounted heater, finding the insignificant influence of porosity and inertial coefficient in the Darcy regime. Experimental and numerical investigations of mixed convection in fluid-superposed porous layers that were heated at the bottom of the layer by Dixon and Kulacki [34, 35] gave correlations of Nusselt number in terms of bed thickness, Rayleigh-Darcy number, and Péclet number, finding a critical Péclet number to a minimum Nusselt number in the onset of mixed convection. A numerical study by Ozgen and Yasin [36] on the impact of the location of the heat source in the horizontal porous channel determined that the greater the buoyancy, the greater the complexity of the secondary cells formed, which contributed greatly to the heat removal. Most recently, Gibanov et al. [37] performed a three-dimensional conjugate analysis of mixed convection in a horizontal channel with heat-conducting ribs and a periodic heat source and found that small ribs (h = 0.1 H–0.2 H) cannot effectively cool the energy element.
Even further, the example of Ismail et al. [38] on the CFD optimization of classifier blades in coal pulverizers, although of an industrial nature, exemplifies how numerical simulation can be used to make the system more efficient, a methodological approach that can be considered parallel to the present study.
Based on this comprehensive and specialized literature, the current study seeks to add to the existing body of numerical studies a dedicated numerical study of the mixed convection in a simple horizontal channel setup with a heated bottom wall. Particularly, the paper explores how the velocity at the inlet (0.1–0.7 m/s) varies impact variable inlet velocity on detailed temperature distribution and heat transfer efficiency with ANSYS/FLUENT simulations. The current research delivers a critical understanding of velocity-sensitive convective performance in a simple geometry layout by the development of point-wise thermal and fluid dynamic data considering a velocity interval. In turn, this would offer essential information on the design of the optimised thermal management systems.
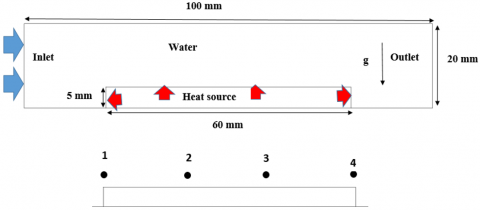
Figure 1 demonstrates a representation of the geometry of the device utilised in the present research, signifying the layout of the horizontal channel and locations of the tested points. Figure 1 comprises the heated source positioned at the bottom of the channel, which endorses an energetic role in impacting the fluid flow and heat transfer features. The recognized tested points are deliberately located to permit for inclusive data collection on temperature and velocity distributions via the channel, which facilitates a systematic analysis of the thermal performance under various inlet velocities. This introductory perception of the device's layout is critical to deduce the consequent findings and thoughts demonstrated in the current research.
Figure 1. A schematic diagram of the device’s geometry and tested points
2.1 Governing equations
The research depends on fundamental equations to model both fluid movements and thermal transfer operations in the channel. The continuity equation presented in Eq. (1) demonstrates mass conservation through its statement about the time derivative of density and the divergence product of density with velocity, which evaluates to zero. The momentum equation presented in Eq. (2) describes how momentum acts as a conserved quantity in this system because it includes both velocity changes from inertial forces and pressure gradients together with viscous forces and gravity body forces. The energy equation presented in Eq. (3) details fluid energy conservation through its examination of fluid thermal energy by specific enthalpy and heat conduction properties from thermal conductivity. These equations create a complete analytical system to analyse fluid and heat behavior changes in the channel [39-43].
$\partial \rho / \partial t+\nabla(\rho . V)=0$ (1)
$\partial(\rho v) \partial \mathrm{t}+\nabla(\rho . V)=-\nabla P+\mu . \nabla 2 V+\rho . g+S$ (2)
$\partial / \partial t(\rho . H)+\nabla(\rho . V . H)=\nabla .(K . \nabla T)$ (3)
2.2 Materials
Table 1 provides the thermophysical characteristics of the working fluid used in this research, namely water. Among the properties enumerated are viscosity, density, specific heat, and thermal conductivity. These are important for modelling the fluid dynamics and the thermal couplings incorporated in the numerical simulations performed within the ANSYS/FLUENT environment [44].
Table 1. Thermo-physical properties of water at 289.5 K
|
Properties |
Water |
|
Viscosity (kg/m s) |
0.001003 |
|
Density (kg/m3) |
998.2 |
|
Thermal conductivity (W/m k) |
0.6 |
|
specific heat (J/kg k) |
4182 |
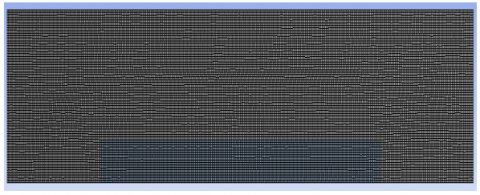
Figure 2 illustrates the configuration of the mesh model utilised in the numerical simulations conducted in this research. CFD relies heavily on the mesh because it segments the computational domain into discrete parts to perform mathematical calculations of fluid flow and heat transfer conditions. The illustration shows the grid design that details the precise mesh organization and spacing intended for the exact representation of fluid-heated surface behavior. The mesh structure needs to be properly designed because it determines the accuracy of results while ensuring grid independence and numerical solution convergence in ANSYS/FLUENT.
Figure 2. Configuration of the mesh model
2.3 Grid independence and validation tests
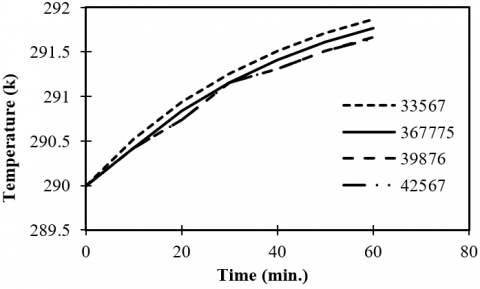
The simulation results under an inlet velocity of 0.1 m/s at point 1 are demonstrated in Figure 3. The results of CFD simulations depend significantly on mesh size, and therefore, this test plays a vital role in such analyses. The research compares mesh configuration outcomes to select stable and consistent results, which would ensure that upcoming simulations remain unaffected by mesh resolution choices. The simulation results will be dependable for further analyses because the chosen mesh configuration exhibited a successful grid independence test, which specifically demonstrated accurate flow and thermal characteristics without introducing numerical errors.
Figure 3. Grid independency test for V1 = 0.1, V2 = 0.1 m/s at point 1
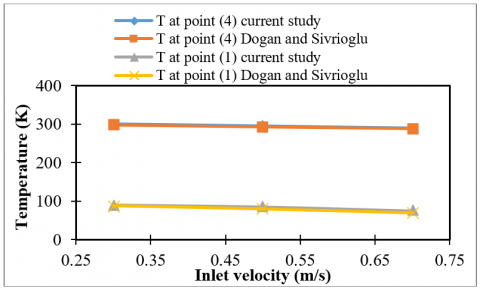
The comparison of temperature results in Figure 4 matches well the numerical results of Dogan and Sivrioglu [7] at different inlet speed levels. Specifically, Figure 4 shows the temperature data points at positions 1 and 4, which represent the current work and Dogan and Sivrioglu [7]. The numerical and experimental data establish that an increase in the inlet velocity can cause a reduction in the temperature, which depicts dissimilar patterns.
Figure 4. Contrast of simulation and experimental results of Dogan and Sivrioglu [7]
3.1 Case one (inlet velocity = 0.1 m/s)
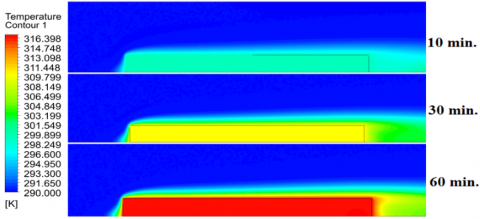
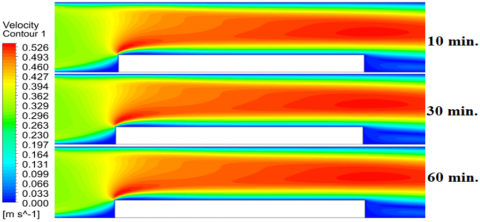
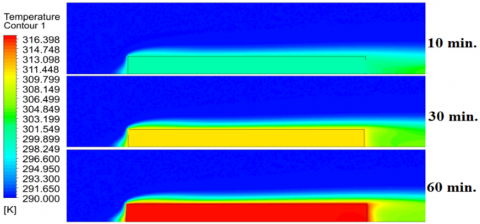
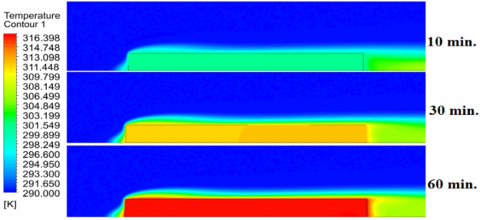
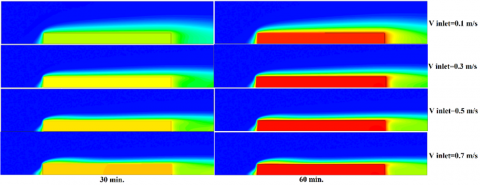
Figure 5 shows the patterns of temperature distribution for 0.1 m/s of inlet velocity across different time intervals, introducing how the thermal profile can evolve within the channel over operational time. These patterns specify a slow and gradual growth in temperature that ranges between 289.5 K and 292 K as the fluid moves along the channel. Initially, the temperature distribution is comparatively identical; localized heating happens near the heated bottom surface as time progresses, causing greater temperatures in those areas.
Figure 5. Temperature distribution patterns for 0.1 m/s OF inlet velocity against operational time
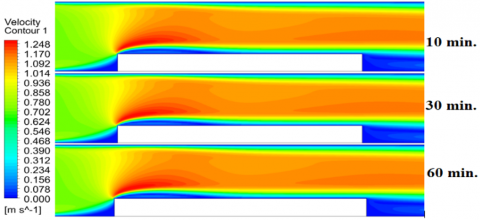
Figure 6 depicts the velocity distribution patterns for 0.1 m/s of inlet velocity across operational time, representing how the flow features can progress within the channel. Indeed, the velocity patterns are somewhat unchanging at the initial time, with velocities not far from 0.1 m/s of inlet velocity. However, the velocity patterns specify the growth of a velocity gradient as time increases, predominantly close to the heated surface, where the fluid experiences an acceleration as a result of thermal expansion and buoyancy impacts. The optimum velocities can be detected in the contours, which propose a minor growth beyond the inlet velocity, demonstrating the effect of heat transfer on fluid motion.
Figure 6. Velocity distribution patterns for 0.1 m/s of inlet velocity against operational time
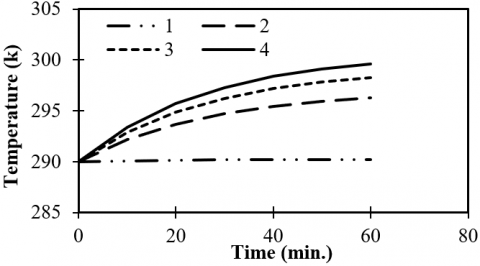
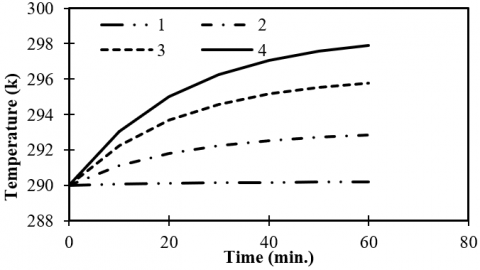
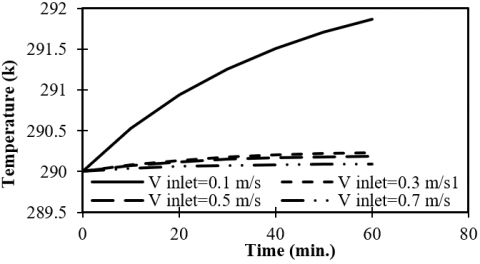
Figure 7 exhibits the temperature distribution at precise points (1, 2, 3, and 4) along the channel for 0.1 m/s of inlet velocity, which can highlight the thermal inclines experienced by the fluid at these positions. The temperature varies between 289.5 K at point 1, which is quite close to the inlet, and 292 K at point 4, positioned closer to the heated surface. The temperature growth along the flow direction specifies an active heat transfer from the heated surface to the fluid, with point 4 being subjected to the maximum temperature as a result of its nearness to the heat source.
Figure 7. Temperature distribution at different points (1, 2, 3, 4) for inlet velocity = 0.1 m/s
3.2 Case two (velocity inlet = 0.3 m/s)
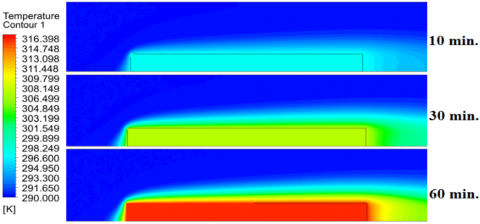
Figure 8 specifies the temperature distribution patterns for 0.3 m/s of inlet velocity against operational time. This indicates how the thermal profile progresses as the fluid flows through the channel. A more marked thermal incline can be stated in a comparison to the lesser inlet velocity of 0.1 m/s, with a range of temperature between 290 K at the inlet to 295 K close to the heated surface. The temperature patterns also indicate that the fluid quickly absorbs heat with the increase of operational time, causing greater temperatures, mostly at the bottom surface where the heat is employed. The progress of inlet velocity can consequently improve the convective heat transfer, ensuing a more effective temperature growth within the fluid.
Figure 8. Contours of temperature distribution for inlet velocity = 0.3 m/s at different times
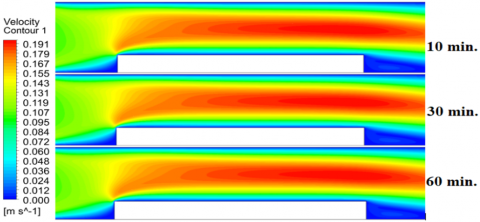
The velocity distribution for an inlet velocity of 0.3 m/s appears in Figure 9, which shows different time stages of flow behavior inside the channel. At this 0.3 m/s inlet velocity distribution, the flow obtained a better-shaped pattern and maintained velocities near 0.3 m/s until the flow development. The velocity contours display the emerging velocity gradient next to the heated surface because fluid atoms gain speed from thermal activity. The observed maximum velocities in the contours reveal moderate velocity rises above the inlet velocity, which demonstrates that heat transfer can enhance the fluid motion.
Figure 9. Contours of velocity distribution for inlet velocity = 0.3 m/s at different times
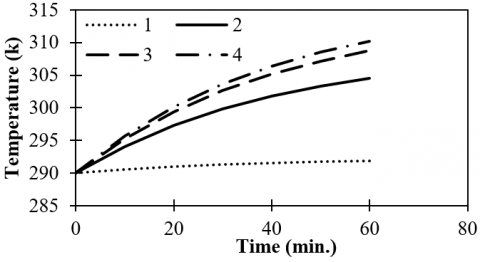
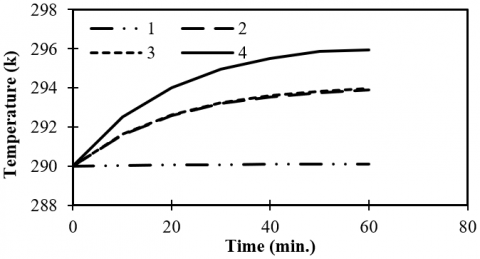
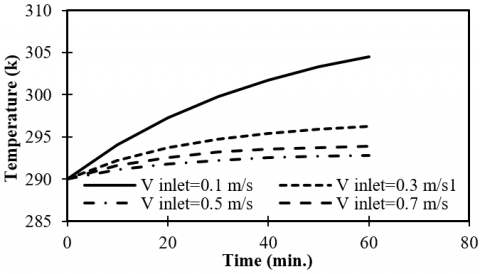
Figure 10 shows the temperature distribution at four specific points (1, 2, 3, 4), which reveals the fluid thermal behavior during its channel flow when the inlet velocity reaches 0.3 m/s. The thermal measurement points show increasing temperature values from 290 K near point 1, adjacent to the inlet, up to 295 K near point 4 next to the heated surface. The temperature increases from point 1 to point 4 because the hot fluid undergoes efficient heat exchange with the heated surface, resulting in point 4, while having the maximum temperature since it lies nearest to the heat source.
Figure 10. Temperature distribution at different points (1, 2, 3, 4) for inlet velocity = 0.3 m/s
3.3 Case three (inlet velocity = 0.5 m/s)
An inlet velocity of 0.5 m/s produces temperature distribution contour graphs that reveal fluid thermal changes during the simulation period, as shown in Figure 11. The contours depict significant temperature elevation since the intake (point 1) measures 292 K, and then the temperature rises to 298 K at point 4, which stands nearest to the heat source. The improved heat transfer capabilities at high inlet velocities lead to better mixing conditions and therefore increase the temperature values throughout the fluid domain. The temperature distribution becomes more consistent during progressive time samples because the fluid successfully takes in heat better than at lower velocity rates.
Figure 11. Contours of temperature distribution for inlet velocity = 0.5 m/s at different times
The velocity distribution inside the channel displays its contours using Figure 12 for different time points while representing the channel flow behavior. A fluid moves along its streamlines through an area where velocity stays approximately near the incoming flow rate at 0.5 m/s, but shows slight velocity changes along the length. The velocity distribution develops an amplified velocity gradient distribution, which becomes most noticeable near the heated surface after time has passed because fluid speed increases through thermal effects. The maximum velocities observed in the contours reach 0.55 m/s, which indicates an improved convective heat transfer while flowing through the domain.
Figure 12. Contours of velocity distribution for inlet velocity = 0.5 m/s at different times
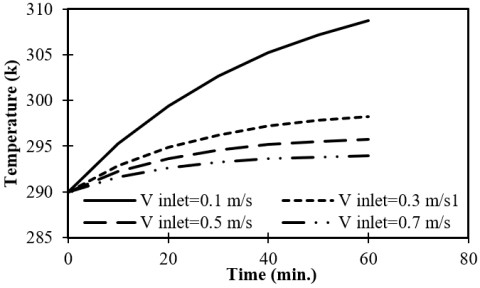
Figure 13 displays the recorded temperature readings at points 1, 2, 3, and 4 for testing with an inlet velocity of 0.5 m/s to depict how the fluid heats up as it moves through the channel. Point 1 in the channel measures 290 K, whereas point 4 near the heated surface shows 298 K temperature value. The data reveal that the inlet temperature rises by approximately 8 K toward the heated surface, showing an effective heat transfer because of the elevated inlet velocity. The experimental results imply that elevated flow rates can lead to improved convective heat exchange, which enables fluid heat absorption at a higher level compared to moderate velocities.
Figure 13. Temperature distribution at points (1, 2, 3, 4) for inlet velocity = 0.5 m/s
3.4 Case four (inlet velocity = 0.7 m/s)
The temperature distribution contours presented in Figure 14 depict the thermal behavior of fluid interacting with the heated surface under different time intervals for an inlet velocity of 0.7 m/s. Temperature measurements show important thermal elevation when inlet flow reaches 0.7 m/s, since point 1 maintains 292 K while point 4 reaches just under 300 K adjacent to the heating element. The increased heat transfer efficiency from higher velocity indicates that the fluid in the flow path measures 8 K enhancement. Over time, the temperature distribution becomes smoother, which indicates that the fluid establishes a steady thermal condition rapidly.
Figure 14. Patterns of temperature distribution for 0.7 m/s of inlet velocity against operational time
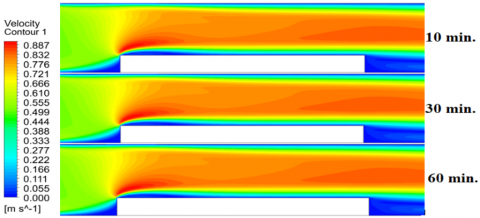
Figure 15 shows how velocity distributions transform over time within the channel when using an inlet velocity of 0.7 m/s. The fluid near the inlet moves at a speed of 0.7 m/s, mainly before it starts showing velocity variations because of thermal effects and fluid contact at downstream positions. The fluid shows minor acceleration as its movement speeds up to approximately 0.75 m/s while approaching the heated surface. More effective heat exchange occurs between the fluid and surface because of the velocity boost that affects convective thermal transfer.
Figure 15. Patterns of velocity distribution for 0.7 m/s of inlet velocity against operational time
The thermal profile of the flowing fluid emerges through Figure 16, which shows the temperature distribution at points 1, 2, 3, and 4 when the inlet velocity hits 0.5 m/s. The measurement points demonstrate a steady temperature growth from point 1 at 290 K until point 4 reaches 298 K. The flow path temperature rises to about 8 K because the fluid successfully transfers heat to the heated surface. The data suggest that the moderate inlet velocity facilitates sufficient thermal exchange, allowing the fluid to absorb heat effectively while maintaining a relatively stable temperature gradient.
Figure 16. Temperature distribution at points (1, 2, 3, 4) for inlet velocity = 0.5 m/s
3.5 Compression of all cases
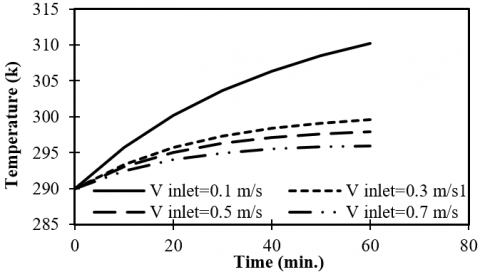
Using 0.1 m/s, 0.3 m/s, 0.5 m/s, and 0.7 m/s of inlet velocities, Figure 17 contrasts the temperature distribution across the tested cases, which illustrates the impact of flow velocity on thermal performance. The outcomes indicate a strong tendency for temperature increase as a consequence of an increase in the inlet velocity. For example, at point 1, the temperatures are 285 K for 0.1 m/s, 290 K for 0.3 m/s, 295 K for 0.5 m/s, and 300 K for 0.7 m/s. This assures a growth of 15 K from the lowermost to the uppermost velocity case. Correspondingly, the temperatures range between 290 K at 0.1 m/s to 298 K at 0.7 m/s at point 4, representing a growth of 8 K.
Figure 17. Comparison of temperature distribution for all the studied cases
Figure 18 illustrates the comparison of velocity distribution for all cases with variable inlet velocities of 0.1 m/s, 0.3 m/s, 0.5 m/s, and 0.7 m/s, highlighting how flow velocity affects the overall fluid dynamics within the system. The outcomes indicate that as the inlet velocity increases, the maximum velocity within the flow also rises significantly. For instance, at an inlet velocity of 0.1 m/s, the maximum velocity observed is approximately 0.12 m/s, while at 0.3 m/s, it increases to about 0.35 m/s. At 0.5 m/s, the maximum velocity reaches around 0.55 m/s, and at 0.7 m/s, it peaks at approximately 0.75 m/s.
Figure 18. Comparison of velocity distribution for all the studied cases
Figure 19 presents a comparison of the temperature distribution at point 1 for all cases with variable inlet velocities (0.1 m/s, 0.3 m/s, 0.5 m/s, and 0.7 m/s). The data reveal a clear trend of increasing temperature with higher inlet velocities. Specifically, at an inlet velocity of 0.1 m/s, the temperature at point 1 is 285 K. As the inlet velocity increases to 0.3 m/s, the temperature rises to 290 K. Further increases in velocity to 0.5 m/s and 0.7 m/s result in temperatures of 295 K and 300 K, respectively. This indicates a total temperature increase of 15 K from the lowest to the highest velocity case at point 1.
Figure 19. Comparison of temperature distribution for all cases in point (1)
Figure 20 compares the temperature distribution at point 2 for various inlet velocities (0.1 m/s, 0.3 m/s, 0.5 m/s, and 0.7 m/s). The results show that temperature numbers continue to rise as the inlet velocity increases. When the inlet moves to 0.1 m/s, the measurement point 2 records a temperature of 290 K. As the inlet velocity increases to 0.3 m/s, the temperature at point 2 measures 295 K. The hot air temperature measures 300 K when the draw speed rises to 0.5 m/s and reaches 305 K at 0.7 m/s. The velocity variations between cases 1 and 4 at point 2 led to a complete temperature ascent of 15 K.
Figure 20. Comparison of temperature distribution for all cases in point (2)
The results in Figure 21 display how temperature values measured at point 3 change according to variations of inlet velocity from 0.1 m/s to 0.3 m/s to 0.5 m/s and 0.7 m/s. The experimental results between different inlet velocities show corresponding temperature elevations throughout the system. Operation of the system at 0.1 m/s inlet velocity results in point 3 measuring 290 K. When the inlet velocity reaches 0.3 m/s, the system experiences 295 K temperature elevation. Point 4 temperature measurement indicates 305 K after raising the velocity to 0.7 m/s. Experimental results highlight the large temperature increase from 15 K that occurred at point 3 when comparing its low and high flow velocity settings. Point 4 temperature distribution comparison reveals how different inlet velocities (0.1 m/s, 0.3 m/s, 0.5 m/s, and 0.7 m/s) can affect the system in Figure 22. A distinct pattern shows that an increase in inlet velocity can result in elevated temperatures according to the experimental data. A 0.1 m/s inlet velocity produces 290 K thermal reading at point 4. A rise in inlet velocity to 0.3 m/s produces a point 3 temperature measurement of 295 K. The sensor at point 4 registers temperature readings of 298 K when the inlet velocity is at 0.5 m/s and reaches 300 K during conditions of 0.7 m/s. An elevated flow velocity leads to a 10 K rise in point 4 temperature, thus demonstrating superior heat-handling capabilities.
Figure 21. Comparison of temperature distribution for all cases in point (3)
Figure 22. Comparison of temperature distribution for all cases in point (4)
This paper analytically explored how the inlet velocity (0.1 -0.7 m/s) influenced heat transfer and fluid movement in a horizontal channel with a warm bottom lining. The most significant conclusions, which are obtained based on ANSYS/FLUENT simulations, are as follows:
These findings indicate that the inlet flow rate modulation is a suitable technique in managing thermal performance and the realization of the target temperature distributions in other similar channel-based thermal management systems. Although this experiment aimed at studying water in a laminar regime, it is recommended that future research ought to examine the impact of turbulence and other working fluids, including nanofluids, to continually maximize thermal performance.
|
ANSYS/FLUENT |
software used for numerical simulations |
|
CFD |
computational fluid dynamics |
|
g |
gravitational acceleration, m/s² |
|
Gr |
Grashof number, (-) |
|
H |
specific enthalpy, J/kg |
|
k |
thermal conductivity, W/m K |
|
K |
Kelvin (unit of temperature) |
|
Nu |
Nusselt number, (-) |
|
Re |
Reynolds number (-) |
|
P |
pressure, Pa |
|
Pr |
Prandtl number |
|
Ri |
Richardson number, (-) |
|
S |
source term in the momentum equation, (-) |
|
t |
time, s |
|
T |
temperature, K |
|
V |
velocity vector, m/s |
|
Greek symbols |
|
|
ρ |
density of the fluid, kg/m³ |
|
μ |
dynamic viscosity of the fluid, kg/m s |
|
∇ |
gradient operator (-) |
[1] Al-Obaidi, M.A., Rashid, F.L., Rasheed, M.K., Aljibori, H.S.S., Mohammed, H.I., Mahdi, A.J., Ahmad, S., Al-Farhany, K., Mujtaba, I.M. (2024). Recent achievements in heat transfer enhancement with hybrid nanofluid in heat exchangers: A comprehensive review. International Journal of Thermophysics, 45(9): 133. https://doi.org/10.1007/s10765-024-03428-x
[2] Kennedy, K.J., Zebib, A. (1983). Combined free and forced convection between horizontal parallel planes: Some case studies. International Journal of Heat and Mass Transfer, 26(3): 471-474. https://doi.org/10.1016/0017-9310(83)90052-2
[3] Incropera, F.P., Kerby, J.S., Moffatt, D.F., Ramadhyani, S. (1986). Convection heat transfer from discrete heat sources in a rectangular channel. International Journal of Heat and Mass Transfer, 29(7): 1051-1058. https://doi.org/10.1016/0017-9310(86)90204-8
[4] Peterson, G.P., Ortega, A. (1990). Thermal control of electronic equipment and devices. Advances in Heat Transfer, 20: 181-314. https://doi.org/10.1016/S0065-2717(08)70028-5
[5] Heindel, T.J., Ramadhyani, S., Incropera, F.P. (1995). Conjugate natural convection from an array of discrete heat sources: Part 1—two-and three-dimensional model validation. International Journal of Heat and Fluid Flow, 16(6): 501-510. https://doi.org/10.1016/0142-727X(95)00058-X
[6] Choi, M., Cho, K. (2001). Effect of the aspect ratio of rectangular channels on the heat transfer and hydrodynamics of paraffin slurry flow. International Journal of Heat and Mass Transfer, 44(1): 55-61. https://doi.org/10.1016/S0017-9310(00)00095-8
[7] Dogan, M., Sivrioglu, M. (2009). Experimental investigation of mixed convection heat transfer from longitudinal fins in a horizontal rectangular channel: In natural convection dominated flow regimes. Energy Conversion and Management, 50(10): 2513-2521. https://doi.org/10.1016/j.enconman.2009.05.027
[8] Dogan, M., Sivrioglu, M. (2010). Experimental investigation of mixed convection heat transfer from longitudinal fins in a horizontal rectangular channel. International Journal of Heat and Mass Transfer, 53(9-10): 2149-2158. https://doi.org/10.1016/j.ijheatmasstransfer.2009.12.031
[9] Dogan, M., Sivrioglu, M. (2012). Experimental and numerical investigation of clearance gap effects on laminar mixed convection heat transfer from fin array in a horizontal channel-A conjugate analysis. Applied Thermal Engineering, 40: 102-113. https://doi.org/10.1016/j.applthermaleng.2012.02.003
[10] Mokhtari, M., Gerdroodbary, M.B., Yeganeh, R., Fallah, K. (2017). Numerical study of mixed convection heat transfer of various fin arrangements in a horizontal channel. Engineering Science and Technology, an International Journal, 20(3): 1106-1114. https://doi.org/10.1016/j.jestch.2016.12.007
[11] Kobus, C.J., Oshio, T. (2005). Predicting the thermal performance characteristics of staggered vertical pin fin array heat sinks under combined mode radiation and mixed convection with impinging flow. International Journal of Heat and Mass Transfer, 48(13): 2684-2696. https://doi.org/10.1016/j.ijheatmasstransfer.2005.01.016
[12] Hidki, R., El Moutaouakil, L., Boukendil, M., Charqui, Z., Jamal, B. (2024). Analysis of mixed convection and surface radiation in a horizontal channel containing different finned heat-generating blocks. Thermal Science and Engineering Progress, 48: 102370. https://doi.org/10.1016/j.tsep.2023.102370
[13] Guo, W., Zhao, H., Guo, Z., Niu, F., Liu, F. (2024). Turbulence budgets and statistics analysis of mixed convection liquid metal flow in horizontal channel using DNS. Annals of Nuclear Energy, 199: 110352. https://doi.org/10.1016/j.anucene.2024.110352
[14] Menni, Y., Ameur, H., Yao, S.W., Amraoui, M.A., Lorenzini, G., Ahmad, H. (2021). Computational fluid dynamic simulations and heat transfer characteristic comparisons of various arc-baffled channels. Open Physics, 19(1): 51-60. https://doi.org/10.1515/phys-2021-0005
[15] Ko, K.H., Anand, N.K. (2003). Use of porous baffles to enhance heat transfer in a rectangular channel. International Journal of Heat and Mass Transfer, 46(22): 4191-4199. https://doi.org/10.1016/S0017-9310(03)00251-5
[16] Sripattanapipat, S., Promvonge, P. (2009). Numerical analysis of laminar heat transfer in a channel with diamond-shaped baffles. International Communications in Heat and Mass Transfer, 36(1): 32-38. https://doi.org/10.1016/j.icheatmasstransfer.2008.09.008
[17] Karwa, R., Maheshwari, B.K. (2009). Heat transfer and friction in an asymmetrically heated rectangular duct with half and fully perforated baffles at different pitches. International Communications in Heat and Mass Transfer, 36(3): 264-268. https://doi.org/10.1016/j.icheatmasstransfer.2008.11.005
[18] Sriromreun, P., Thianpong, C., Promvonge, P. (2012). Experimental and numerical study on heat transfer enhancement in a channel with Z-shaped baffles. International Communications in Heat and Mass Transfer, 39(7): 945-952. https://doi.org/10.1016/j.icheatmasstransfer.2012.05.016
[19] Sahel, D., Ameur, H., Benzeguir, R., Kamla, Y. (2016). Enhancement of heat transfer in a rectangular channel with perforated baffles. Applied Thermal Engineering, 101: 156-164. https://doi.org/10.1016/j.applthermaleng.2016.02.136
[20] Boruah, M.P., Randive, P.R., Pati, S. (2018). Hydrothermal performance and entropy generation analysis for mixed convective flows over a backward facing step channel with baffle. International Journal of Heat and Mass Transfer, 125: 525-542. https://doi.org/10.1016/j.ijheatmasstransfer.2018.04.094
[21] Chokphoemphun, S., Hongkong, S., Thongdaeng, S., Chokphoemphun, S. (2020). Experimental study and neural networks prediction on thermal performance assessment of grooved channel air heater. International Journal of Heat and Mass Transfer, 163: 120397. https://doi.org/10.1016/j.ijheatmasstransfer.2020.120397
[22] Menni, Y., Azzi, A., Chamkha, A. (2019). Enhancement of convective heat transfer in smooth air channels with wall-mounted obstacles in the flow path: A review. Journal of Thermal Analysis and Calorimetry, 135(4): 1951-1976. https://doi.org/10.1007/s10973-018-7268-x
[23] Zhao, J., Rao, Z., Li, Y. (2015). Thermal performance of mini-channel liquid cooled cylinder based battery thermal management for cylindrical lithium-ion power battery. Energy Conversion and Management, 103: 157-165. https://doi.org/10.1016/j.enconman.2015.06.056
[24] Fan, Y., Lee, P.S., Jin, L.W., Chua, B.W., Mou, N.S., Jagirdar, M. (2013). A Parametric numerical Study in cylindrical oblique fin minichannel. In Proceedings of the ASME 2013 International Technical Conference and Exhibition on Packaging and Integration of Electronic and Photonic Microsystems. Volume 2: Thermal Management; Data Centers and Energy Efficient Electronic Systems. Burlingame, California, USA. https://doi.org/10.1115/IPACK2013-73162
[25] Fan, Y., Lee, P.S., Jin, L.W., Chua, B.W., Zhang, D.C. (2014). A parametric investigation of heat transfer and friction characteristics in cylindrical oblique fin minichannel heat sink. International Journal of Heat and Mass Transfer, 68: 567-584. https://doi.org/10.1016/j.ijheatmasstransfer.2013.09.027
[26] Fan, Y., Lee, P.S., Jin, L.W., Chua, B.W. (2014). Experimental investigation on heat transfer and pressure drop of a novel cylindrical oblique fin heat sink. International Journal of Thermal Sciences, 76: 1-10. https://doi.org/10.1016/j.ijthermalsci.2013.08.007
[27] Fan, Y., Lee, P.S., Jin, L.W., Chua, B.W. (2013). A simulation and experimental study of fluid flow and heat transfer on cylindrical oblique-finned heat sink. International Journal of Heat and Mass Transfer, 61: 62-72. https://doi.org/10.1016/j.ijheatmasstransfer.2013.01.075
[28] Fan, Y., Lee, P.S., Chua, B.W. (2014). Investigation on the influence of edge effect on flow and temperature uniformities in cylindrical oblique-finned minichannel array. International Journal of Heat and Mass Transfer, 70: 651-663. https://doi.org/10.1016/j.ijheatmasstransfer.2013.11.072
[29] Nazeer, M., Irfan, M., Hussain, F., Siddique, I. (2023). Entropy generation analysis in blood-gold Casson nanofluid through horizontal wavy channel with velocity and thermal slips: Applications in skin diseases. Journal of Computational Biophysics and Chemistry, 22(3): 259-272. https://doi.org/10.1142/S2737416523400021
[30] Rashid, I., Zubair, T., Asjad, M.I., Awrejcewicz, J. (2022). Entropy generation investigation of MHD Ag–and Au–H2O nanofluid above an exponential porous stretchable surface with thermal radiation and stagnation point flow. Frontiers in Energy Research, 10: 1009044. https://doi.org/10.3389/fenrg.2022.1009044
[31] Hussain, M., Mehmood, A., Usman, M. (2023). Entropy generation in viscous flow due to generalized exponential wall velocity and temperature. Physica Scripta, 98(7): 075202. https://doi.org/10.1088/1402-4896/acd730
[32] Akbar, N.S., Akhtar, S., Maraj, E.N., Anqi, A.E., Homod, R.Z. (2023). Heat transfer analysis of MHD viscous fluid in a ciliated tube with entropy generation. Mathematical Methods in the Applied Sciences, 46(10): 11495-11508. https://doi.org/10.1002/mma.7906
[33] Wong, K.C., Saeid, N.H. (2009). Numerical study of non-Darcian effects on jet impingement cooling in a horizontal porous layer in the mixed convection regime. International Communications in Heat and Mass Transfer, 36(1): 45-50. https://doi.org/10.1016/j.icheatmasstransfer.2008.09.011
[34] Dixon, J.M., Kulacki, F.A. (2017). Mixed convection in fluid superposed porous layers. Part 2: Experiments. International Journal of Heat and Mass Transfer, 109: 1301-1306. https://doi.org/10.1016/j.ijheatmasstransfer.2017.02.028
[35] Dixon, J.M., Kulacki, F.A. (2017). Mixed convection in fluid-superposed porous layers. Part 1. Analysis. International Journal of Heat and Mass Transfer, 109: 1289-1300. https://doi.org/10.1016/j.ijheatmasstransfer.2017.01.123
[36] Ozgen, F., Varol, Y. (2019). Numerical study of mixed convection in a channel filled with a porous medium. Applied Sciences, 9(2): 211. https://doi.org/10.3390/app9020211
[37] Gibanov, N., Hussain, M., Sheremet, M. (2025). Three-dimensional heat transport and fluid flow in a channel with heat-generating source and heat removal ribs. International Communications in Heat and Mass Transfer, 161: 108552. https://doi.org/10.1016/j.icheatmasstransfer.2024.108552
[38] Ismail, F.B., Al-Muhsen, N.F., Hasini, H., Kuan, E.W.S. (2022). Computational fluid dynamics (CFD) investigation on associated effect of classifier blades lengths and opening angles on coal classification efficiency in coal pulverizer. Case Studies in Chemical and Environmental Engineering, 6: 100266. https://doi.org/10.1016/j.cscee.2022.100266
[39] Rashid, F.L., Eleiwi, M.A., Tahseen, T.A., Mohammed, H.I., Tuama, S.A., Ameen, A., Agyekum, E.B. (2025). Influence of adiabatic semi-circular grooved in backward-facing step on thermal-hydraulic characteristics of nanofluid. International Journal of Thermofluids, 26: 101052. https://doi.org/10.1016/j.ijft.2024.101052
[40] Rashid, F.L., Al-Gaheeshi, A.M.R., Al-Obaidi, M.A., Mohammed, H.I., Togun, H., Agyekum, E.B. (2024). Analysing fluid flow and heat transfer comparatively in flow passage systems: Evaluating thermal impacts and geometric configurations. International Journal of Thermofluids, 24: 100894. https://doi.org/10.1016/j.ijft.2024.100894
[41] Parveen, R., Hussein, A.K., Mahapatra, T.R., Al-Thamir, M., Abidi, A., Ben Hamida, M.B., Homod, R.Z., Rashid, F.L. (2024). MHD double diffusive mixed convection and heat generation/absorption in a lid-driven inclined wavy enclosure filled with a ferrofluid. International Journal of Thermofluids, 22: 100698. https://doi.org/10.1016/j.ijft.2024.100698
[42] Rashid, F.L., Khalaf, A.F., Ameen, A., Al-Obaidi, M.A. (2024). Investigation of thermo-hydraulics in a lid-driven square cavity with a heated hemispherical obstacle at the bottom. Entropy, 26(5): 408. https://doi.org/10.3390/e26050408
[43] Al-Jibory, M.W., Rashid, F.L., Talib, S.M. (2018). Numerical investigation of heat transfer enhancement in ribbed elliptical passage. Journal of Engineering and Applied Sciences, 13(17): 7223-7234. https://doi.org/10.3923/jeasci.2018.7223.7234
[44] Rashid, F.L., Hussein, E.Q., Al-Obaidi, M.A., Hussain, A.A. (2023). Numerical simulation of a partly filled rectangular tank with fuel oil. Journal of Techniques, 5(3): 42-51. https://doi.org/10.51173/jt.v5i3.1465