Md Imam Mehedi*![]() | Ambagaha Hewage Dona Kalpani Rasangika
| Ambagaha Hewage Dona Kalpani Rasangika![]() | Yit Jing Ee
| Yit Jing Ee![]() | Kamaruzzaman Sopian
| Kamaruzzaman Sopian![]() | Rehan Khan
| Rehan Khan![]()
© 2025 The authors. This article is published by IIETA and is licensed under the CC BY 4.0 license (http://creativecommons.org/licenses/by/4.0/).
OPEN ACCESS
This study develops an advanced passive Battery Thermal Management System (BTMS) for 18,650 cylindrical lithium-ion battery by integrating phase change materials (PCMs), nanoparticle-enhanced PCMs (NePCMs), and fin structures to achieve superior thermal stability under high operating loads. Five PCMs—n-Octadecane, n-Eicosane, RT-44HC, lauric acid, and Na₂SO₄·10H₂O—were systematically evaluated using nanoparticle-specific effective medium models that capture anisotropy and geometry effects. Six nanoparticles (Al₂O₃, CuO, AlN, graphene, graphene oxide, and SWCNT) were analyzed at 1–5% volume fractions. RT-44HC exhibited the best baseline performance, maintaining peak temperatures below 52.25℃, while SWCNTs offered the most significant enhancement among nanoparticles. The optimal 4% SWCNT–RT-44HC formulation reduced maximum cell temperature by 9.46℃ (19.17%) compared to pure PCM and 62.04℃ (58.91%) compared to natural air cooling. Among four BTMS configurations—PCM, PCM-fin, NePCM, and NePCM-fin—the fin-assisted NePCM design delivered the best performance, lowering peak temperature by 10.11℃ and maintaining a temperature variation below 0.75℃. Importantly, it ensured safe operation (<45℃) under 3C–5C discharge rates and 15–35℃ ambient conditions. This work establishes a comprehensive and experimentally validated framework for NePCM-based BTMS, paving the way for safe, efficient, and high-performance thermal regulation in next-generation energy storage systems.
Battery Thermal Management System, electric vehicles, fin, lithium-ion battery, nanoparticle, passive cooling, phase change material
Fossil fuels have long dominated global energy demand, but their extensive use now contributes to severe environmental degradation, including nearly 34 billion metric tons of annual CO₂ emissions [1, 2]. The transportation sector is a major source of these emissions, prompting a global shift toward cleaner alternatives such as electric vehicles (EVs), plug-in hybrid EVs (PHEVs), and hybrid EVs (HEVs), which can reduce carbon output by 50–70% compared with gasoline vehicles and lower ozone-depleting pollutants by up to 40% [3, 4]. As a result, EV adoption is accelerating worldwide, with 6.6 million units sold in 2021 and policy targets such as the European Union’s plan to phase out fuel-powered vehicle sales by 2035 [5]. Lithium-ion batteries (LIBs) underpin this transition due to their high energy density, long cycle life, fast charging capability, and cost-effectiveness [6, 7], and cylindrical cells are widely used for their mechanical stability and ease of manufacturing [8]. However, LIB performance and safety are highly sensitive to temperature [9], as heat generated during charging and discharging from electrochemical reactions and internal resistance can accelerate degradation and reduce efficiency. Elevated temperatures further increase the risks of capacity fading, self-discharge, shortened cycle life, or catastrophic thermal runaway events. Studies report severe performance losses when cells operate or are stored above 50–60℃, reinforcing the need to maintain LIBs within the recommended range of 20–45℃ and limit module-level temperature differences to below 5℃ for stable operation [10, 11]. Although LIBs are generally assumed to tolerate a maximum operating temperature of 60℃ as a chemical and thermal safety threshold [12], exceeding this limit significantly impairs performance and may trigger thermal runaway [13, 14]. These challenges highlight the critical need for effective thermal management systems to ensure safe, reliable, and uniform battery operation in electric mobility.
Battery Thermal Management Systems (BTMSs) are mainly of three types: active, passive, and hybrid systems. Although active systems are highly effective in maintaining optimal battery temperatures, passive thermal management approaches have gained increasing attention due to their structural simplicity and independence from external power sources. Among various passive methods, PCMs are currently widely studied for their potential in thermal management. PCMs offer several advantages, including high thermal storage capacity, low cost, and the ability to keep battery temperatures close to the material's phase transition point by absorbing a considerable amount of heat during their melting phase [15-17].
PCMs can be broadly categorized into liquid–gas, solid–gas, solid–liquid, and solid–solid types. Among the available types, solid–liquid PCMs are the most practical due to their high latent heat and small volume change, and they are generally grouped into organic, inorganic, and eutectic categories [18]. Paraffin-based organic PCMs such as n-eicosane [19], n-octadecane [20], and RT-44HC [19] are widely applied because their melting temperatures fall within the safe operating range of LIBs and they offer good thermal stability. In addition to paraffins, non-paraffin organic PCMs, particularly fatty acids, have gained increasing attention. Cai et al. [21] developed a lauric-acid-based composite PCM with expanded graphite and SEPS that increased thermal conductivity by 4.97 times and improved leakage resistance. In 2C–4C discharge tests, it kept the battery temperature below 50℃ with less than 1℃ variation. However, organic PCMs remain flammable and present fire safety risks. Inorganic PCMs, particularly hydrated salts, are non-flammable and provide high latent heat with suitable phase change temperatures, but their use in BTMS remains limited and requires further investigation [22].
PCMs offer high thermal storage capacity but limited thermal conductivity, which can be improved using thermal conductivity enhancement techniques (TCEs) such as fins, metal foams, expanded graphite, and nanoparticles. Incorporating nanoparticles into PCMs enhances heat transfer, improves thermal conductivity, ensures uniform temperature distribution, and accelerates phase transitions while delaying complete melting [23, 24]. Nanoparticles are typically classified as metal or metal oxide and carbon-based types. Metal oxides, including CuO and Al₂O₃ [25-27], provide high thermal conductivity and are widely studied. Carbon-based nanoparticles, though less explored in BTMS, include carbon nanotubes (CNTs), carbon fibers, graphene nanoplatelets (GNP), graphene oxide (GO), and graphene (GR), offering extremely high thermal conductivity, large surface areas, and efficient heat transfer, with CNTs reaching 3000–6600 W/(m·K) and carbon/graphite fibers 1000–3000 W/(m·K) [28, 29]. Expanded graphite further enhances thermal conductivity and prevents leakage, with performance influenced by weight fraction, thickness, and bulk density. Determining the thermophysical properties of nanoparticles in PCMs remains challenging, as particle shape, aspect ratio, and anisotropy strongly affect effective thermal conductivity, specific heat, and energy storage. Most numerical studies rely on generalized effective medium models, often applying a single model across all nanoparticle types, ignoring geometric and anisotropic effects. For instance, Shivram and Harish [30] used the same model for carbon and metal-based nanoparticles, while Ren et al. [31] examined carbon-based nanoparticles alignment effects but did not utilize geometry-specific models. Such simplifications limit prediction accuracy, highlighting the critical need for nanoparticle-specific modeling to realistically capture NePCM thermophysical behavior in BTMS.
In terms of fin-PCMs, they are more effective in passive BTMS than other methods due to their superior heat transfer capabilities, uniform thermal distribution, and faster phase change processes. Fins act as thermal bridges, significantly enhancing the low TC of PCMs by using larger surface areas for heat dissipation, resulting in quicker melting and solidification cycles [32-34]. Unlike nanoparticles, metal foams, or expanded graphite, which primarily improve localized conductivity, fins ensure even heat distribution across the entire battery pack, preventing hotspots and maintaining temperature uniformity. Research by Mousavi et al. [35] demonstrated that in vertical cylindrical thermal energy storage systems, fins reduce melting time more effectively than nanoparticles. Using fins together with nanoparticles provided the best thermal performance.
Despite significant progress in BTMS, critical gaps remain. Most studies focus on a single PCM type, limiting systematic optimization. Few studies have explored the integration of carbon and graphene-based nanoparticles with fins. Accurate determination of NePCM thermophysical properties, a key factor for reliable thermal modeling, has been largely neglected. Existing work often applies a single effective medium model, typically the Maxwell model, to all nanoparticle types, failing to capture the behavior of highly anisotropic structures such as CNTs and graphene. Ignoring nanoparticle shape, type, and interfacial effects can lead to oversimplified and unreliable predictions of thermal conductivity. A comprehensive categorization and comparative evaluation of both PCMs and nanoparticles, using nanoparticle-specific models with fin-assisted enhancement of BTMS under high ambient and operating conditions, has not been previously investigated by researchers.
To address these gaps, this study conducts a comprehensive evaluation of five PCMs across three categories: organic paraffin-based PCMs (n-Octadecane, n-Eicosane, RT-44HC), a non-paraffin organic PCM (lauric acid), and an inorganic salt hydrate PCM (Na₂SO₄·10H₂O), applied to cylindrical lithium-ion batteries under elevated ambient temperatures to identify the most effective PCM for high-performance thermal management. Six nanoparticles are investigated across three classes: metal oxides (Al₂O₃, CuO), nitride (AlN), and carbon-based nanomaterials (graphene, graphene oxide, SWCNTs), considering nanoparticle type, shape, interfacial effects, and volume fraction using appropriate, nanoparticle-specific models. The study determines optimal nanoparticle loadings to achieve a balance between enhanced thermal conductivity and high energy storage capacity. Furthermore, the optimized NePCM is integrated with plate fins and tested under a range of ambient temperatures (15–35℃) and heat loads (3C and 5C) to assess adaptability under varying climate and operating conditions. Performance is evaluated using key metrics, including average battery temperature, liquid fraction, melting duration, and maximum cell temperature gradient, providing actionable insights for designing high-performance, thermally stable BTMS.
2.1 Physical model description
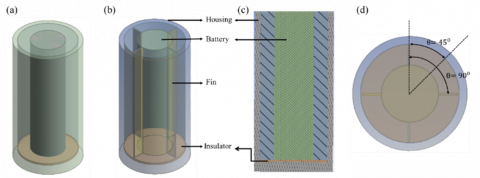
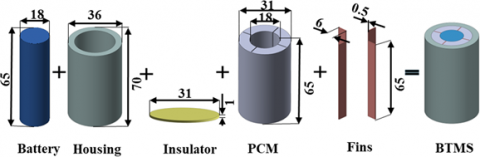
In this present study, there were two different BTMS geometry models considered: One is BTMS without a fin in Figure 1(a), and the other is BTMS with four plate fins in Figure 1(b). These BTMSs were geometrically similar to the designs studied by Wang et al. [36] in their experimental work on heat regulation for a cylindrical 18650 LIB. The model in Figure 2 was developed following all parameters and conditions from the experimental study conducted by Wang et al. [36]. In this model, the setup included a heat-generating battery placed inside an aluminum casing, with PCM occupying the gap between them, as shown in Figures 1(b) and (c). The mock-up battery, made of aluminum, measured 18 mm in diameter and 65 mm in height. Depending on the configuration, it was equipped with or without fins and positioned vertically within an aluminum housing that had a wall thickness of 5 mm and an inner diameter of 31 mm. A 1 mm acrylic plate was placed beneath the battery to insulate it from the housing. The thermo-physical properties of the materials are provided in Table 1. For fin attachment, four rectangular slots, which were made of copper, each 1 mm wide and 5 mm in height with 780 mm3 of volume, were evenly spaced around the circumference of the mock-up battery. Table 2 presents the geometrical parameters of the fins. The total heat transfer area for four fins is 3120 mm². In the BTMS configuration with four plate fins, shown in Figure 1(b), fins are positioned at 90° intervals as shown in Figure 1(d). These straight fins were inserted into slots on the battery and aligned along its axial direction. The gap between the finned battery and the outer housing was filled with PCM. In this study, the fin volume fraction ($\phi$) was calculated by Eq. (1). The heat sink with four plate fins had a fin volume fraction of 2.4%. The equation for calculating the volume fraction of the fin is as given:
$\emptyset=\frac{V_{{fin }}}{V_{{fin }}+V_{{pcM }}}$ (1)
where, $V_{fin}$ represents the volume of fins considered in this study, and $V_{pcM}$ is the volume of PCM filled between the housing and battery.
Figure 1. BTMS layout showing (a) isometric view without fins, (b) isometric view with fins, (c) isometric section view, and (d) top view
Figure 2. Layout diagram of the BTMS with four plate-fins
Table 1. Thermophysical properties of the materials used in this study [12, 37]
|
Materials |
Density (kg/m3) |
Thermal Conductivity (W/m K) |
Specific Heat (J/kg K) |
|
Acrylic (Insulator) |
1190 |
0.21 |
1470 |
|
Aluminum (Enclosure) |
2719 |
202 |
900 |
|
Copper (Fins) |
8933 |
401 |
385 |
Table 2. Geometrical specifications of the four plate-fins used in this study
|
Fin Type |
Fins No. |
Dimension (mm) |
Volume of Fin (mm3) |
Volume of PCM (mm3) |
Heat Transfer Area of Fin (mm2) |
Fins Volume Fraction (%) |
Ratio of Heat Transfer Area ($\alpha$) |
|
Plate Fins |
4 |
0.5 × 65.0 |
780.0 |
31,720.0 |
3120.0 |
2.4 |
1.81 |
2.2 Heat generation
The heat generated in a lithium-ion battery depends on its charging or discharging rate, expressed as the C-rate, which is the ratio of operating current to the battery’s rated capacity. For example, a 2.5 Ah cell discharging at 1C delivers 2.5 A for one hour, while 2C delivers 5 A for 30 minutes. Higher C-rates produce more heat due to increased electrochemical losses and internal resistance. Although heat generation varies with state of charge, voltage, and current, many thermal studies use constant average heat generation values based on experimental data to simplify numerical analysis [12, 18, 36]. Huang et al. [38] experimentally evaluated NCM-based 18650 cells (2.6 Ah, 3.7 V) at 25℃ and reported a near-linear increase in heat generation with rising C-rate: 0.1395 W at 0.5C, 0.4699 W at 1C, 1.3226 W at 2C, 2.9158 W at 3C, and 6.4809 W at 5C. These experimentally obtained values are adopted in the present work as constant heat inputs for evaluating BTMS performance. Table 3 summarizes the constant heat generation rates used in this study for subsequent BTMS simulations.
Table 3. Constant heat generation rates for the NCM 18650 LIB [38]
|
Discharge Rate |
Total Heat Generation, Qt (W) |
Volumetric Heat Generation, Qb (W·m⁻³) |
|
5C |
6.4809 |
391,716 |
|
3C |
2.9158 |
176,200 |
2.3 PCM melting process
The phase change behavior of PCM plays a key role in BTMS performance. It absorbs excess heat through sensible and latent heat processes and helps keep the battery within a safe temperature range. During melting, the PCM contains both solid and liquid phases. This mixed zone, known as the mushy region, is commonly treated as a porous medium. Its porosity is defined by the liquid fraction ($\gamma$). To account for flow resistance and pressure loss caused by the remaining solid structure, a momentum source term $\vec{S}$ is added to the Navier–Stokes equations. This term is derived from Darcy’s law and the Carman–Kozeny relation expressed below [39]:
$\vec{S}=-\left(\frac{(1-\gamma)^2}{\gamma^3+c}\right) A_{\text {mushy }} \vec{v}$ (2)
Here, $c(\approx 0.001)$ prevents numerical instability, and $A_{\text {mushy}}$ (103–108) controls the strength of convection within the mushy zone—larger values suppress flow, while smaller ones enhance it. The liquid fraction γ in Eq. (3) represents the degree of melting in each cell and is determined by the PCM temperature relative to its solidus and liquidus limits.
$\gamma=\left\{\begin{array}{cc}0 & { if }\,\, T<T_{{solidus }} \\ \frac{T-T_{ {solidus }}}{T_{ {liquidius }}-T_{ {solidus }}} & { if }\,\, T_{ {solidus }} \leq T \leq T_{ {liquidus }} \\ 1 & { if }\,\, T>T_{{liquidius }}\end{array}\right.$ (3)
In Eq. (3), during the heat absorption process, the PCM experiences a phase transition where the liquid fraction ($\gamma$) varies between 0 (fully solid) and 1 (fully liquid). As melting progresses, the fluid velocity within the liquid PCM increases, which is directly proportional to the liquid fraction and can be expressed:
$\vec{v}=\gamma \times \mathrm{v}_{{liquid}}$ (4)
where, ${v}_{{liquid}}$ indicates the velocity vector of the molten PCM, while the overall velocity depends on the proportion of the liquid phase. The total enthalpy ($h$) of the PCM at a given time step is calculated as the sum of sensible enthalpy ($h_s$) and latent enthalpy ($h_l$), as shown below:
$h=h_s+h_l$ (5)
where,
$h_s=h_{{ref}}+\int_{T_{{ref}}}^T C_p d T$ (6)
$h_l=\gamma L$ (7)
In these equations, $C_p$ represents the specific heat capacity, $h_{{ref}}$ is the reference enthalpy at the reference temperature $T_{{ref}}$, $L$ denotes the latent heat of fusion, and $\gamma$ is the liquid fraction that governs the proportion of the melted PCM.
2.4 Nanoparticle-based PCM mathematical models
In this study, different percentages of volume fractions (φ) of nanoparticles dispersed within the base PCM to enhance thermal conductivity, with effective heat storage capacity, and overall thermal stability. The thermos-physical properties such as specific heat capacity $\left(\rho C_p\right)_{N e P C M}$, density $\rho_{N e P C M}$, and dynamic viscosity $\mu_{N e P C M}$ of NePCM can be computed as below [30, 40, 41].
Volumetric heat capacity:
$\left(\rho C_p\right)_{N e P C M}=\left(\rho C_p\right)_{P C M} \cdot(1-\phi)+\left(\rho C_p\right)_{n p} \cdot \phi$ (8)
Density:
$\rho_{N e P C M}=\rho_{P C M} \cdot(1-\phi)+\rho_{\eta p} \cdot \phi$ (9)
Dynamic viscosity for metal oxide:
$\mu_{N e P C M}=\frac{\mu_{P C M}}{(1-\phi)^{2.5}}$ (10)
Dynamic viscosity for graphene, graphene oxide, and SWCNT:
For determining the dynamic viscosity of graphene, graphene oxide, and single-walled carbon nanotubes (SWCNT) using the Krieger-Dougherty [42] approach, as shown in the equation.
$\mu_{\mathrm{NePCM}}=\mu_{\mathrm{PCM}}\left(1-\frac{\phi}{\phi_{\max }}\right)^{-A \phi_{\max }}$ (11)
This equation is chosen for the different shapes of the materials, two-dimensional (2D) for graphene oxide and one-dimensional (1D) for SWCNT. Eq. (11) introduces shape-dependent parameters such as maximum packing fraction $\phi_{\max }$ and intrinsic viscosity A. In this equation, $\mu_{\mathrm{NePCM}}$ is the effective dynamic viscosity of the nanocomposite, $\mu_{\mathrm{PCM}}$ is the viscosity of the base PCM, $\phi$ the nanoparticle volume fraction, $\phi_{\max }$ is the maximum packing fraction, and A is the intrinsic viscosity. For two-dimensional Graphene nanoplatelets, values of $\phi_{\max } = 0.382$ and A = 9.87 are used, while for one-dimensional SWCNT, $\phi_{\max } = 0.268$ and A = 9.25 are adopted [28, 42].
Other important thermophysical parameters, such as the thermal expansion coefficient, latent heat of fusion, and thermal conductivity, are determined using the following expressions [30, 40, 41].
Thermal expansion coefficient:
$(\rho \beta)_{N e P C M}=(\rho \beta)_{P C M} \cdot(1-\phi)+(\rho \beta)_{n p} \cdot \phi$ (12)
Latent heat of fusion:
$(\rho L)_{N e P C M}=(\rho L)_{P C M} \cdot(1-\phi)$ (13)
Thermal conductivity of metal oxide:
In terms of calculating the thermal conductivity of metal or metal oxide nanoparticle-based PCMs, the Maxwell–Garnett model is adopted in this study, as it is one of the most widely used and validated models for metal/metal oxide-based PCMs:
$k_{\mathrm{NePCM}}=\frac{k_{\mathrm{NP}}+2 k_{\mathrm{PCM}}-2 \phi\left(k_{\mathrm{PCM}}-k_{\mathrm{NP}}\right)}{k_{\mathrm{NP}}+2 k_{\mathrm{PCM}}+\phi\left(k_{\mathrm{PCM}}-k_{\mathrm{NP}}\right)}$ (14)
Thermal conductivity of graphene and graphene oxide:
The Maxwell–Garnett model in Eq. (14), primarily applicable to metal/metal oxide spherical nanoparticles in liquid matrices, is inadequate for predicting the thermal behavior of composites containing graphene or graphene oxide. These materials are two-dimensional, anisotropic, and possess high aspect ratios and intrinsic thermal conductivities. To address these limitations, this study adopts a modified model proposed by Chu et al. [43] shown in Eq. (15), which incorporates particle geometry, interfacial resistance, and concentration-dependent effects, providing improved accuracy for graphene-based NePCMs. The effective thermal conductivity of the composite is estimated using the following relation:
$\frac{k_{\mathrm{NePCM}}}{k_{\mathrm{PCM}}}=\frac{\left[\frac{2}{3} f\left(f-\frac{1}{p}\right)\right]^\alpha}{H(p)+\frac{1}{\frac{k_{\text {graphene }}}{k_{\mathrm{PCM}}}-1}}+1$ (15)
In this Eq. (15), $k_{\mathrm{NePCM}}$ is the effective thermal conductivity of the GN enhanced PCM, KPCM is the thermal conductivity of the base PCM, f is the volume fraction of GNs, p is the aspect ratio of the nanoplatelets, α is an empirical exponent that captures the nonlinearity of conductivity enhancement, and Kgraphene is the in-plane thermal conductivity of graphene. The geometric function H(p) accounts for the anisotropic nature of the filler particles and is given by:
$H(p)=\frac{\ln \left(p+\sqrt{p^2-1}\right)}{\left(\sqrt{p^2-1}\right)^3}-\frac{1}{p^2-1}$ (16)
This model is applicable for GN volume fraction up to 5% and incorporates typical GN aspect ratios ranging from 500 to 2000, with an interfacial thermal resistance on the order of $10^{-8} \mathrm{~m}^2 \cdot \mathrm{~K} / \mathrm{W}$. In Eq. (16), the nonlinearity exponent $\alpha$ is selected based on the GN concentration. For very low concentrations (0–1 vol.%), α typically lies between 0.5 and 1.0. At moderate loadings (1–5 vol.%), a range of 1.0 to 1.3 [43, 44].
Thermal conductivity of SWCNT:
To predict the effective thermal conductivity of phase change material (PCM) composites enhanced with SWCNTs, the analytical model proposed by Xue [45] is employed as shown in Eq. (17). This model is a modified version of Maxwell’s effective medium theory. Xue's model introduces a probabilistic orientation function to more accurately reflect the dispersion behavior and alignment distribution of CNTs within the host matrix [45]. As such, it provides improved predictive capability for CNT-based thermal composites. The effective thermal conductivity KNePCM of the composite is expressed as:
$k_{\mathrm{NePCM}}=k_{\mathrm{PCM}} \cdot \frac{1-\phi+\frac{4 \phi}{\pi} \sqrt{\frac{k_{\mathrm{SWCNT}}}{k_{\mathrm{PCM}}}} \tan ^{-1}\left(\frac{\pi}{4} \sqrt{\frac{k_{\mathrm{SWCNT}}}{k_{\mathrm{PCM}}}}\right)}{1-\phi+\frac{4 \phi}{\pi} \sqrt{\frac{k_{\mathrm{PCM}}}{k_{\mathrm{SWCNT}}}} \tan ^{-1}\left(\frac{\pi}{4} \sqrt{\frac{k_{\mathrm{SWCNT}}}{k_{\mathrm{PCM}}}}\right)}$ (17)
where, $k_{\mathrm{NePCM}}$ is the effective thermal conductivity of the nano-enhanced PCM, $k_{\mathrm{PCM}}$ is the thermal conductivity of the base PCM, $k_{\mathrm{SWCNT}}$ is the thermal conductivity of the single-walled carbon nanotubes, and $\phi$ is the volume fraction of SWCNTs.
Some fundamental assumptions were used throughout the BTMS models [12, 18, 36, 46]:
3.1 Grid independence study
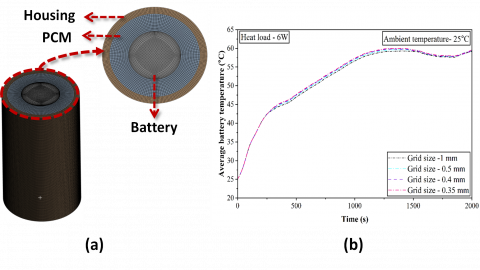
The accuracy and credibility of numerical simulations are fundamentally governed by the choice of spatial and temporal discretization; hence, a rigorous grid and time-step independence analysis was undertaken prior to executing the main computational experiments. The BTMS computational domain was discretized using four mesh sizes: 1.0 mm, 0.5 mm, 0.4 mm, and 0.35 mm, corresponding to total element counts of 262,969, 694,117, 1,180,571, and 1,463,283, respectively, with the 0.5 mm configuration illustrated in Figure 3(a). All cases were simulated in Ansys Fluent 2024R2 under a uniform heat generation rate of 6 W to determine the temporal evolution of the average battery temperature, as presented in Figure 3(b). Comparative results show that the deviation in predicted average battery temperature between the 0.5 mm, 0.4 mm, and 0.35 mm meshes is less than 0.65%, confirming that the 0.5 mm mesh provides an optimal balance between numerical fidelity and computational efficiency. Accordingly, this grid size was also adopted for the plate-fin integrated BTMS described in Section 2.3.
Figure 3. (a) Meshed model of the BTMS with an element size of 0.5 mm; (b) Results of the grid independence study for the BTMS under a heat load of 6 W
3.2 Validation with experimental study
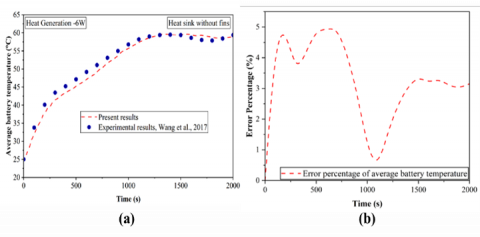
To ensure the accuracy and reliability of the numerical methodology adopted in this study, a validation study was performed by benchmarking the simulation outcomes against the experimental findings of Wang et al. [36]. In their experiment, a heater with a power output of 6 W was employed to simulate the battery discharge process, raising the temperature from an initial 298.15 K (25℃) to the upper safety threshold of 333.15 K (60℃). For consistency, the outer surface of the battery casing was subjected to a boundary condition with a heat transfer coefficient of 10 W/m²K. The validation covered two heat sink configurations with PCM, shown in Figure 4(a), which illustrates the comparison between the average battery temperature profiles obtained from the current numerical simulations and the corresponding experimental results for these two configurations. The temperature variation curves exhibited in the numerical analysis followed similar trends to the experimental observations, with a maximum deviation remaining within 5% as shown in Figure 4(b). Such levels of deviation are consistent with the acceptable ranges reported in previous studies within this research domain [12, 47]. The strong agreement between simulation and experimental results demonstrates the reliability and accuracy of the adopted numerical study. Hence, this approach has been applied for subsequent analyses of flow behavior and heat, providing a reliable and time-efficient framework for thermal performance analysis.
Figure 4. Validation of the numerical model using experimental data from Wang et al. [36]: (a) Average battery temperature evolution and (b) Percentage error analysis for a PCM-Based BTMS under 6 W Heat load, 10 W/m²K housing heat loss, and 25℃ ambient temperature
3.3 Symmetry validation
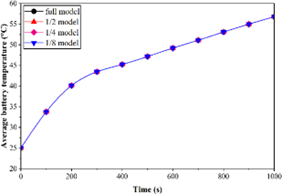
To enhance computational efficiency without compromising accuracy, the BTMS with PCM configuration illustrated in Figure 2(d) was simplified through the application of symmetric boundary conditions. Owing to the geometric and thermal symmetry of the system, the full-scale model was reduced to half (1/2), quarter (1/4), and one-eighth (1/8) domains for comparative validation. The accuracy of these reduced models was assessed against the full BTMS simulation results. As presented in Figure 5, the variation in average battery surface temperature between the full and reduced models was found to be insignificant, with maximum deviations of 0.02%, 0.073%, and 0.09% for the 1/2, 1/4, and 1/8 configurations, respectively. These marginal differences confirm that the reduced symmetry domains effectively replicate the heat transfer and melting characteristics of the complete system while substantially minimizing computational cost and processing time. Therefore, the 1/8 symmetry model was selected for all subsequent simulations.
Figure 5. Comparison of the BTMS models with scales of 1/8, 1/4, 1/2, and full size under a 6 W heat load for average temperature on the battery surface
In this study, the thermal performance of the 18,650 NCM lithium-ion battery is evaluated using PCM, NePCM, fin-PCM, and fin-NePCM configurations by analyzing key metrics such as average surface temperature, maximum temperature difference, melting time, and liquid fraction. The battery surface temperature is required to remain between 25℃ and 45℃, with a maximum temperature difference below 2℃ to avoid thermal hotspots, while temperatures above 60℃ are avoided to maintain thermal safety and chemical stability. Higher thermal conductivity, greater latent heat absorption, and a longer melting period guide the selection of suitable PCMs and NePCMs, especially under high ambient temperatures and high heat loads. The analysis first quantifies the benefits of PCM integration before comparing different PCMs and identifying the best option. Nanoparticles are then added to the selected PCM to enhance conductivity, and the resulting NePCMs are evaluated to determine the most effective composition to optimize volume fraction. This NePCM with optimized volume fraction is combined with fin structures to further improve temperature regulation. A full comparison among pure PCM, fin-PCM, and fin-NePCM models follows, after which the optimal BTMS configuration is assessed under varying ambient temperatures and discharge rates to verify its performance across real operating conditions.
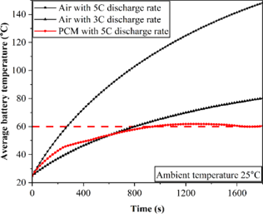
Figure 6. Temporal variation of average battery surface temperature using air and PCM as cooling media under 3C (2.9158 W) and 5C (6.4809 W) discharge rates
4.1 Effect of PCMs on thermal performance
Figure 6 compares the average battery surface temperature using air and lauric-acid-based PCM at 3C and 5C discharge rates. With air cooling, the battery reaches the safety threshold of 60℃ within 280 s at 5C, indicating insufficient heat removal. When lauric acid is used, the time to reach the same temperature extends to 960 s, showing the benefit of latent heat absorption during melting. However, due to its low thermal conductivity, heat accumulates near the battery surface, and the PCM cannot distribute heat effectively once melting progresses. This leads to a gradual temperature rise despite the delayed response.
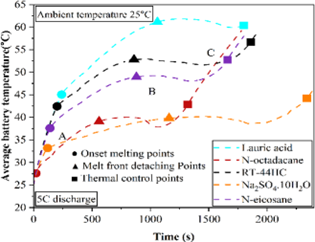
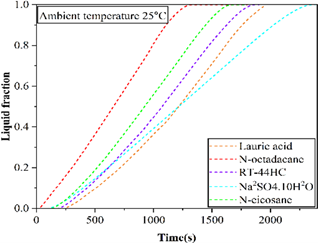
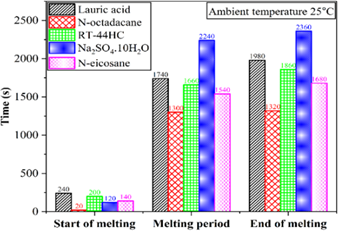
Figures 7 and 8 present a comparative evaluation of five PCMs at 5C discharge under ambient temperatures of 25℃ and 35℃. At 25℃, Na₂SO₄·10H₂O exhibits the strongest thermal control, keeping the battery temperature below 40℃ and maintaining a long, stable phase-change plateau due to its high latent heat and relatively high thermal conductivity. RT-44HC and n-eicosane demonstrate improved performance, each sustaining extended melting durations and limiting battery temperature to below 52.5℃. In contrast, n-octadecane melts too early due to its low melting point (27.07℃), reducing its thermal buffering capability. Lauric acid, despite its high latent heat, shows rapid temperature escalation above 60℃ because of its poor thermal conductivity.
(a)
(b)
(c)
Figure 7. Comparison of different types of PCMs at 25°C ambient temperature at 5C discharge rate (a) Average temperature and time histories of the battery, (b) Liquid fraction of PCMs, and (c) Melting time of PCMs
(a)
(b)
(c)
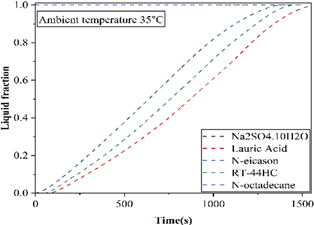
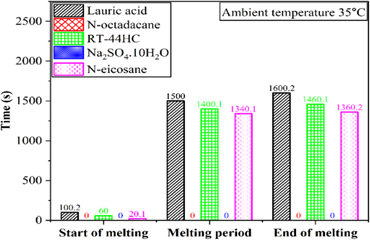
Figure 8. Comparison of different types of PCMs at 35°C ambient temperature at 5C discharge rate (a) Battery average temperature with respect to time, (b) Liquid fraction of PCMs, and (c) PCMs melting time of PCMs
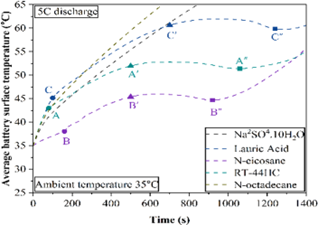
At 35℃ ambient temperature (Figure 8), Na₂SO₄·10H₂O and n-octadecane lose effectiveness as their melting points (32.4℃ and 27.07℃, respectively) are close to or below the ambient temperature, resulting in premature melting and limited heat absorption. N-Eicosane performs moderately, maintaining temperatures below 47.25℃, although its melting duration shortens due to the higher ambient temperature. RT-44HC provides the most stable performance under high ambient conditions, keeping the battery below 52.25℃. Lauric acid again shows a rapid temperature rise beyond 60℃, emphasizing its limitations in high-load scenarios.
Overall, the results highlight that PCM effectiveness strongly depends on melting point, thermal conductivity, and latent heat capacity. In moderate climates, inorganic salt hydrates and high-latent-heat paraffins demonstrate improved performance in BTMS, whereas in warmer conditions, PCMs with higher melting points and adequate conductivity provide more reliable thermal control.
4.2 Effect of nanoparticles
Nanoparticles are commonly added to PCMs to improve their thermal conductivity and enhance heat transfer within the BTMS. In this study, six nanoparticles were examined at a 2% volume fraction: Al₂O₃, CuO, AlN, graphene, graphene oxide, and SWCNTs. Their thermophysical properties are presented in Table 4, and the effective properties of the NePCMs were calculated using the models described in Section 4 and the effective properties of the NePCMs were calculated using the models described in Section 4.
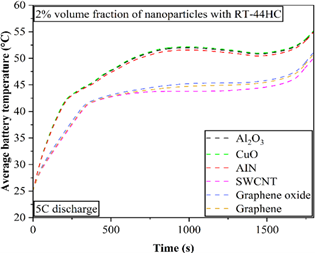
Figure 9(a) shows the average battery surface temperature for all NePCMs under the 5C discharge rate. The results indicate that carbon-based nanoparticles deliver the strongest thermal regulation. The PCM enhanced with SWCNTs exhibits the lowest temperature rise and maintains a longer and flatter temperature plateau, demonstrating efficient heat absorption during melting. Graphene and graphene oxide also reduce the peak temperature noticeably. In comparison, PCMs enhanced with Al₂O₃, CuO, and AlN show only modest temperature reductions.
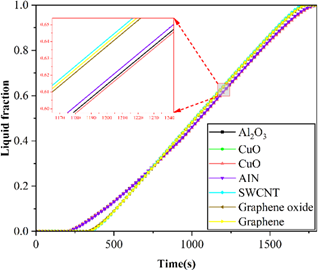
The corresponding liquid-fraction evolution in Figure 9(b) supports these observations. Carbon-based NePCMs display a slower and more extended melting process, which helps delay battery temperature escalation by prolonging latent-heat absorption. Metal oxides and AlN complete melting earlier, limiting their thermal buffering capability.
Effectiveness $_{\text {NePCM }}(\%)=\left(\frac{\Delta \mathrm{T}_{ {max }}}{T_{\text {pure PCM }}}\right) \times 100$ (18)
Table 4. PCM and nanoparticles thermophysical properties
|
Classification |
Material |
Density (kg/m³) |
Specific Heat (J/kg·K) |
Latent Heat (J/kg) |
Melting Point (K) |
Thermal Conductivity (W/m·K) |
Thermal Expansion (1/K) |
Viscosity |
|
Paraffin-based organic PCM |
N-Octadecane [20] |
814(s) 770 (l) |
2150 (s) 2260 (l) |
243680 |
300.22 (s) 303.15 (l) |
0.358 (s) 0.152 (l) |
3.75 × 10⁻³ |
8.4 × 10⁻⁴ |
|
N-Eicosane [48] |
769 |
1926 (s) 2400 (l) |
248,000 |
308 (s) 310 (l) |
0.423 (s) 0.146 (l) |
0.000008 |
|
|
|
RT-44HC [49] |
800(s) 700 (l) |
2000 |
256,000 |
314.15 (s) 317.15 (l) |
0.2 |
0.00259 |
0.008 |
|
|
Non-paraffin organic PCM |
Lauric Acid [50] |
940(s) 885(l) |
2180 (s) 2390 (l) |
187210 |
316.65 (s) 321.35 (l) |
0.16 (s) 0.14 (l) |
9 × 10⁻⁴ |
6.7 × 10⁻⁶ |
|
Inorganic PCM |
Na₂SO₄·10H₂O [51] |
1460(s) 1330(l) |
1930 |
241000 |
305.55 (s) 308.15 (l) |
0.544 |
0.0005 |
0.007 |
|
Carbon-based nanoparticle |
SWCNT [52] |
2600 |
425 |
– |
– |
6600 |
0.0000015 |
– |
|
Graphene oxide [29] |
3600 |
765 |
– |
– |
3000 |
1.25 × 10⁻⁵ |
|
|
|
Graphene [53] |
2200 |
790 |
|
|
5000 |
0.0000035 |
– |
|
|
Metal-based nanoparticle |
Al₂O₃ [54] |
3970 |
765 |
– |
– |
40 |
8.5 × 10⁻⁶ |
– |
|
CuO [55] |
6500 |
540 |
– |
– |
18 |
1.67 × 10⁻⁵ |
– |
|
|
AlN [56] |
3260 |
740 |
– |
– |
319 |
0.0000045 |
– |
(a)
(b)
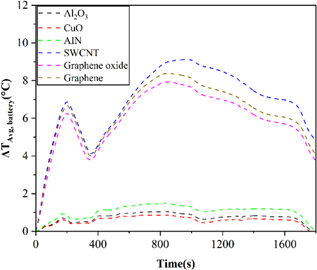
Figure 9. Comparison of different types of nanoparticles (2% volume fraction) dispersed in PCM (RT-44HC) at a 5C discharge rate: (a) Average battery surface temperature difference, and (b) Liquid fraction
(a)
(b)
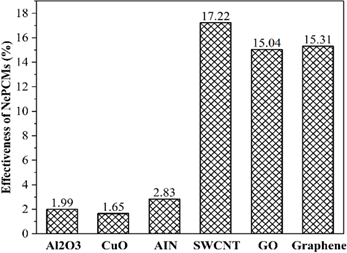
Figure 10. Comparison of different types of nanoparticles (2% volume fraction) dispersed in PCM (RT-44HC) at a 5C discharge rate: (a) Temperature difference between pure PCM (RT-44HC) and various NePCMs over time; (b) Temperature reduction effectiveness of NePCMs
As illustrated in Figure 10(a) and Figure 10(b), the 2% SWCNT-enhanced PCM achieved the greatest improvement, lowering the average battery temperature by 9.11℃ and reaching an effectiveness of 17.22%. Graphene and graphene oxide also showed strong performance, reducing the temperature by 8.38℃ (15.31%) and 7.93℃ (15.04%), respectively. The superior performance of carbon-based nanoparticles originates from their high thermal conductivity and structural characteristics. The 2D structure of graphene and graphene oxide and the 1D morphology of SWCNTs provide large interfacial contact areas, lower Kapitza resistance, and form continuous conductive pathways that promote rapid heat spreading [57]. These features enable more effective thermal regulation than conventional spherical or tubular nanoparticles.
In comparison, metal oxide nanoparticles such as Al₂O₃ and CuO, and nitride-based AlN, provided only moderate improvements. In comparison with Al₂O₃ and CuO, AlN showed slightly enhanced performance by reducing the temperature gradient by 2.38% (as shown in Figure 10(b)) and by slightly increasing the initial melting rate (as shown in Figure 9(a) and Figure 9(b). Overall, carbon-based nanoparticles, particularly SWCNTs, demonstrated the highest enhancement in PCM thermal performance for BTMS applications. Based on this finding, the SWCNT-based RT-44HC PCM is selected for further analysis.
However, nanoparticle type alone does not ensure optimal performance. Thermal behavior is strongly influenced by nanoparticle volume fraction. Very low concentrations may not meaningfully improve heat transfer, while excessive loading can increase viscosity, reduce specific heat capacity, and promote agglomeration, resulting in higher flow resistance and reduced thermal efficiency. Thus, analyzing different nanoparticle volume fractions is essential for identifying the optimal concentration that maximizes BTMS performance.
(a)
(b)
(c)
(d)
Figure 11. Effect of NePCM nanoparticle volume fraction on battery thermal performance at 5C and 25℃: (a) Average battery temperature, (b) NePCM liquid fraction, (c) Temperature reduction versus pure PCM, and (d) Bttery temperature non-uniformity
4.3 Effect of volume fractions of NePCMs
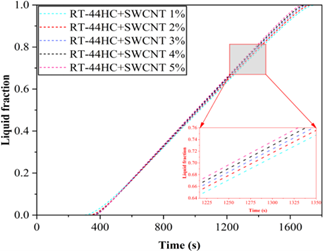
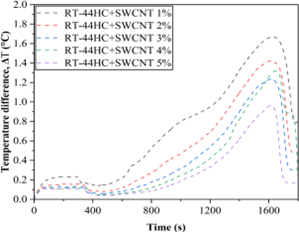
Figure 11 evaluates the effect of different SWCNT volume fractions on the thermal behavior of RT-44HC. The results of section 4.2 showed that the 2% SWCNT mixture provided improved performance. However, Figure 11(a) indicates that an increase in the concentration beyond 3% results in an insignificant effect on average battery temperature. This trend is confirmed in Figure 11(c), where the maximum temperature reductions achieved with 3%, 4%, and 5% SWCNT are 9.13℃, 9.46℃, and 9.68℃, respectively. Based on these results, the current study concludes that the 4 % of SWCNT is the most balanced option with respect to both performance and material use.
This diminishing return is linked to the trade-off that accompanies higher nanoparticle loading. While additional SWCNTs enhance thermal conductivity, they also increase viscosity and reduce the latent heat capacity of the mixture [58]. As a result, the ability of the PCM to store heat during melting weakens at higher concentrations. This behavior is evident in Figure 11(a) and (c), where, after complete PCM melting, the lower SWCNT concentrations show slightly better long-term temperature control.
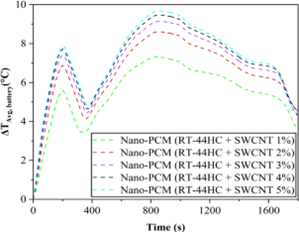
Thermal uniformity is another important factor. Figure 11(d) shows that an increase in the nanoparticle concentration reduces the temperature difference between the hottest and coldest regions of the battery. The 4% and 5% mixtures produce the most uniform profiles, indicating better heat spreading within the PCM. This finding is supported by the contours shown in Figure 12(b), where the 4% mixture exhibits more even melting and smoother temperature distribution across the domain.
Overall, adding nanoparticles improves heat transfer, excessive loading reduces latent heat storage, increases resistance to flow, and raises cost. The results of the current study clearly show that 4% SWCNT provides the best compromise between temperature reduction, melting behavior, and uniformity. Therefore, this concentration is selected for further analysis in the subsequent sections.
4.4 Effect of the fin
Incorporating thermally conductive fins into the PCM is an effective way to improve heat transfer inside a BTMS [12, 18]. The fins act as extended surfaces that guide heat deeper into the PCM, reducing thermal resistance around the battery. To assess this effect, a four-fin plate configuration was simulated. As shown in Figure 13(a), the finned PCM lowers the average battery temperature more effectively as compared to the pure PCM. The maximum temperature drop achieved is 5.21℃, corresponding to a 9.95% improvement over the no fin case. When compared with the air-cooled model, the reduction reaches 57.73℃ (54.81%), as presented in Figure 13(d). The contours in Figure 12(c) also demonstrate that the fins promote more uniform heat dispersion within the PCM, preventing localized hot spots.
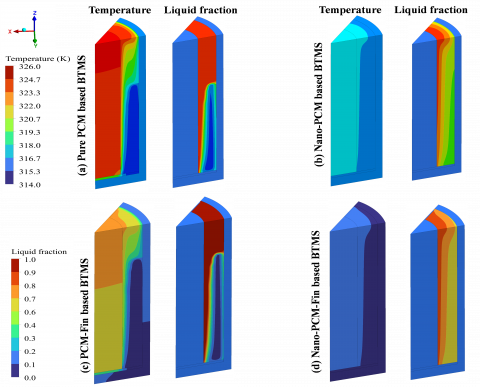
Figure 12. Temperature and PCM liquid fraction contours for the 1/8-scale models of various BTMS configurations at 1200 s, under a 5C discharge rate and 25℃ ambient temperature
Figure 13. Effect of nanoparticle volume fraction in RT-44HC PCM on battery thermal performance at 5C and 25℃: (a) Average battery temperature, (b) NePCM liquid fraction, (c) Temperature reduction relative to pure PCM, and (d) Cell temperature non-uniformity
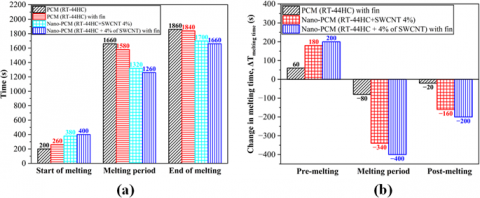
As shown in Figure 13(d), fin integration also influences the melting behaviour of the PCM. The pre-melting period increases by 20 s because more heat is absorbed through the fin surfaces before melting starts. Once melting begins, the enhanced conduction shortens the total melting duration by 80 s, and full melting is completed 20 s earlier as compared to the PCM without fins. These results indicate that fins accelerate melting and improve heat absorption during the early heating stage.
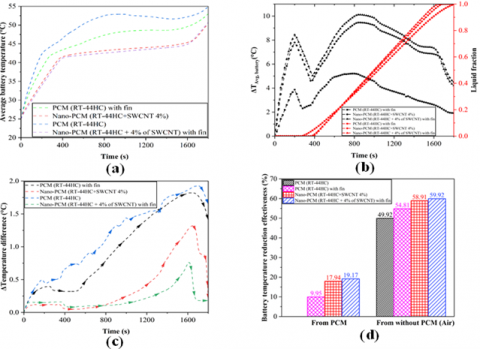
To further enhance the BTMS performance, the optimal NePCM identified earlier (RT-44HC with 4% SWCNT) was combined with PCM and fin structure. This hybrid NePCM-fin system produced the strongest thermal response among all tested configurations. As illustrated in Figure 13(d), it reduces the average battery temperature by 10.11℃ relative to pure PCM, and by 63.11℃ (59.92%) compared with the air-cooled model. Figure 13(c) shows that the maximum temperature difference within the battery decreases to less than 0.75℃, indicating a highly uniform temperature distribution. This observation is supported by the contours in Figure 12(d), where the melting front appears smoother and more evenly distributed across the PCM domain.
An important outcome of this combined approach is that the maximum battery temperature remains below the safe operating limit of 45℃. The temperature reduction, faster melting, and improved thermal uniformity demonstrate that the NePCM-fin arrangement offers stable and reliable temperature control, making it the most effective BTMS configuration evaluated in this study.
4.5 Comparison of PCM, nano-PCM, and nano-PCM with fin BTMS models
To compare the overall thermal performance of the BTMS configurations, three aspects were evaluated: average battery temperature, temperature uniformity, and melting behaviour. The tested models include pure PCM (RT-44HC), PCM with fins, NePCM (RT-44HC with 4% SWCNT), and the combined NePCM-fin system.
In terms of temperature reduction, Figure 13(a) and (b) show that the NePCM-fin configuration provides the highest cooling capability. It lowers the battery temperature by 10.11℃ compared with pure PCM (19.17%) and by 63.11℃ (59.92%) relative to the air-cooled case, as presented in Figure 13(d). This improvement results from the combined effects of SWCNT-enhanced thermal conductivity and the extended heat-spreading paths created by the fins. The NePCM model also demonstrates enhanced performance, reducing the temperature by 9.46℃ (17.94%) relative to pure PCM and 62.04℃ compared to air cooling. The PCM-fin model shows a moderate reduction of 5.15℃ (9.95%) from pure PCM and 57.73℃ (54.81%) from the air-based system. However, it is unable to maintain temperatures below 49℃ during peak load. These comparisons indicate that while both nanoparticles and fins improve conduction, their combination yields the most effective thermal response.
Figure 14. Comparison of different BTMS models at a 5C discharge rate: (a) Melting time history of PCM, and (b) Variation in melting time relative to the base PCM (RT-44HC)
Temperature uniformity across the battery cells is shown in Figure 13(c). The NePCM-fin system exhibits the lowest maximum temperature difference, maintaining it below 0.75℃. The corresponding values for pure PCM, NePCM, and PCM-fin are 1.86℃, 1.32℃, and 1.82℃. This demonstrates that NePCM-fin not only reduces overall temperature but also distributes heat evenly. The thermal and liquid-fraction contours in Figure 12(a)–(d) support this finding. Figure 12(a) shows that pure PCM melts unevenly, with a large solid region remaining near the housing due to limited thermal conductivity. PCM-fin (Figure 12(c)) improves heat penetration but still displays non-uniform melting. NePCM (Figure 12(b)) achieves more balanced thermal spreading. In contrast, the NePCM-fin configuration (Figure 12(d)) exhibits a uniform temperature field and consistent melting across the entire PCM domain, minimizing hotspots.
The melting history in Figure 14(a) and the melting-time changes in Figure 14(b) further clarify the energy-storage behaviour. As compared to pure PCM, the initiation of melting is delayed by about 60 s, 180 s, and 200 s for PCM-fin, NePCM, and NePCM-fin, respectively. This delay occurs because heat is initially absorbed by the fins or distributed within the nanoparticle before accumulating in the PCM. Despite this delay, all enhanced systems exhibit faster melting once the phase change begins. Compared with pure PCM, the melting duration is reduced by approximately 80 s in PCM-fin, 340 s in NePCM, and 400 s in NePCM-fin. The shortened melting time reflects improved heat conduction and more efficient thermal dispersion.
Overall, the NePCM-fin model delivers the best performance across all metrics. It maintains the battery well within the recommended 25–45℃ range, produces the smallest temperature gradient, and ensures uniform melting. The combination of nanoscale thermal conductivity enhancement and fin-based conduction provides a stable and reliable solution for high-performance BTMS applications.
4.6 Thermal characterization of 4% SWCNT-enhanced PCM (RT-44HC) with plate-fin based BTMS
Based on the above results, it can be concluded that the BTMS configuration incorporating 4% volume fraction of SWCNT-enhanced RT-44HC PCM with a plate-fin structure demonstrates greater thermal performance compared to other models. To further investigate this configuration, numerical simulations were performed to examine its thermal behavior under varying ambient temperatures of 15℃, 25℃, 30℃, and 35℃. The model was also evaluated at discharge rates of 3C and 5C, corresponding to constant heat loads of 2.9158 W and 6.4809 W, respectively.
4.6.1 Effect of various ambient temperature conditions
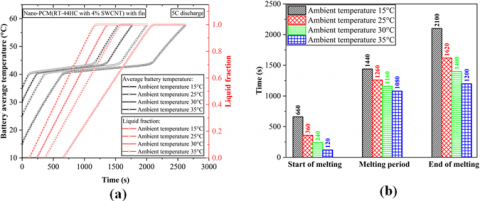
EVs are operated under a wide range of environmental conditions that not only vary with geography but also across different seasons. Consequently, it is essential for a BTMS to deliver consistent and reliable thermal performance across varying ambient temperatures. While previous sections of this study focused on a standard ambient condition of 25℃, this section explores the influence of ambient temperatures of 15℃, 25℃, 30℃, and 35℃ on the thermal response of the optimized BTMS, which employs a 4% SWCNT-enhanced RT-44HC PCM with a plate-fin configuration.
To capture the impact of ambient variation, simulations were conducted by initializing the temperatures of the battery, PCM, insulator, and fins to match the respective ambient conditions. Figure 15(a) shows the time evolution of the battery average temperature and the liquid fraction. Moreover, Figure 15(b) shows the melting time histories of the PCM under these conditions. It is observed that lower ambient temperatures significantly prolong the time required for the system to reach the PCM melting point. This may be attributed to the larger thermal gradient between the initial condition and the PCM phase change threshold. For instance, when the ambient temperature is set to 15℃, the BTMS experiences an extended pre-melting phase, as the thermal energy must first bridge a wider temperature gap before initiating phase transition. Quantitatively, the duration of the pre-melting phase decreases sharply with increasing ambient temperature, reduced by approximately 45.46%, 63.64%, and 81.82% when the ambient temperature increases from 15℃ to 25℃, 30℃, and 35℃, respectively. This trend underscores the importance of initial system temperature alignment with ambient conditions, which strongly influences the onset of melting. In the melting phase, a similar but less pronounced trend is noted. The melting duration decreases by 12.50%, 19.44%, and 25% for ambient conditions of 25℃, 30℃, and 35℃, respectively, compared to the 15℃ baseline. This reduced phase change time can be attributed to the fact that, at lower ambient temperatures, residual solid PCM remains near the housing walls, which retards complete melting due to uneven heat propagation. The impact of ambient temperature becomes even more apparent during the post-melting or thermal control period. Here, the BTMS demonstrates a reduction in operation time by 22.86%, 33.33%, and 42.43% as ambient temperature increases to 25℃, 30℃, and 35℃, respectively. Despite these variations, one key observation is that in all scenarios the BTMS successfully maintains the battery temperature below the critical safety threshold of 45℃ throughout the entire phase change process, as evidenced in Figure 15(a). This consistent thermal control, even under elevated external temperatures, affirms the robustness and adaptability of the NePCM-fin configuration for diverse climatic conditions.
Figure 15. Effect of different ambient temperatures on 4% SWCNT-enhanced PCM (RT-44HC) at a 5C discharge rate: (a) Battery average temperature and PCM liquid fraction versus time histories, and (b) PCM melting time
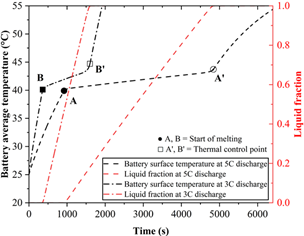
Figure 16. Average battery temperature with respect to time and PCM liquid fraction for a 4% SWCNT-enhanced RT-44HC-based BTMS under 3C (heat generation of 2.9158 W) and 5C (heat generation of 6.4809 W) discharge rates at 25℃ ambient temperature
4.6.2 Effect of heat loads
The thermal performance of the optimized BTMS using RT-44HC PCM enhanced with 4% SWCNTs and plate fins was evaluated under 3C (2.916 W) and 5C (6.481 W) discharge rates. Figure 16 shows the average battery surface temperature and NePCM liquid fraction for both conditions. At 5C, the BTMS reaches critical thermal points, including the onset and completion of melting, more quickly than at 3C. The temperatures at these points, marked as A, B, A′, and B′ (as shown in Figure 16), remain nearly identical, indicating consistent thermal behavior. At 3C, the phase change process takes longer due to slower heat accumulation, whereas at 5C it accelerates without affecting thermal stability. The high thermal conductivity of SWCNTs combined with the extended conduction paths of the plate fins allows rapid heat absorption and dissipation, maintaining battery temperatures below the safe limit of 45℃ under both conditions.
This study uses a commercially adopted 18,650 NCM lithium-ion battery, commonly integrated into EVs from Tesla, Nissan, Chevrolet, and BMW [18], to ensure practical relevance. In real EV operation, these cells generate substantial heat during high-rate cycling, which requires an effective BTMS. EV operation requires maintaining cell temperatures within 25–45℃ and limiting module-level temperature differences to below 5℃ [10, 11], as battery life drops by about two months for every 1℃ increase within the 30–40℃ range. Although LIBs can operate up to 60℃, temperatures beyond this threshold accelerate degradation and raise the risk of thermal runaway [12, 13]. To meet these demands without adding power consumption or system complexity, this work applies a fully passive BTMS. RT-44HC PCM maintains peak temperatures below 52.25℃ at 35℃ ambient conditions, and adding SWCNTs further enhances heat dissipation, lowering the average temperature by 9.11℃ (17.22%) at a 5C rate. The optimized NePCM-fin configuration delivers the strongest performance, reducing temperatures by 10.11℃ (19.17%) compared with pure PCM and by 63.11℃ (59.92%) compared with air cooling. It also keeps maximum temperatures below 45℃ at both 3C and 5C discharge rates while maintaining surface temperature differences under 0.75℃ across all ambient conditions (15–35℃). These results show that the NePCM-fin design can handle high discharge rates and elevated ambient temperatures, providing a safe, effective, and practical solution for real EV battery thermal management while supporting future advancements for both industry and researchers.
Effective thermal management is essential in electric vehicles to keep lithium-ion batteries within safe temperature limits, extend their lifespan, and reduce the risk of thermal runaway. In this study, a detailed numerical investigation was carried out on five PCMs from two categories: organic and inorganic. Six types of nanoparticles were also examined, including metal oxides, nitrides, and carbon-based materials, with volume fractions ranging from 1% to 5%, both with and without fin-assisted BTMS configurations. In addition, four BTMS designs were compared: Pure PCM, PCM with fins, NePCM, and NePCM with fins. The best-performing BTMS configuration from this analysis was further tested under different ambient temperatures (15, 25, 30, and 35℃) and high discharge rates (3C and 5C). Based on these investigations, the main conclusions are as follows.
The authors would like to acknowledge the financial assistance provided by Universiti Teknologi PETRONAS through its STRIF research grant number 015LA0-076 for the supplementary funding of this research.
|
Amushy |
constant for the mushy zone, kg/m³ s |
|
C |
discharge rate unit |
|
Cp |
specific heat, J/kg K |
|
h0 |
heat loss coefficient, W/m² K |
|
k |
coefficient of thermal conductivity, W/m K |
|
P |
aspect ratio of the nanoplatelets |
|
Qt |
total heat generation, W |
|
Qb |
heat generation per unit volume, W/m³ |
|
$\vec{S}$ |
source term for momentum, N/m³ |
|
$\vec{v}$ |
velocity vector, m/s |
|
Vliquid |
liquid PCM velocity vector, m/s |
|
v |
volume, mm³ |
|
uliquid |
liquid velocity of the PCM, m/s |
|
u |
superficial velocity, m/s |
|
VPCM |
total PCM volume, m³ |
|
Greek letters |
|
|
α |
ratio of heat transfer area |
|
β |
thermal expansion coefficient (K⁻¹) |
|
ρ |
density, kg/m³ |
|
γ |
liquid fraction |
|
μ |
viscosity, Pa·s |
|
$\mathrm\phi$ |
volume fraction |
|
$\mathrm{\phi_{max}}$ |
maximum packing fraction |
|
Subscripts |
|
|
l |
latent |
|
np |
nanoparticle |
|
ref |
reference |
|
s |
sensible |
|
Acronyms |
|
|
BTMS |
Battery Thermal Management System |
|
CNP |
carbon-based nanoparticle |
|
CNT |
carbon nanotube |
|
EG |
expanded graphite |
|
Ev |
electric vehicle |
|
FPCM |
flexible composite phase change material |
|
GN |
graphene nanoparticle |
|
GNP |
graphene nanoplatelets |
|
GO |
graphene oxide |
|
LIBs |
lithium-ion batteries |
|
MWCNT |
multi-walled nanotube |
|
NCM |
linixcoymnzo2 |
|
NePCM |
nano-enhance phase change material |
|
PCM |
phase change material |
|
SPT |
safe peak temperature |
|
SWCNT |
single-walled carbon nanotube |
|
TCE |
thermal conductivity enhancement |
|
TMS |
thermal management system |
|
TR |
thermal runway |
[1] National Research Council. (1977). Energy and climate: Studies in geophysics.
[2] Kiani, M., Omiddezyani, S., Houshfar, E., Miremadi, S.R., Ashjaee, M., Nejad, A.M. (2020). Lithium-ion Battery Thermal Management System with Al2O3/AgO/CuO nanofluids and phase change material. Applied Thermal Engineering, 180: 115840. https://doi.org/10.1016/j.applthermaleng.2020.115840
[3] Adhikari, N., Bhandari, R., Joshi, P. (2024). Thermal analysis of lithium-ion battery of electric vehicle using different cooling medium. Applied Energy, 360: 122781. https://doi.org/10.1016/j.apenergy.2024.122781
[4] Liu, J., Nie, J., Zhang, W., Li, L., Yuan, H. (2024). Product development strategies of electric vehicle manufacturers: Considering government subsidy and consumers' environmental preferences. Technological Forecasting and Social Change, 201: 123222. https://doi.org/10.1016/j.techfore.2024.123222
[5] Li, J., Hu, Y., Xie, H., Peng, J., Fan, L., Zhou, J., Lu, B. (2022). Weak cation-solvent interactions in ether-based electrolytes stabilizing potassium-ion batteries. Angewandte Chemie International Edition, 61(33): e202208291. https://doi.org/10.1002/ange.202208291
[6] Jaguemont, J., Van Mierlo, J. (2020). A comprehensive review of future thermal management systems for battery-electrified vehicles. Journal of Energy Storage, 31: 101551. https://doi.org/10.1016/j.est.2020.101551
[7] Nazari, A., Farhad, S. (2017). Heat generation in lithium-ion batteries with different nominal capacities and chemistries. Applied Thermal Engineering, 125: 1501-1517. https://doi.org/10.1016/j.applthermaleng.2017.07.126
[8] Sevugan, P.A., Pradeep, M., Krishnaswamy, A., Karunamurthy, K. (2022). Battery Thermal Management System for electric vehicles using Phase Change Materials. Materials Today: Proceedings, 51: 1604-1611. https://doi.org/10.1016/j.matpr.2021.10.468
[9] Kumar, R., Chavan, S. (2022). Numerical and experimental investigation of thermal behaviour for fast charging and discharging of various 18650 lithium batteries of electric vehicles. International Journal of Heat & Technology, 40(6): 1492-1499. https://doi.org/10.18280/ijht.400618
[10] Ramadass, P.H.B.W.R.P.B., Haran, B., White, R., Popov, B.N. (2002). Capacity fade of Sony 18650 cells cycled at elevated temperatures: Part I. Cycling performance. Journal of Power Sources, 112(2): 606-613. https://doi.org/10.1016/s0378-7753(02)00474-3
[11] Wu, M.S., Chiang, P.C.J. (2007). High-rate capability of lithium-ion batteries after storing at elevated temperature. Electrochimica Acta, 52(11): 3719-3725. https://doi.org/10.1016/j.electacta.2006.10.045
[12] Akula, R., Minnikanti, A., Balaji, C.J.A.T.E. (2024). Pin fin-PCM composite heat sink solution for thermal management of cylindrical Li-ion battery. Applied Thermal Engineering, 248: 123146. https://doi.org/10.1016/j.applthermaleng.2024.123146
[13] Wu, H., Zhang, X., Cao, R., Yang, C. (2021). An investigation on electrical and thermal characteristics of cylindrical lithium-ion batteries at low temperatures. Energy, 225: 120223. https://doi.org/10.1016/j.energy.2021.120223
[14] Li, X., Zhao, F., Hou, J., Guo, W. (2021). Features and spread mechanism of thermal runaway for electric car batteries. International Journal of Heat & Technology, 39(4): 1066-1074. https://doi.org/10.18280/ijht.390404
[15] Li, H., Liu, X., Fang, G. (2010). Preparation and characteristics of n-nonadecane/cement composites as thermal energy storage materials in buildings. Energy and Buildings, 42(10): 1661-1665. https://doi.org/10.1016/j.enbuild.2010.04.009
[16] Lv, Y., Situ, W., Yang, X., Zhang, G., Wang, Z. (2018). A novel nanosilica-enhanced phase change material with anti-leakage and anti-volume-changes properties for battery thermal management. Energy Conversion and Management, 163: 250-259. https://doi.org/10.1016/j.enconman.2018.02.061
[17] Shastri, D.S., Mahajan, M.R., Sur, A., Bhatkar, V.W. (2025). Electric vehicle battery cooling using Phase Change Materials and nanofluids. International Journal of Heat & Technology, 43(3): 989-996. https://doi.org/10.18280/ijht.430317
[18] Zare, P., Perera, N., Lahr, J., Hasan, R. (2024). A novel thermal management system for cylindrical lithium-ion batteries using internal-external fin-enhanced phase change material. Applied Thermal Engineering, 238: 121985. https://doi.org/10.1016/j.applthermaleng.2023.121985
[19] Subramanian, M., Hoang, A.T., Nižetić, S., Solomon, J.M., Balasubramanian, D., Metghalchi, H., Nguyen, X.P. (2021). A technical review on composite phase change material based secondary assisted Battery Thermal Management System for electric vehicles. Journal of Cleaner Production, 322: 129079. https://doi.org/10.1016/j.jclepro.2021.129079
[20] Zhao, R., Gu, J., Liu, J. (2017). Optimization of a phase change material based internal cooling system for cylindrical Li-ion battery pack and a hybrid cooling design. Energy, 135: 811-822. https://doi.org/10.1016/j.energy.2017.06.168
[21] Cai, S., Ji, J., Zhang, X., Zhang, C., Pan, Z., Zhang, C., Zhao, Y. (2024). Development of bio-based flexible Phase Change Materials utilizing lauric acid for Battery Thermal Management Systems. Journal of Energy Storage, 86: 111382. https://doi.org/10.1016/j.est.2024.111382
[22] Wang, Z., Wang, J. (2020). Investigation of external heating-induced failure propagation behaviors in large-size cell modules with different Phase Change Materials. Energy, 204: 117946. https://doi.org/10.1016/j.energy.2020.117946
[23] Heyhat, M.M., Mousavi, S., Siavashi, M. (2020). Battery thermal management with thermal energy storage composites of PCM, metal foam, fin and nanoparticle. Journal of Energy Storage, 28: 101235. https://doi.org/10.1016/j.est.2020.101235
[24] Shivram, S., Harish, R. (2024). Impact of dual nano-enhanced Phase Change Materials on mitigating thermal runaway in lithium-ion battery cell. Case Studies in Thermal Engineering, 60: 104667. https://doi.org/10.1016/j.csite.2024.104667
[25] Ranjan, R., Kumar, R., Srinivas, T. (2024). Thermal performance of nano-enhanced phase change material and air-based lithium-ion Battery Thermal Management System: An experimental investigation. Journal of Energy Storage, 82: 110567. https://doi.org/10.1016/j.est.2024.110567
[26] Shaik, S.A., Nigam, P.K., Gugulothu, S.K. (2025). Advanced fin designs for improved thermal management in PCM-based latent heat storage systems. Applied Thermal Engineering, 272: 126337. https://doi.org/10.1016/j.applthermaleng.2025.126337
[27] Chavez, M.D., Sullayme, D.V., Vidal, Y.S., Salazar, J.V., Canazas, J., Diaz, C. (2025). Numerical study on thermal management of electric vehicle battery cooling modules using Al2O3 nanofluids. International Journal of Heat & Technology, 43(1): 1-10. https://doi.org/10.18280/ijht.430101
[28] Das, N., Kohno, M., Takata, Y., Patil, D.V., Harish, S. (2017). Enhanced melting behavior of carbon based phase change nanocomposites in horizontally oriented latent heat thermal energy storage system. Applied Thermal Engineering, 125: 880-890. https://doi.org/10.1016/j.applthermaleng.2017.07.084
[29] Safaei, M.R., Goshayeshi, H.R., Chaer, I. (2019). Solar still efficiency enhancement by using graphene oxide/paraffin nano-PCM. Energies, 12(10): 2002. https://doi.org/10.3390/en12102002
[30] Shivram, S., Harish, R. (2024). Effect of dual NEPCM and tapered fins on thermal runaway control in lithium-ion batteries. Case Studies in Thermal Engineering, 63: 105346. https://doi.org/10.1016/j.csite.2024.105346
[31] Ren, J., Rasheed, R.H., Bagheritabar, M., Abdul-Redha, H.K., et al. (2024). Battery Thermal Management System by employing different Phase Change Materials with SWCNT nanoparticles to obtain better battery cooling performance. Case Studies in Thermal Engineering, 61: 104987. https://doi.org/10.1016/j.csite.2024.104987
[32] Rasangika, A.H.D.K., Nasif, M.S., Al-Waked, R. (2023). Comparison of forced convective heat-transfer enhancement of conventional and thin plate-fin heat sinks under sinusoidal vibration. Applied Sciences, 13(21): 11909. https://doi.org/10.3390/app132111909
[33] Rasangika, A.H.D.K., Nasif, M.S., Pao, W., Al-Waked, R. (2023). CFD investigation of the effect of vibration direction on the heat transfer enhancement of heat sink. CFD Letters, 15(10): 170-185. https://doi.org/10.37934/cfdl.15.10.170185
[34] Nawaz, M.Q., Rasangika, A.H.D.K., Soomro, A.A., Khan, R. (2025). Numerical investigation of forced convective heat transfer performance of slotted and twisted I-shaped pin fin heat sink. Case Studies in Thermal Engineering, 76: 107352. https://doi.org/10.1016/j.csite.2025.107352
[35] Mousavi, S., Siavashi, M., Heyhat, M.M. (2019). Numerical melting performance analysis of a cylindrical thermal energy storage unit using nano-enhanced PCM and multiple horizontal fins. Numerical Heat Transfer, Part A: Applications, 75(8): 560-577. https://doi.org/10.1080/10407782.2019.1606634
[36] Wang, Z., Zhang, H., Xia, X. (2017). Experimental investigation on the thermal behavior of cylindrical battery with composite paraffin and fin structure. International Journal of Heat and Mass Transfer, 109: 958-970. https://doi.org/10.1016/j.ijheatmasstransfer.2017.02.057
[37] Tomizawa, Y., Sasaki, K., Kuroda, A., Takeda, R., Kaito, Y. (2016). Experimental and numerical study on phase change material (PCM) for thermal management of mobile devices. Applied Thermal Engineering, 98: 320-329. https://doi.org/10.1016/j.applthermaleng.2015.12.056
[38] Huang, H., Wang, H., Gu, J., Wu, Y. (2019). High-dimensional model representation-based global sensitivity analysis and the design of a novel thermal management system for lithium-ion batteries. Energy Conversion and Management, 190: 54-72. https://doi.org/10.1016/j.enconman.2019.04.013
[39] Fadl, M., Eames, P.C. (2019). Numerical investigation of the influence of mushy zone parameter Amush on heat transfer characteristics in vertically and horizontally oriented thermal energy storage systems. Applied Thermal Engineering, 151: 90-99. https://doi.org/10.1016/j.applthermaleng.2019.01.102
[40] Arıcı, M., Tütüncü, E., Kan, M., Karabay, H. (2017). Melting of nanoparticle-enhanced paraffin wax in a rectangular enclosure with partially active walls. International Journal of Heat and Mass Transfer, 104: 7-17. https://doi.org/10.1016/j.ijheatmasstransfer.2016.08.017
[41] Selimefendigil, F., Öztop, H.F. (2020). Natural convection and melting of NEPCM in a corrugated cavity under the effect of magnetic field. Journal of Thermal Analysis & Calorimetry, 140(3): 1427-1442. https://doi.org/10.1007/s10973-019-08667-x
[42] Krieger, I.M., Dougherty, T.J. (1959). A mechanism for non-Newtonian flow in suspensions of rigid spheres. Transactions of the Society of Rheology, 3(1): 137-152. https://doi.org/10.1122/1.548848
[43] Chu, K., Jia, C.C., Li, W.S. (2012). Effective thermal conductivity of graphene-based composites. Applied Physics Letters, 101(12): 121916. https://doi.org/10.1063/1.4754120
[44] Singh, R.P., Sze, J. Y., Kaushik, S., Rakshit, D., Romagnoli, A. (2021). Thermal performance enhancement of eutectic PCM laden with functionalised graphene nanoplatelets for an efficient solar absorption cooling storage system. Journal of Energy Storage, 33: 102092. https://doi.org/10.1016/j.est.2020.102092
[45] Xue, Q. (2025). Model for thermal conductivity of carbon nanotube-based composites. Physica B: Condensed Matter, 368(1-4): 302-307. https://doi.org/10.1016/j.physb.2005.07.024
[46] Choudhari, V.G., Dhoble, A.S., Panchal, S. (2020). Numerical analysis of different fin structures in phase change material module for battery thermal management system and its optimization. International Journal of Heat and Mass Transfer, 163: 120434. https://doi.org/10.1016/j.ijheatmasstransfer.2020.120434
[47] Sun, Z.Q., Fan, R.J., Zheng, N.B. (2021). Thermal management of a simulated battery with the compound use of phase change material and fins: Experimental and numerical investigations. International Journal of Thermal Sciences, 165: 106945. https://doi.org/10.1016/j.ijthermalsci.2021.106945
[48] Vélez, C., Khayet, M., De Zárate, J.O. (2015). Temperature-dependent thermal properties of 5olid/liquid phase change even-numbered n-alkanes: N-hexadecane, n-octadecane and n-eicosane. Applied Energy, 143: 383-394. https://doi.org/10.1016/j.apenergy.2015.01.054
[49] Ambreen, T., Niyas, H., Kanti, P., Ali, H.M., Park, C.W. (2022). Experimental investigation on the performance of RT-44HC-nickel foam-based heat sinks for thermal management of electronic gadgets. International Journal of Heat and Mass Transfer, 188: 122591. https://doi.org/10.1016/j.ijheatmasstransfer.2022.122591
[50] Shokouhmand, H., Kamkari, B. (2013). Experimental investigation on melting heat transfer characteristics of lauric acid in a rectangular thermal storage unit. Experimental Thermal and Fluid Science, 50: 201-212. https://doi.org/10.1016/j.expthermflusci.2013.06.010
[51] Qu, S., Ma, F., Ji, R., Wang, D., Yang, L. (2015). System design and energy performance of a solar heat pump heating system with dual-tank latent heat storage. Energy and Buildings, 105: 294-301. https://doi.org/10.1016/j.enbuild.2015.07.040
[52] Muhammad, S., Ali, G., Shah, Z., Islam, S., Hussain, S.A. (2018). The rotating flow of magneto hydrodynamic carbon nanotubes over a stretching sheet with the impact of non-linear thermal radiation and heat generation/absorption. Applied Sciences, 8(4): 482. https://doi.org/10.3390/app8040482
[53] Kant, K., Shukla, A., Sharma, A., Biwole, P.H. (2017). Heat transfer study of phase change materials with graphene nano particle for thermal energy storage. Solar Energy, 146: 453-463. https://doi.org/10.1016/j.solener.2017.03.013
[54] Sutheesh, P., Nichit, R.B., Rohinikumar, B. (2024). Numerical investigation of thermal management of lithium-ion battery pack with nano-enhanced phase change material and heat pipe. Journal of Energy Storage, 77: 109972. https://doi.org/10.1016/j.est.2023.109972
[55] Sharma, A., Kothadia, H.B., Singh, S., Mondal, B. (2023). Solidification of nanoparticle-based PCM in a fin-aided triplex-tube energy storage system for cooling applications. Thermal Science and Engineering Progress, 42: 101872. https://doi.org/10.1016/j.tsep.2023.101872
[56] Esmaeili, E., Rounaghi, S.A., Gruner, W., Eckert, J. (2019). The preparation of surfactant-free highly dispersed ethylene glycol-based aluminum nitride-carbon nanofluids for heat transfer application. Advanced Powder Technology, 30(10): 2032-2041. https://doi.org/10.1016/j.apt.2019.06.008
[57] Yu, W., Xie, H., Wang, X., Wang, X. (2011). Significant thermal conductivity enhancement for nanofluids containing graphene nanosheets. Physics Letters A, 375(10): 1323-1328. https://doi.org/10.1016/j.physleta.2011.01.040.
[58] Zhang, Y., Feng, D., Feng, Y., Zhang, X. (2022). Effect of carbon nanotubes on melting latent heat of paraffin wax: An experimental and simulated research. Journal of Energy Storage, 53: 105229. https://doi.org/10.1016/j.est.2022.105229