Mohammed F. Abdulelah*![]() | Ra’ad K. Mohammed Aldulaimi
| Ra’ad K. Mohammed Aldulaimi![]()
© 2025 The authors. This article is published by IIETA and is licensed under the CC BY 4.0 license (http://creativecommons.org/licenses/by/4.0/).
OPEN ACCESS
The developed model (dual layer, multiscale diameter, and staggered pipe arrangement) of a flat plate collector for Thermosyphon solar water heating was proposed experimentally to enhance the thermal performance of the system. The modified design relies on analyzing the effect of varying the dual-layer pipe diameter on the dead regions of the collector. Specifically, this refers to the surfaces that include the regions between the pipes and the terminal sides of the pipes that exhibit low solar absorption because these regions are nearly parallel to solar radiation. Five different dual-layer pipe models (Rt2, Rt3, Rt4, Rt5, and Rt6) were used, including the base model Rt1 (single layer in line pipe arrangement). The Rt2 model was identified to be the model that provides the best thermal performance with an increase in thermal efficiency by 11.64% at 1000 w/m2 and 13.59% at 1600 w/m2. To validate the experimental results Rt2 and Rt3 models were selected to be designed using SolidWorks 2023 and solved numerically using ANSYS 2022 R1 FLUENT. The properties in experimental tests and CFD simulations were proposed to be identical. A notable convergence was seen between the numerical simulations and experimental results, with a maximum error of 7.2%.
flat plate solar collector, thermosyphon solar water heating system, staggered pipe arrangement
The interest in translating the sources of energy worldwide to renewable energy has been accelerated in comparison to using fossil fuels due to the fact that solar energy is a clean, common, and suitable source to fulfill thermal and electric energy requirements and to reduce environmental pollution with the risks of global warming [1]. Thermosyphon Solar Water Heating Systems (TSWHS) are one of the most efficient and widely popular solar energy applications [2]. They absorb the solar radiation and transform it into useful thermal energy.
Moshab and Aldulaimi [3] proposed an absorption tube that aims to improve solar energy capture capacity in a solar receiver. Experimental verifications showed a thermal efficiency of 70.5% with the Rt4 model with a py flow channel. The flat plate collector (SRT2) model, selected for thermal performance, improved the horizontal tank temperature gradient by 17% compared to the standard configuration.
Bhowmik and Amin [4] introduced a solar thermal collector technology that improves efficiency by 10%. The reflector concentrates sun rays onto the collection, converting them into heat and transferring it to water. This prototype system offers the highest thermal efficiency among available solar water heating systems.
Jaisankar et al. [5] analyzed the friction factor and heat transfer properties of a thermosyphon solar water heater system using helical and left-right twisted tape collectors. Results showed that helical and left-right twisted tape collectors enhance heat more than standard tube collectors. Left-right twisted tape collectors achieved a 375% increase in heat transfer and friction factor, three times higher than plain tube collectors.
Ananth and Jaisankar [6] investigated the impact of left-right tube inserts, rods, and spacers on heat transfer and friction factor in a thermosiphon solar water heater. Customized designs with left-right twists were explored to increase internal convective heat transfer and reduce pressure drop. Modified twist designs reduced pressure drop by 47.2% to 8.9% and improved instantaneous thermal efficiency by 53.3% to 38.7%.
Jaisankar et al. [7] investigated the heat transfer and friction factor of a thermosyphon solar water heater with a full-length Left-Right twist and a rod and spacer at the trailing edge. The results show differences of ±7.41% for the Nusselt number and ±14.97% for the friction factor. The twist equipped with a rod and spacer decreases the Nusselt number by 11% and 19%, respectively. The friction factor decreases by 18% and 29%. The heat enhancement is greater in the rod-equipped twist.
Saravanan et al. [8] compared the thermal performance and friction factor of a V-trough thermosyphon solar water heater using helical twisted tapes with different twist ratios. The results show that the PVT collector has higher thermal performance due to higher solar concentration and more reflected parts. The use of helical twisted tape also increases pressure drop and thermal performance. A minimum twist ratio of 3 yields a 19.01% increase in thermal efficiency compared to a basic V-trough collector.
Huang et al. [9] analyzed the thermal efficiency of a thermosyphon flat-plate solar water heater with a mantle heat exchanger, revealing a mean daily efficiency of up to 50%, higher than an all-glass evacuated tubular solar water heater but lower than the flat plate.
He et al. [10] explored the impact of size on thermal performance in FPSCs. It uses numerical simulation models to assess microchannel structural characteristics and flow resistance. Experimental evaluations validate the model's accuracy. Results show that enlarging the microchannel and increasing corrugation height can improve thermal efficiency by 86.10% under optimal conditions. The microchannel is made from stainless steel, enhancing heat absorption and durability.
Wenceslas and Ghislain [11] focused on factors like absorber plate thickness, insulation thickness, and insulation material. Results show that the heater's efficiency increases with reduced collector surface area. Expanding the absorber plate thickness to 0.005 m results in comparable performance to copper plates, while increasing the insulation thickness reduces the heat loss coefficient.
Freegah et al. [12] compared conventional and novel solar flat plate collector models using computational and experimental methods. The new model, featuring longitudinal channels, curvy fins, and elliptical riser pipes, aims to increase the solar radiation exposed surface area. Results show a 23.6% improvement in liquid temperature, 7.9% mass flow rate, and 22.4% overall thermal efficiency.
Amraoui [13] aimed to improve the thermal performance of Ben Slama Romdhane's collector by adding another flow passage of air. A three-dimensional simulation was conducted of a flat air solar collector utilizing transverse baffles that generate turbulence and improve the exchange region.
Shivanayak et al. [14] aimed to improve the thermal performance of the flat plate solar receiver experimentally and numerically by using wavy riser tubes featuring coil inserts and analyzed at varying flow rates of the operating fluid. The pitches of the coil inserts are 10, 20, and 30 mm. In comparison with the plain riser tubes, the thermal efficiency reached 84% for p = 10 mm at Re = 14500.
Himel et al. [15] examined the thermal improvements by the step change in thickness of the absorption plate of the flat plate receiver. Two different setups were created, one with a uniform absorption plate thickness of 0.4 cm, while the other reveals a variable thickness, dividing the plate into equal segments of 0.2 cm and 0.6 cm. The peak thermal efficiency reaches 67.7%. Step-changed absorber plates show potential as cost-efficient, enhanced thermal performance by decreasing resistance and maintaining heat transfer under varied radiation conditions.
Islam et al. [16] examined the effect of utilizing rectangular and square receiver tubes on the thermal performance of the flat plate solar collector, numerically simulated using ANSYS FLUENT. Transient thermal performance analysis was conducted to find the optimum geometrical arrangement. The results indicated that using square receiver tubes improves the thermal efficiency by 8.1% compared to circular-shaped receiver tubes. The square tube exhibited the highest thermal efficiency of 70.44%.
Hassan and Al Dulaimi [17] investigated the use of twisted tape in a flat plate thermosyphon solar water heater to improve thermal efficiency and exergy. Three tube types were tested: regular tube, twisted tube, and twisted tube with twisted tapes. The flat plate was chosen due to its sunlight exposure surface area. The twisted tape was used to enhance interaction between HTF particles and the heated tube surface. The most effective design was found to be the twisted tube with twisted tapes, with values of Nu = 913.71, ηex = 25%, and ηth = 81%.
To improve the ability of a solar concentrator of type (flat plat collector) to convert solar energy into thermal energy for the transport fluid by strengthening the areas with weak solar energy absorption present in the receiving tube as a result of the effect of the angle of solar incidence (cosine effect), a modified TSWHS was suggested based on a dual-layer staggered tube configuration designed to achieve optimal utilization of incident solar energy. This concept was applied using different upper-layer tube diameters under simulated solar conditions to evaluate the influence of diameter variation on thermal enhancement and to exploit the dead regions of the collector. The solar input was simulated using an oriented electric flat heater (12*100 cm) equipped with a parabolic reflector to redirect the heat flux and minimize dispersion, and the models were subjected to multiple heat flux levels. Five dual-layer tube models (Rt2, Rt3, Rt4, Rt5, and Rt6) were examined; these models were compared against the Rt1 model (single layer in line pipe arrangement model), which allows for measuring and verifying the real improvement resulting from the modified models. The findings indicate that the Rt2 model demonstrated the highest thermal performance due to its significant temperature difference and superior thermal efficiency compared to the other models. After determining the model that provided the best thermal improvement, the Rt2 and Rt3 models were selected to validate the experimental findings numerically. The geometries of these models were designed in SolidWorks 2023 and simulated in ANSYS FLUENT 2022 R1, and a notable convergence was seen between the numerical and experimental outcomes.
4.1 Collector efficiency
The useful heat (Qu) transferred to HTF from the receiver model is computed using the balance for the fluid’s volume energy [3].
$\mathrm{Q}_{\mathrm{u}}=\dot{\mathrm{m}}_{\text {HTF }} \mathrm{c}_{\mathrm{p}}\left(\mathrm{T}_{\text {out }}-\mathrm{T}_{\text {in }}\right)$ (1)
where, the specific heat capacity (cp) was calculated at the average mean temperature of the fluid inlet and outlet. Thermal efficiency is defined as:
$\eta_{\mathrm{th}}=\frac{\mathrm{Q}_{\mathrm{u}}}{\mathrm{Q}_{\mathrm{s}}} \times 100 \%$ (2)
where, Qs is the heat flux supplied from the heater.
4.2 Heat transfer
The heat transfer rate in the Rt receiver tube models can also be determined using the subsequent equation [18]:
$\mathrm{Q}_{\mathrm{u}}=\mathrm{U}_{\mathrm{wo}} \mathrm{A}_{\mathrm{wo}}\left(\mathrm{T}_{\mathrm{wo}}-\mathrm{T}_{\mathrm{m}}\right)$ (3)
where, Two is the temperature at the outside surface area of the tube and Tm is the mean Temperature of fluid inlet and outlet, also [19]:
$\frac{1}{\left(\mathrm{U}_{\mathrm{wo}} \mathrm{A}_{\mathrm{wo}}\right)}=\frac{1}{\mathrm{~h}_{\mathrm{wi}} \mathrm{A}_{\mathrm{wi}}}+\frac{\ln \left(D_{h_{\mathrm{o}}} / \mathrm{D}_{h_i}\right)}{\left(2 \pi \mathrm{k}_{\mathrm{w}} \mathrm{l}\right)}$ (4)
where, $D_{h_0}$ and $D_{h_{\mathrm{i}}}$ are outside and inside hydraulic diameters defined as: ((4 x Area)/Perimeter).
hwi internal convective heat transfer coefficient expressed by:
$h_{w i}=\left[\left(\frac{1}{\left(U_{W o} A_{w o}\right)}-\frac{\ln \left(D_{h_{\mathrm{o}}} / \mathrm{D}_{h_i}\right)}{\left(2 \pi k_w l\right)}\right) \times A_{w i}\right]^{-1}$
The above equations derived the average Nu [3]:
$\mathrm{Nu}=\frac{h_{w i} \mathrm{D}_{h_i}}{K_{\text {water }}}$ (5)
4.3 Efficiency evaluation criterion (EEC)
The efficiency evaluation criterion (EEC) was determined to provide an overall evaluation of heat transfer enhancement. Taking into account the consumption of identical pumping energy and operating conditions, while comparing the modified Rt models to the conventional Rt. The EEC is defined as [3]:
$\mathrm{EES}=\frac{\mathrm{Q} / \mathrm{Q}_{\mathrm{o}}}{\Delta \mathrm{p} / \Delta \mathrm{p}_{\mathrm{o}}}$ (6)
where, ($\mathrm{Q}_{\mathrm{o}}, \Delta \mathrm{p}_{\mathrm{o}}$) implies (Q) and ($\Delta \mathrm{p}$) in the standard Rt1 model.
5.1 Experimental construction
Figures 1 and 2 represent an illustration of the model and a layout of the device, respectively. This simulation was conducted in a laboratory and relies on the transfer of solar energy to the receiving model through radiation. A thermal heater was utilized in this simulation to replicate the solar energy and control the change in thermal power. Positioned on a parabolic steel structure, which prevents losses of heat by redirecting the heat into the tube. The width and thickness of the steel sheet are 300 mm and 1 mm, respectively, as indicated in Table 1. A variable voltage apparatus (Contact Voltage Regulator TDGC-series) is connected to the heater. The pipe material was chosen to be copper for its high conductivity (386 W/m2‧K) and substantial melting point of 1000℃. The operating fluid was water. The distance was fixed to be uniform across all models, at 65 mm between the center of the first-layer pipes and the heater surface (based on the largest diameter of the second-layer tube (Rt6 model)). The five and the standard receiver models were simulated realistically solar conditions by exposing the proposed tube models to a uniform heat flux from a thermal heater with an inclination angle of 33°. A flowmeter was positioned at the outlet of the model to set the water flow at 0.001667 kg/s. Type-K thermocouples were placed at the inlet and outlet to measure the outside surface area of the tube (Two) and nine on the outer surface of the pipes (average taken) to measure the HTF inlet and outlet. The 12-channel TM 500 type data logger was used to record and store the data on an SD card, and extracted using a computer. Pressure measurements are recorded using 1 mbar precision using a differential pressure manometer.

Figure 1. Simulated solar collector

1. thermal electric heater, 2. the receiver model Rt, 3. stand, 4. inlet, 5. outlet, 6. insulation, 7. parabolic steel structure.
Figure 2. Layout of the experimental system
Table 1. Experimental system characteristics
|
Feature |
Value |
Feature |
Value |
|
Aperture area, Aa |
0.12 m2 |
Flowrate |
0.001667 kg/s |
|
Working fluid |
Water |
Tilt angle |
33⁰ |
|
Tubes material |
Copper |
|
|
|
Length l |
1 m |
|
|
5.2 Technical details of the models
Five Rt models alongside the base model Rt1 were utilized in this experimental simulation with the aim of identifying the model that provides the highest enhancement in heat transfer performance compared to other models. Each model contains two layers of tubes arranged in a staggered form. The upper layer consists of a pipe, and the lower layer consists of two opposite semicircular pipes. The flat surfaces of the semicircular pipes were considered thermally insulating, limiting heat transfer to the curved surfaces only and facilitating convection analysis while maintaining geometric symmetry and representative heat transfer properties. The dimensions and distances between the pipes were chosen for industrial purposes, including facilitating the welding process. Measurements were taken for temperature difference, average pipe surface temperature, and the pressure drop for all Rt models. Figure 3 shows the model's tube receiver, while the cross-sectional view with the dimensions is shown in Figure 4.

Figure 3. Models tube receiver


Figure 4. Rt models cross-sectional view with their dimensions
The experimental system was executed in the laboratories of Al-Nahrain University's College of Engineering. The test was set up from February 2 to February 16, 2025, with an average maximum ambient temperature of 15℃.
In the simulation system, the working fluid (water) is pumped to the model inlet. A flowmeter was installed at the model outlet to control the flow at 0.001667 kg/s to achieve the highest temperature difference between the inlet and outlet of the model and to guarantee that the flow remains within the laminar flow regime and is also fully developed.
Measurements were conducted after reaching the point of stabilization after the thermal heater is activated.
A data logger records the data result. Four readings were obtained for each heat flux applied involves inlet temperature, outlet temperature, and average tube surface temperature. The Rt model encompasses four heat fluxes: 1000, 1200, 1400, and 1600 w/m2 to simulate realistic solar conditions. Differential pressure is continuously recorded at the inlet and outlet points. Thermocouples type K are positioned at the inlet, outlet, and at nine positions on the surface of the model pipes.
The simulation was solved with the software ANSYS FLUENT 2022 R1 to validate the temperature results of the experimental simulation, and was drawn using SolidWorks 2023. The flow is laminar; to solve the energy equation, an implicit method was selected. The solver algorithm with settings including steady calculation, pressure-based type, SIMPLE scheme as velocity-pressure coupling method, and second-order upwind scheme for energy and momentum equations was selected for the simulation [20].
7.1 Assumptions
The following assumptions and simplifications are made for the built design for the heat transfer and flow model.
• Three-dimensional flow.
• Steady-state.
• Laminar flow, Re < 2300.
• Incompressible flow.
• Gravity.
• No slip conditions.
• Constant properties.
7.2 Boundary conditions
Dual-layer staggered pipe arrangement system, pipes constructed from copper. The model is inclined at a 33-degree angle. Experimentally, the HTF enters at a temperature equivalent to that of the ambient air, while numerically enters at 18℃ (the average temperature of all intakes experimental values). The heat transfer and fluid flow (axial) are time-dependent, three-dimensional, and incompressible. Four different heat fluxes were applied on the upper surface of the pipes, with a constant flow rate of 0.001667 kg/s.
7.3 Governing equations
Continuity, Momentum, and Energy equations are used to describe the flow of the fluid and are shown below:
$\frac{\partial}{\partial x}(\rho u)=0$ (7)
$u \frac{\partial u}{\partial x}=g \sin \theta-\frac{1}{\rho} \frac{\partial p}{\partial x}+\frac{\mu}{\rho}\left(\frac{\partial^2 u}{\partial x^2}+\frac{\partial^2 u}{\partial y^2}+\frac{\partial^2 u}{\partial z^2}\right)$ (8)
$\begin{gathered}\rho c p \frac{\partial T}{\partial x}(u)=k\left[\frac{\partial^2 T}{\partial x^2}+\frac{\partial^2 T}{\partial y^2}+\frac{\partial^2 T}{\partial z^2}\right]+2 \mu\left[\frac{\partial^2 u}{\partial x^2}+\frac{\partial^2 u}{\partial y^2}+\right. \left.\frac{\partial^2 u}{\partial z^2}\right]+\beta T\left(u \frac{\partial p}{\partial x}\right)\end{gathered}$ (9)
7.4 Numerical domain and grid generation
Polyhedral grid was settled to be the mesh type due to the lowest skewness, highest element quality, and the most accurate result. The total number of elements is 2431588 for the 12.5 mm second-layer pipe diameter and 2616000 for the 9.5 mm second-layer pipe diameter, utilizing the multi-zone meshing approach with an inflation as expressed in Figure 5.

(a) Mesh details

(b) Mesh quality
Figure 5. Mesh and grid generation
7.5 Mesh independence test
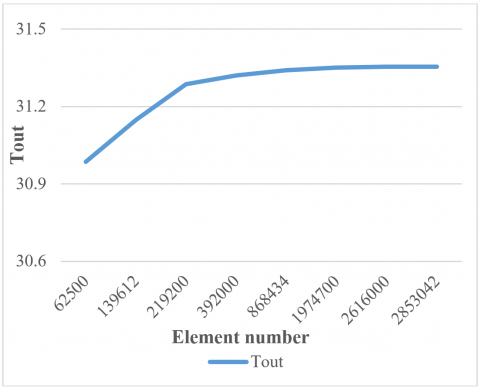
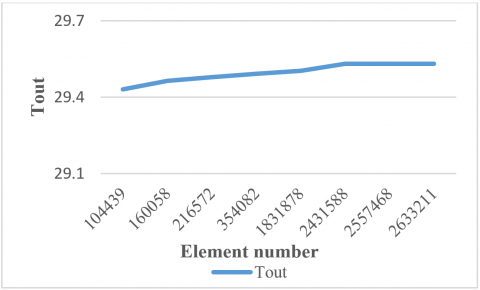
A test was performed to verify the accuracy of the numerical results. Computations were carried out using eight different element numbers: 104439–2633211 element numbers for the Rt3 model and 62500–2853042 for the Rt2 model at a constant heat flux = 1200 W/m2 (Figure 6). An element number of 2616000 (with approximately 0.01% error) and 2431588 (approximately 0.1% error) elements was chosen for the Rt2 and Rt3 models, respectively (Figure 7).
Figure 6. Outlet temperature of water with different element numbers at a constant heat flux = 1200 W/m2 (Rt2 model)
Figure 7. Outlet temperature of water with different element numbers at a constant heat flux = 1200 W/m2 (Rt3 model)
The results of the experimental simulation on the Rt receiver models are demonstrated. The pressure difference and temperature of the HTF are evaluated. The experimental results show the comparison between Rt receiver models and the conventional model in terms of temperature difference (∆T), pressure difference (∆P), Nusselt number (Nu), collector efficiency (η), and EEC at heat fluxes between 1000 and 1600 W/m2. Four heat fluxes were used. These improvements were statistically significant, clearly highlighting the advantages of the improved models. After the calibration of the measurement devices, the maximum uncertainties for the five parameters mentioned above were approximately ±0.81℃, ±1.63 mbar, ±3.99%, ±2.5%, and ±2.3%, respectively.
8.1 Experimental simulation results
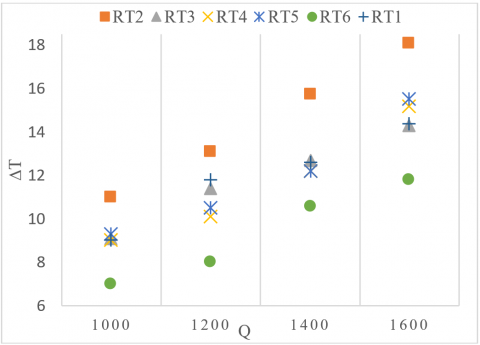
8.1.1 Temperature difference
Figure 8 shows the relation between increasing the heat flux applied to the pipe surface and the temperature difference (∆T in ℃) for all Rt models. The results indicate that the Rt2 model has the highest temperature difference between the inlet and outlet of the model, 18.1℃ at 1600 w/m2, where it gave an increase of 26.04 % compared to the base model Rt1.
Figure 8. The relation between the heat flux and the temperature difference ∆T (℃)
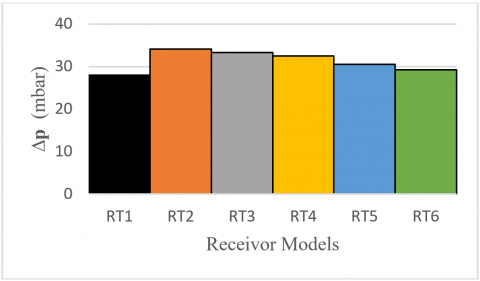
8.1.2 Pressure difference
Figure 9 shows the pressure difference through the TSWHS across different Rt models, focusing on the hydraulic execution of each. As we see in the figure, the Rt2 model demonstrates the most pressure drop due to resistance of high flow resulting from internal structural characteristics or narrower flow pathways that cause higher friction and turbulence. whereas the Rt1 model has the minimal pressure loss, indicating that its geometry facilitates smoother fluid flow with less frictional losses.
Figure 9. Pressure difference ∆P (mbar) for all Rt models
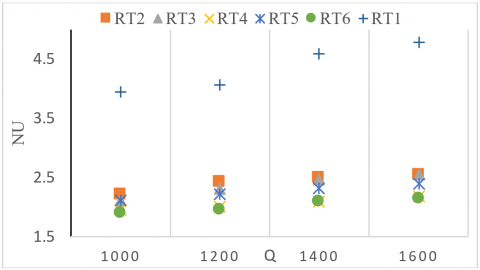
8.1.3 Nusselt number
Figure 10 indicates that the average Nusselt number, which was calculated using Eq. (5), is less in dual-layer, multi-diameter staggered pipe arrangement Rt models, and due to the greater flow distribution, the boundary layer is thicker in comparison with the Rt1 model. Among the modified models, the Rt2 model exhibits higher Nu values, 2.544, while the Rt6 model exhibits the lowest, 2.138. In comparison with the Rt1 model, the base model has the highest Nu values, 4.77, due to in line pipe arrangement, which leads to the ability of the fluid to flow with minimal disturbance. This maintains a consistent flow path with a thin boundary layer, which leads to a more efficient heat transfer rate.
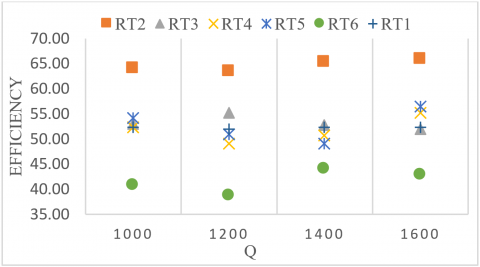
8.1.4 Collector efficiency (η)
Figure 11 shows the relation between the applied heat flux and the fluctuation in collector efficiency. Thermal efficiency, which was calculated using Eq. (2), shows the ability of the system to absorb the applied heat and convert it into useful energy to raise the temperature of water. The Rt2 model achieved the higher thermal efficiency reaching 65.84% at the maximum heat flux (1600 w/m2) and the higher temperature difference between inlet and outlet due to narrowing the fluid flow path while Rt6 exhibits the lowest due to the larger cross-sectional area of the second layer pipe leads to increase the heat loss and reduce the efficiency because of the less thermal interaction between the surface and the fluid. The Rt1 model has a stable performance between 51.9% and 52.38%, outperforming the Rt3 and Rt4 models at some of the applied heat fluxes. In comparison Rt2 modified model has a better thermal performance than the Rt1 model by 13.59%.
Figure 10. The relation between the heat flux and the Nusselt number Nu
Figure 11. The relation between the heat flux and the thermal efficiency (η)
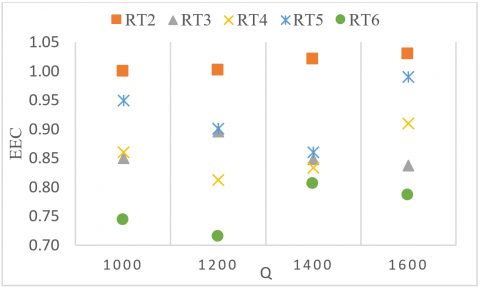
8.1.5 Efficiency evaluation criterion (EEC)
EEC is defined as an indicator of the overall effectiveness of the heat transfer unit, and it represents the ratio of the heat transfer rate of the modified Rt models to the base model Rt1, divided by the pressure difference of the modified Rt models to the base model Rt1. A greater EEC than 1 indicates an improvement in thermal-hydraulic performance relative to the Rt1 model. Figure 12 shows that the Rt2 model exhibits high heat transfer gains with an EEC (1 to 1.03), ensuring a reasonably low-pressure drop, while the Rt6 model exhibits the lowest EEC values.
Figure 12. The relation between the heat flux and the EEC
8.2 Validation
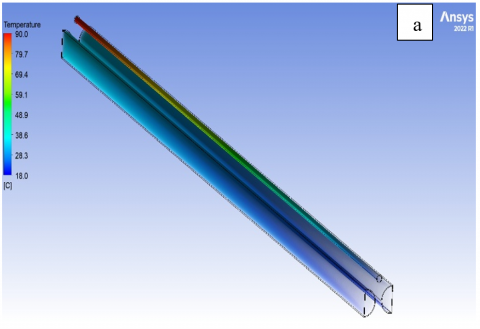
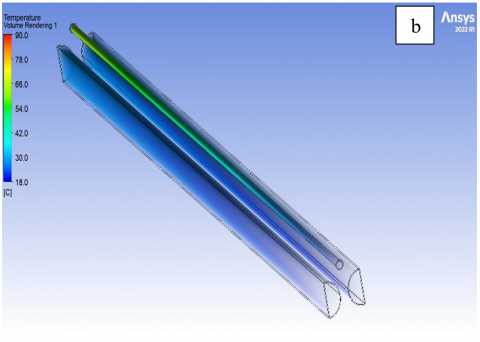
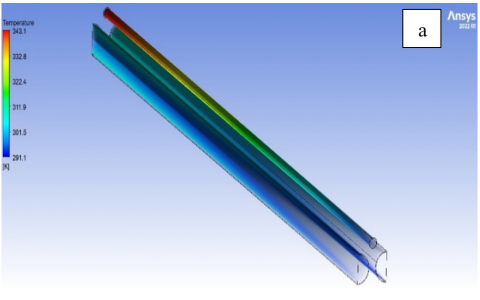
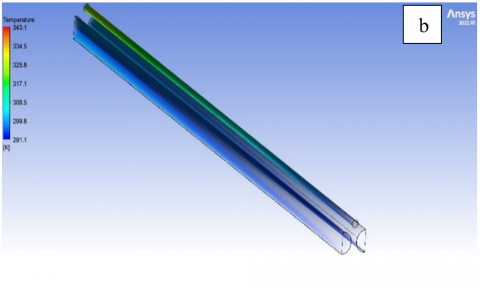
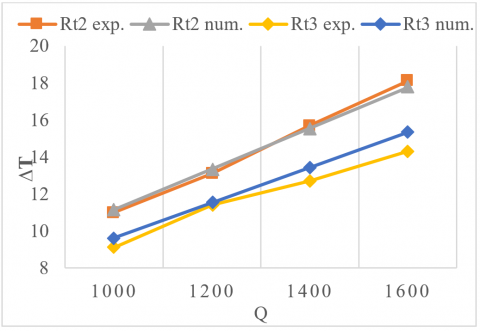
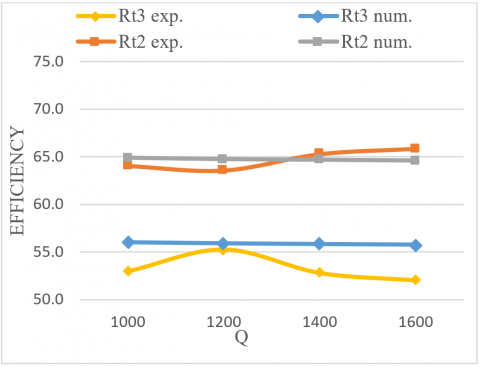
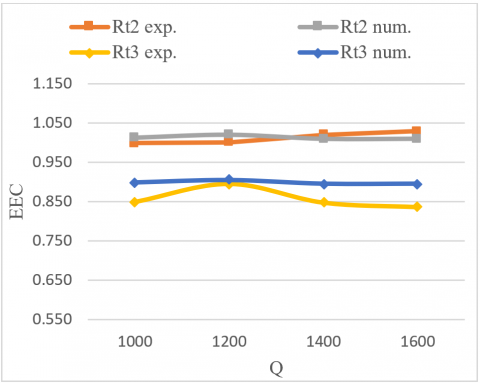
To validate the experimental findings, two receiver tube models, Rt2 and Rt3, were selected because of their significant temperature differential. The models were created with SolidWorks 2023 and simulated with ANSYS FLUENT 2022 R1. The properties in experimental tests and CFD simulations were suggested to be identical. A notable convergence was seen between the numerical simulations and experimental results, with a maximum error of 7.2%. Figures 13 and 14 show the numerical results for temperature distribution along Rt2 and Rt3 at 1600 w/m² and 1000 w/m², while Figures 15, 16, and 17 show the comparison between the CFD outcomes and the experimental results for Rt2 and Rt3 models.
Figure 13. Numerical results for temperature distribution along Rt2 model a) at 1600 w/m2 b) at 1000 w/m2
Figure 14. Numerical results for temperature distribution along Rt3 model a) at 1600 w/m2 b) at 1000 w/m2
Figure 15. Comparison between the experimental and the CFD outcomes of ∆T
Figure 16. Comparison between the experimental and the CFD outcomes of thermal efficiency
Figure 17. Comparison between the experimental and the CFD outcomes of EEC
|
Aa |
Aperture area, m2 |
|
Awo |
Receiver model tubes outer surface area, m2 |
|
Awi |
Receiver model tubes inner surface area, m2 |
|
Do |
Outer diameter of the receiver model tubes, m |
|
Di |
Inner diameter of the receiver model tubes, m |
|
Dho |
Outer hydraulic diameter of the receiver model tubes, m |
|
Dhi |
Inner hydraulic diameter of the receiver model tubes, m |
|
Uwo |
Outside overall heat transfer coefficient, W/m2℃ |
|
kw |
Thermal conductivity of the model pipes material, W/m℃ |
|
hwi |
Heat transfer convection coefficient, W/m2℃ |
|
Qu |
Useful heat transfer rate, which transferred to HTF from receiver model, kW |
|
Qs |
Supplied heat transfer from heater, kW |
|
$\dot{\mathrm{m}}_{\mathrm{HTF}}$ |
Mass flow rate of the heat transfer fluid, kg/s |
|
u |
Velocity component in X-direction, m/s |
|
$\Delta P$ |
Pressure difference, mbar |
|
l |
Pipes length, m |
|
$\rho$ |
Density, kg/m3 |
|
µ |
Dynamic viscosity, pa‧s |
|
Cp |
specific heat, J‧kg-1‧K-1 |
|
Nu |
average Nusselt number |
|
Greek symbols |
|
|
$\beta$ |
thermal expansion coefficient, K-1 |
|
θ |
Title angle (⁰) |
|
Abbreviations |
|
|
TSWHS |
thermosyphon solar water heating system |
|
RT |
receiver tube |
|
HTF |
heat transfer fluid |
[1] Aldulaimi, R.A.K.M., Ridha, H.D. (2025). Energy, exergy and thermoeconomic analysis of heat and power cogeneration system in Iraq: An experimental study. Journal of Advanced Research in Fluid Mechanics and Thermal Sciences, 133(1): 196-215. https://doi.org/10.37934/arfmts.133.1.196215
[2] Talib, S.S.A., Al Dulaimi, R.K.M. (2024). Thermal performance optimization of helically baffled conical cavity receivers for solar dish concentrators. International Journal of Heat and Technology, 42(5): 1744-1760. https://doi.org/10.18280/ijht.420529
[3] Moshab, A.A., Aldulaimi, R.K.M. (2024). Thermal performance analysis of thermosyphon solar water heating system using overlapped and reverse flow. International Journal of Heat and Technology, 42(2): 593-602. https://doi.org/10.18280/ijht.420226
[4] Bhowmik, H., Amin, R. (2017). Efficiency improvement of flat plate solar collector using reflector. Energy Reports, 3: 119-123. https://doi.org/10.1016/j.egyr.2017.08.002
[5] Jaisankar, S., Radhakrishnan, T.K., Sheeba, K.N. (2011). Experimental studies on heat transfer and thermal performance characteristics of thermosyphon solar water heating system with helical and Left–Right twisted tapes. Energy Conversion and Management, 52(5): 2048-2055. https:/doi.org/10.1016/j.enconman.2010.11.024
[6] Ananth, J., Jaisankar, S. (2013). Investigation on heat transfer and friction factor characteristics of thermosiphon solar water heating system with left-right twist regularly spaced with rod and spacer. Energy, 65: 357-363. https://doi.org/10.1016/j.energy.2013.12.001
[7] Jaisankar, S., Radhakrishnan, T.K., Sheeba, K.N., Suresh, S. (2009). Experimental investigation of heat transfer and friction factor characteristics of thermosyphon solar water heater system fitted with spacer at the trailing edge of Left–Right twisted tapes. Energy Conversion and Management, 50(10): 2638-2649. https://doi.org/10.1016/j.enconman.2009.06.019
[8] Saravanan, A., Senthilkumaar, J.S., Jaisankar, S. (2015). Experimental studies on heat transfer and friction factor characteristics of twist inserted V-trough thermosyphon solar water heating system. Energy, 112: 642-654. http://doi.org/10.1016/j.energy.2016.06.103
[9] Huang, J., Pu, S., Gao, W., Que, Y. (2010). Experimental investigation on thermal performance of thermosyphon flat-plate solar water heater with a mantle heat exchanger. Experimental study. Energy, 35(9): 3563-3568. https://doi.org/10.1016/j.energy.2010.04.028
[10] He, Y., Yua, H., Duan, G., Wang, Y., Yang, Q., Feng, L., Zhang, J. (2024). Thermal performance and experimental analysis of stainless-steel flat plate solar collector with full-flow channels. Heliyon, 10(7): e28255. https://doi.org/10.1016/j.heliyon.2024.e28255
[11] Wenceslas, K.Y., Ghislain, T. (2017). Experimental validation of exergy optimization of a flat-plate solar collector in a thermosyphon solar water heater: Experimental study. Arabian Journal for Science and Engineering, 44: 2535-2549. https://doi.org/10.1007/s13369-018-3227-x
[12] Freegah, B., Alkhafaji, M.H., Alhamdo, M.H. (2024). Study the thermal response of a solar flat-plate collector under transient solar radiation experimentally and numerically. Journal of Engineering Research, 13(2): 898-908. https://doi.org/10.1016/j.jer.2024.03.004
[13] Amraoui, M.A. (2021). Three-dimensional numerical simulation of a flat plate solar collector with double paths. International Journal of Heat and Technology, 39(4): 1087-1096. https://doi.org/10.18280/ijht.390406
[14] Shivanayak, L., S., G.S., Srikantamurthy, J.S., Thirumaleswara Naik, R., Durga Prasad, C., Hailu, N. (2025). Evaluation of a solar flat plate collector’s performance using wavy riser tubes and coil inserts. International Journal of Thermofluids, 29: 101378. https://doi.org/10.1016/j.ijft.2025.101378
[15] Himel, M.S.B., Hasan, M., Ali, M.H., Pratik, N.A., Islam, M.A.U., Tanvir, F., Anwar, A., Alam, M.J. (2025). Experimental performance investigation on the effect of step change in absorber plate thickness of flat plate solar collector. Next Sustainability, 6: 100142. https://doi.org/10.1016/j.nxsust.2025.100142
[16] Islam, R., Pratik, N.A., Lubaba, N., Miyara, A. (2023). Numerical analysis of a flat plate collector using different types of parallel tube geometry. AIP Advances, 13(10): 105313. https://doi.org/10.1063/5.0159916
[17] Hassan, K.A., Al Dulaimi, R.K.M. (2022). Thermal performance analysis of thermosyphon solar water heating system fitted with a spiral tube. Mathematical Statistician and Engineering Applications, 71(4): 6086-6097. https://doi.org/10.17762/msea.v71i4.1206
[18] Ananth, J., Jaisankar, S. (2013). Experimental studies on heat transfer and friction factor characteristics of thermosyphon solar water heating system fitted with regularly spaced twisted tape with rod and spacer. Energy Conversion and Management, 73: 207-213. https://doi.org/10.1016/j.enconman.2013.04.022
[19] Rodríguez-Sánchez, M.R., Sánchez-González, A., Marugán-Cruz, C., Santana, D. (2014). New designs of molten-salt tubular-receiver for solar power tower. Energy Procedia, 49: 504-513. https://doi.org/10.1016/j.egypro.2014.03.054
[20] Rodríguez-Sanchez, M.R., Marugan-Cruz, C., Acosta-Iborra, A., Santana, D. (2014). Comparison of simplified heat transfer models and CFD simulations for molten salt external receiver. Applied Thermal Engineering, 73(1): 993-1005. http://doi.org/10.1016/j.applthermaleng.2014.08.072