Khaleel Saleem Jebur Al-Ogaili*![]() | Amina Hmoud Alikhan
| Amina Hmoud Alikhan![]() | Hadi O. Mery
| Hadi O. Mery![]() | Andrew P. Wandel
| Andrew P. Wandel![]() | Karim Egab
| Karim Egab![]()
© 2025 The authors. This article is published by IIETA and is licensed under the CC BY 4.0 license (http://creativecommons.org/licenses/by/4.0/).
OPEN ACCESS
The paper examines the consequences of the misalignment between receiver tubes on the optical as well as thermal efficiency of a small parabolic trough solar collector (PTSC) under the influence of a numerical simulation. A prototype PTSC with a 0.84 m² aperture, 80° rim angle, and 11.4 concentration ratio was modelled. Optical performance was simulated by the Monte Carlo Ray Tracing (MCRT) method, whereas the heat transfer was simulated through the Finite Volume Method (FVM). The misalignments of the receiver tubes were investigated in the lateral (X) and vertical (Y) directions, at different percentages of half the height of the collector, 0–1%. Findings revealed that a 1 percent lateral misplacement of the moving elements decreased thermal efficiency by 1.4%, wherein the distribution of the heat flux was asymmetrical, along with overheating on the surface. On the contrary, a one percent vertical misalignment past the focal line also boosted efficiency by an estimated 1% because of a decreased amount of convective heat loss, but raised the probability of localized overheating. Misalignment of the vertical dimension, which was lower than the focal line, was found to cut efficiency by 1.5%. These results indicate that small PTSCs are vulnerable to receiver tube positioning and suggest that CSC systems have constraints on design, assembly, and service.
parabolic trough solar collector (PTSC), receiver tube misalignment, Monte Carlo Ray Tracing (MCRT), optical efficiency, thermal efficiency, heat flux distribution, concentrated solar power (CSP), heat transfer modelling
Growing energy demands, greenhouse gas emissions, and the environmental damage caused by burning fossil fuels have raised awareness of solar energy as a renewable energy source with numerous applications [1, 2]. The market for concentrated solar power (CSP) systems is expanding quickly, and the majority of its CSP capacity comes from parabolic trough solar collector systems (PTSC). PTSC technology was employed in solar thermal energy facilities over the first thirty years, accounting for approximately 96% of global solar electric capacity [3]. By the end of 2013, there were 1789 MW of commercial CSP plants operating worldwide, most of which used the PTSC technology [4].
The primary component of a PTSC system is the collector, which is a highly reflective mirror with a parabolically curved surface for collecting incoming solar light. The receiver tube, often referred to as the heat-collecting element (HCE), receives the reflected and condensed sunlight as it strikes the mirror. They are then transmitted into the heat transfer fluid (HTF) after being absorbed there as thermal energy. The receiver is constructed from a glass-enclosed and a metallic absorber tube. Extremely low vacuum pressure is used to evacuate the space between the tube and the glass cover in order to minimize convective heat loss from the receiver [5, 6]. The absorber tube is also meticulously coated to achieve minimum emittance of solar radiation and maximum absorption of incoming energy. The effectiveness of the overall PTSC system is substantially influenced by the system’s optical performance. Several factors influence the collector's optical performance, including its geometry, the materials used in its construction, and any faults that may have occurred during its design, manufacturing, or use [7]. The intercept factor may be influenced by the errors made. The intercept factor is the energy reflected by the concentrating collector divided by the energy intercepted by the receiver [7]. According to Pottler et al. [8], reaching an intercept factor of 96–99% required proper collector assembly and installation, high-quality components, and an acceptable collector design.
The deviation of the absorber tube's axis from the cylindrical parabola's focal line is known as the misalignment of the receiver tube. The different potential causes of absorber tube misalignment include: (i) improper assembly of the supporting frame of the absorber tube [9, 10], (ii) thermal stresses due to operating temperature variations [11-13], (iii) deformation in collector-supporting frame caused by gravity and wind load [13] and (iv) Because of the combined weight of the absorber tube and HTF, the absorber tube sags between the supports [11, 14-16]. Some analytical and experimental research on the performance of PTSCs with misaligned absorber tubes has been discussed in the literature, in order to evaluate collector efficiency while accounting for absorber tube misalignment. Treadwell [17] conducted an experimental study. The absorber tube misalignment range of 0 to 30 mm was investigated in a PTSC with a 2 m aperture width, a 90° rim angle, and a 25.4 mm receiver diameter. When the misalignment of the absorber tube reached 5 mm, the collector's efficiency dropped dramatically as a result. In order to predict PTSC yearly performance with the absorber tube misalignment, some researchers developed a computer model. This model demonstrated a 30% decrease in the PTSC annual performance [18].
The optical performance of the LS3 collector was examined in connection with tracking error and absorber tube misalignment [13]. The author found that the intercept factor dropped by around 45% after applying a novel OPTIC analytical method to investigate the impact of absorber tube displacement. The distribution of heat flux across the absorber tube is significantly impacted by absorber tube misalignment, and the local heat flux influences heat transfer in the HCE, changing the temperature gradients inside the absorber tube. The absorber tube's temperature fluctuation should be kept within design limits to avoid thermal stress damage to the HCE [19]. Khanna et al. [20] provided an analytical technique for determining the heat flux distribution across the absorber tube in the case of misalignment. The researchers found that the misalignment of the absorber tube had a significant impact on the distribution of heat flux over it. Zhao et al. [21] investigated the PTSC's optical performance when tracking errors and absorber tube misalignment were present. Their research revealed that absorber tube misalignment has a considerable impact on heat flux distribution across the absorber tube for a wide range of geometrical concentration ratios, tracking errors, and receiver misalignments.
The effects of temperature distributions and circumferential heat flux caused by the misalignment of the LS2 collector absorber tube were examined by Song et al. [22]. The local concentration ratio and circumferential temperature differential vary by 3.8 and 2.1, respectively, with a 25-mm vertical misalignment of the absorber tube. According to studies on the effects of thermal expansion and contraction on the absorber tube's alignment with the parabolic reflector's focal line, the solar power collector is lowered by 38% under typical operating circumstances [23]. According to Wu et al. [24] research, the absorber tube's highest deflection consistently happens near the centre of the tube, and that absorber tube deflection can be significantly increased by higher positive installation error in the y-direction (vertical direction) and lower slope error. Solar radiation is mostly focused on the receiver tube's bottom, which results in high temperatures, thermal stress, and tube deformation, claim Naveenkumar et al. [25]. The author proposed that turning the absorber tube at a specific frequency will help limit the greater surface temperature and improve energy absorption. The results of Agagna et al. [26] investigation demonstrated that little errors like receiver dislocation or tracking inaccuracy could significantly reduce optical and overall performance. About 50% less optical efficiency results from a tracking error of 16 mrad. The optical efficiency can be reduced by 60% and the overall efficiency can be reduced by up to 80% as a result of the parabola profile inaccuracy. The optical and total efficiencies can be reduced by around 37% and 49%, respectively, with a 0.05 m dislocation of the receiver.
Tian et al. [27] high thermal stress and tubular receiver deformation are common issues with classic PTSCs. In the PTSC, heat transmission and thermal stress are numerically simulated at various concentrations using a secondary reflector. The addition of SR considerably reduces the thermal load on the PTSC absorber tube. Rodriguez-Sanchez and Rosengarten [28] numerically investigated the impact of employing a secondary flat reflector (SFR) on PTSC optical efficiency. The concentration ratio rose to 16.41% after an SFR was added to this mirror, compared to just 3.5% for the shadow cast by the secondary mirror.
Temperature gradients in glass and absorber tubes, with or without receiver tube misalignment, in small trough collectors were not predicted by earlier research or models. In addition, most of the laboratory investigations and projects, which were mostly experimental in nature, did not address the relevance of issues such as receiver tube misalignment in small trough solar collectors. This study will numerically assess the optical and thermal performance of a tiny parabolic trough collector for a range of receiver tube misalignment values. This study could help researchers estimate the fluid temperature range and receiver tube surface temperatures of small PTSC under the influence of receiver tube deviations.
Because of its precision and simplicity, the Monte Carlo ray tracing (MCRT) methodology is the most widely used approach for examining the optical characteristics of CSP devices with geometrical defects [1, 21, 29-43]. As a result, the MCRT approach has been used for the optical analysis of PTSC with absorber tube misalignment; it provides a flexible and simple means of adjusting the collector's geometrical and optical parameters, and it has grown to be an important tool for concentrating solar system study [30, 36].
Cheng et al. [31] employed the MCRT and Finite Volume Method (FVM) to anticipate heat transport in HCE and found high agreement with Dudley et al. [44]. The heat transfer study of the PTSC system's HCE is most commonly performed using MCRT in conjunction with FVM [1, 30, 31, 34-38, 41, 45-48]. For thermal study of PTSC with absorber tube misalignment and for determining the actual heat flux distribution on the receiver's absorber tube, the MCRT in combination with the FVM technique was utilized. Variations in absorber tube position in both the optical and lateral directions are taken into account. This study used a rim angle of 80° and an aperture width of 1.2 m to model a tiny trough solar collector.
According to the work done on the literature review, the hypothesis of the research is that any slight misalignment of the receiver tube, especially in the lateral (X) and vertical (Y) directions, would have a considerable impact on optical concentration and the thermal performance of small-scale PTSCs. These impacts are direction-dependent, with lateral misalignment being highly likely to cause more thermal inefficiency as a result of the imbalance in the solar fluxes. In order to test this hypothesis, the following core research questions are answered:
1. What is the effect of lateral (X) and vertical (Y) misalignment of the receiver tube on the distribution of heat flux on the absorber surface?
2. What is the quantitative effect of these misalignments of the outward temperature of the heat exchange fluid (HTF) and the thermal efficiency?
3. What is the direction of misalignment that is more damaging to the system performance and structural safety, and why?
Using validated MCRT and FVM simulations to answer these questions, the study gives advice on how to design and perform the alignment tolerances and maintenance of the operational maintenance of small-scale systems that operate utilizing the PTSC system.
Motivation: Renewable Energy and the Role of CSP
Renewable energy technologies have become more popular in response to the escalating energy requirements of the world, climate change, and potential environmental degradation because of energy sources that use fossil fuels. One of these is the CSP systems, which provide an attractive solution in the generation of thermal and electric energy on a large scale. In CSP technologies, the PTSCs have always been the leading players in the industry, historically making up 96 per cent of all CdTe clients. A mature technology coupled with their high capacity to focus solar energy and scalability has rendered PTSCs the key building blocks to the solar thermal-powered generation in the world.
PTSC Overview
A standard PTSC comprises a parabolically curved reflector, which concentrates direct sunlight in a linear receiver tube, otherwise referred to as the Heat Collecting Element (HCE). To reduce the amount of heat loss through convection, this receiver has a metallic absorber tube sealed inside an evacuated glass envelope. High accuracy of optical positioning and structural accuracy is extremely sensitive to the overall efficiency of the system. Optical performance, with a major control by geometric precision, tracking accuracy, as well as alignment of the components, directly determines the heat transfer to the HTF passing to flow inside the absorber tube.
Gap: Misalignment in Receiver Tubes for Small PTSCs
Despite substantial research on PTSCs, misalignment of receiver tubes—especially in small-scale systems—remains an underexplored factor. Misalignment may arise from manufacturing errors, thermal expansion, mechanical sagging, or support frame deformation. Prior experimental and analytical studies have primarily focused on large-scale collectors, with limited attention to how minor deviations in small PTSCs impact heat flux uniformity and thermal performance. Moreover, most existing studies overlook the thermal stress effects and localized overheating caused by such deviations, which are more pronounced in compact systems with limited thermal inertia.
Objective and Novelty of the Study
This paper seeks to quantitatively explore the way horizontal (X-axis) and vertical (Y-axis) offsets of the receiver tube can influence the optical and thermal performance of a small PTSC unit. MCRT and FVM are applied in the research to do the optical and heat transfer simulations, respectively. The novelty lies in:
• Specific attention to small-scale PTSCs, in which the tolerance to alignment is increased.
• Measurement of the sensitivity of the thermal efficiency to sub-centimetre misalignments.
• Giving information on overheating areas as well as thermal stress hazards caused by misalignment.
• It not only proved the fact that vertical misalignment could contribute to efficiency in some cases because of a decrease in convective losses, which is an unexpected but very useful finding in future design.
It helped to fill this research gap; therefore, the study provides valuable advice to the design, assembly, and maintenance of small PTSC systems, which might guarantee more effective operations and increased service duration.
In this study, a numerical model is applied with a two-part approach to examine the impact of receiving tube misalignment on the optical and thermal performance of a small parabolic trough solar collector (PTSC). These models consist of both the optical ray tracing and thermal-fluid simulations. The prototype of a small-scale PTSC was based on the real experimental design. The aperture of the collector is 0.7 m, length 1.2 m, and rim angle of 80°, giving a geometric concentration ratio of 11.4. The receiver is made up of a tube of copper lid engulfed in a glass cover of borosilicate material in a vacuum.
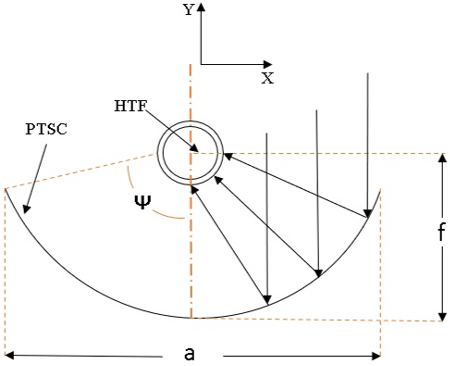
Figure 1. 2D PTSC schematic
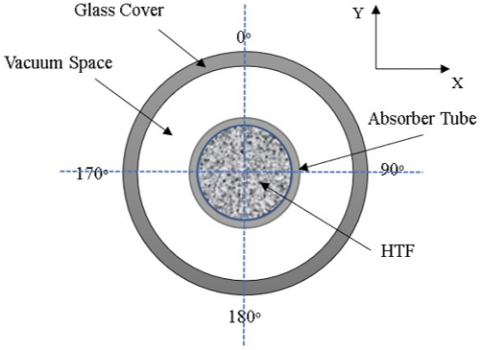
In Figure 1, the PTSC's two-dimensional geometry is shown. The HCE and a parabolic concentrator are its two primary parts, as illustrated. The HCE is where the concentrator, which reflects the solar radiation onto it, delivers thermal energy to the HTF. Figure 2 displays a cross-sectional view of the HCE. In order to reduce convective heat loss to the atmosphere, Essentially, it essentially consists of an evacuated glass tube and a metal absorber tube put inside. Table 1 contains a list of the experimental PTSC's properties that were taken into consideration for this numerical investigation.
Figure 2. 2D HCE view cross section
Table 1. The numerical PTSC model's geometrical values (based on the dimensions of the PTSC experimental prototype)
|
Parameter |
Symbol |
Value |
|
The aperture's length |
L |
1.2 m |
|
The aperture's width |
A |
0.7 m |
|
Focal length |
F |
0.208 m |
|
Rim angle |
ᴪ |
80° |
|
The inner absorber's diameter |
din |
0.01701 m |
|
The outer absorber's diameter |
dout |
0.01905 m |
|
The inner glass cover's diameter |
Din |
0.056 m |
|
The outer glass cover's diameter |
Dout |
0.06 m |
|
Reflector |
- |
Super Mirror Stainless Steel (316 grade) |
|
Absorber tube material |
- |
Copper |
|
Glass material |
- |
Borosilicate |
|
Heat transfer fluid |
- |
Water |
|
Concentrating ratio |
- |
11.4 |
|
Insulation material |
- |
Glass wool |
|
insulation's conductivity |
- |
0.04 W/m‧K |
The parabola's equation provides a definition for the collector's geometry as:
$x^2=4 f y$ (1)
where, x represents the lateral direction, y represents the optical axis, and f is the collector focal length. Both the rim angle and the aperture width affect the focal length.
$F=\frac{a}{4 \tan \left(\frac{\theta r}{2}\right)}$ (2)
The aperture width is denoted by a, the focal length by f, and the collector rim angle by θr. For any two parameters, Eq. (1) and Eq. (2) describe the collector's geometry in detail. In this study, the geometrical concentration ratio (CR) was used to connect the projected areas of the collector and absorber tube, as shown in Eq. (3).
$C_R=\frac{A_a}{A_r}=\frac{a \times L}{d_{r o} \times L}$ (3)
L is the length of the collector aperture, dro is the absorber tube's outer diameter, and Aa and Ar are the projected areas of the collector and absorber tube, respectively.
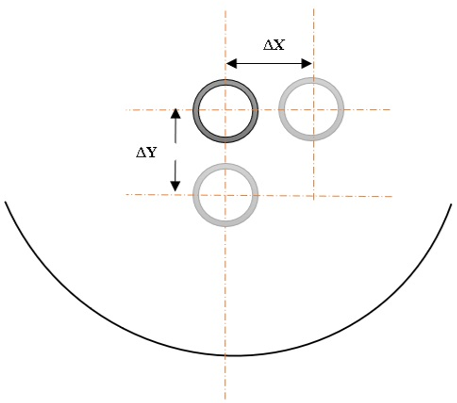
Figure 3 shows the absorber tube's misalignment with respect to the optical axis (y) and lateral direction (x).
A range of x from 0 to 15 mm is taken into consideration in the current investigation, while a range of -15 to +15 mm is used for y. The x and y displacements are, in fact, not constant along the pipe's length. Because of the symmetry of the trough around the optical axis, the misalignment of the absorber tube in the negative x direction (x < 0) was disregarded. As a result, the intercept factor and collector efficiency would be affected by the same amount in both directions (x < 0 and x > 0) when the absorber tube was dislocated.
Figure 3. X and Y receiver tube misalignments
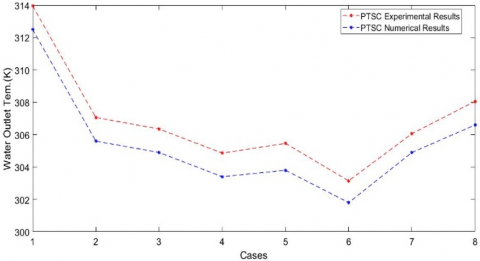
The optical performance of the PTSC system was analyzed using SolTrace software. The SolTrace application employs the MCRT approach for PTSC optical modelling, which delivers an average and dispersed heat flux over the absorber tube. The PTSC parameters specified in Table 1 were used to run the simulations. The linear parabolic surface's geometry was initially created using the parabolic surface generation tool at the origin in the SolTrace global coordinate system. The absorber tube and glass tube were then created so that their axes align with the parabolic surface's focus line by using the cylindrical surface tool. The absorber tube was positioned at various selected locations to duplicate the absorber tube's misalignment. In both the lateral and optical directions, the absorber tube was adjusted in a range of 0% to 1% of the collector half width to perform the simulations. As in Mwesigye et al. [37], for all simulations, the sun's form is represented as a Gaussian distribution with a direct normal irradiation of 1000 W/m2 and a cone angle of 2.6 mrad. The number of ray contacts and the maximum number of sunrays generated were set to 106 and 108, respectively, to achieve a precise heat flow profile. The outcomes of the analytical investigation were used to validate the results of the SolTrace program. Figure 4 shows a comparison. As can be observed, the findings of the current study closely align with those of Al-Ogaili [3] experimental work.
Figure 4. Comparing the CFD model's numerical results with the experimental findings of the PTSC heating system
FVM was used to analyse the heat transfer of the HCE. The following sections provide information on heat transfer analysis techniques and the resulting findings.
4.1 Governing equations
The heat transport of HCE was analysed using the Reynolds-averaged Navier-Stokes equations.
For mass, momentum, and energy conservation, the time-averaged turbulent flow equations are given by Eqs. (4) through (6) [37]. In the current investigation, turbulent flow was modelled using a Realizable k-eddy viscosity model that was taken into consideration in the research of Mwesigye et al. [37]. The model cannot be applied close to solid walls; hence, an improved wall treatment is employed in the wall sections. In this investigation, the non-dimensional distance (y+) was maintained for all simulations close to the solid wall below one.
Continuity Equation:
$\frac{\partial}{\partial \mathrm{x}_i}\left(\rho \bar{u}_i\right)=0$ (4)
Momentum Equation:
$\frac{\partial}{\partial \mathrm{x}_j}\left(\rho \bar{u}_i \bar{u}_j\right)=-\frac{\partial \overline{\mathrm{p}}}{\partial \mathrm{x}_i}+\frac{\partial}{\partial \mathrm{x}_j}\left[\begin{array}{c}\mu\left(\frac{\partial \overline{\mathrm{u}}_l}{\partial \mathrm{x}_j}+\frac{\partial \bar{u}_j}{\partial \mathrm{x}_i}-\delta_{i j} \frac{\partial \bar{u}_l}{\partial \mathrm{x}_l}\right) \\ -\rho \bar{u}_i \bar{u}_j\end{array}\right]$ (5)
Energy Equation:
$\frac{\partial}{\partial \mathrm{x}_j}\left(\rho \bar{u}_i C_p \bar{T}\right)=\frac{\partial}{\partial \mathrm{x}_j}\left[\frac{\partial \lambda \bar{T}}{\partial \mathrm{x}_j}+\frac{\mu_t}{p r_t} \frac{\partial C_p \bar{T}}{\partial \mathrm{x}_j}+u_i\left(\mu\left(\frac{\partial \bar{u}_{\imath}}{\partial \mathrm{x}_j}+\frac{\partial \bar{u}_{\jmath}}{\partial \mathrm{x}_i}-\frac{2}{3} \delta_{i j} \frac{\partial \bar{u}_l}{\partial \mathrm{x}_l}-\rho \bar{u}_i \bar{u}_j\right)\right)\right]$ (6)
HCE's radiation heat transport in vacuum space has been modelled using a discrete ordinates radiation model, assuming a perfect vacuum and ignoring heat transfer via conduction and convection. The full-field solving approach is used to compute the temperature distribution, and heat conduction in the absorber tube is taken into account. Stainless steel is used to make the absorber tube, and 54 W/(m·K) is assumed to be the material's thermal conductivity [36]. By default, steady-state flow conditions were used for all simulations. According to Cheng et al. [30], Eq. (7) through Eq. (9) give the characteristics of HTF (Syltherm 800), which are considered to be polynomial functions of temperature.
4.2 Boundary conditions
In the heat transfer analysis, the following boundary conditions were used:
(i) HTF inlet: inlet mass flow rate ($\dot{\mathrm{m}}$) = 0.06 kg/s.
(ii) Inlet fluid's temperature (Tin) = 300 K.
(iii) HTF outlet: Fully developed flow.
(iv) At z = 1.2 m and z = 0, the end surfaces of the glass tube, absorber tube, and annular space are all adiabatic.
(v) SolTrace was used to determine the heat flux distribution on the absorber tube's outer surface. The emissivity of the absorber tube is computed using Eq. (7) [44, 49].
$\varepsilon_{a o}=-0.065971+0.000327 T_{a o}$ (7)
(vi) The absorber tube's interior surface: no slip.
(vii) outside surface of a glass tube: convection and radiation.
The Stefan-Boltzmann formula, which requires that the sky be a massive enclosure, is used to compute the radiative heat loss to the sky.
To calculate the actual temperature of the sky, Eq. (8) is used [34, 36].
$T_{s k y}=0.0552 T_a^{1.5}$ (8)
According to Ghomrassi et al. [34], the heat transfer coefficient was calculated using Eq. (9).
$h=4 u_w^{0.58} D_{ {out }}^{-0.42}$ (9)
Utilizing the heat transfer coefficient found by Eq. (9), calculate the convective heat loss from the glass tube. It is assumed that the temperature is 300 K and that the wind speed is 2 m/s.
4.3 Numerical simulation
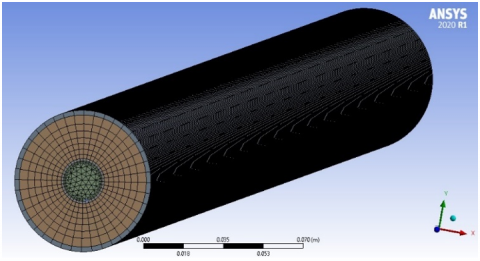
Figure 5 and Figure 6 show the creation of an HCE mesh with FVM to model heat transmission in HCE. A structured mesh of hexahedral components was created to improve accuracy and speed of convergence.
In order to achieve more stability and faster convergence, the velocity and pressure fields have been coupled using a pressure-based coupled algorithm. Second-order upwind is used to discretise the momentum and energy equations, and the PRESTO method is used to discretise the pressure equations. A first-order upwind technique has been used to calculate turbulent kinetic energy, turbulent dissipation, and discrete ordinates. All simulations used a scaled residual convergence condition of less than 106.
Figure 5. 2D mesh of HCE
Figure 6. 3D mesh of HCE
A mesh-independent test using absorber tubes with diameters of 19.05mm was carried out for the HCE. It has been determined that the best meshes for 19.05 mm have 64 (angular), × 66 (radial), × 330 (axial) hexahedral cells. Results from an experiment by Al-Ogaili [3] and Dudley et al. [44] are used to validate the findings of the current study. Table 2 presents the findings of the HCE test's independence mesh numerical model, which tested the number of mesh elements and the anticipated usable heat gain of the receiver tubes.
Table 2. The expected useful heat gain of the receiver tubes and the number of mesh elements
|
Case |
Mesh Elements |
Useful Heat (W) |
|
1 |
469601 |
885.54 |
|
2 |
469801 |
883.59 |
|
3 |
476125 |
893.57 |
|
4 |
477832 |
893.61 |
|
5 |
502299 |
893.61 |
5.1 Heat flux distribution
Numerical analysis has been performed on the heat flux distribution on the receiving tube in both the normal (non-receiver misalignment) and the X and Y receiver tube misalignment situations for a small PTSC with a concentrating ratio of 11.4 and a rim angle of 80°. In all cases, incident sunrays and reflected solar rays were assumed to be ideal.
5.1.1 X-misalignments
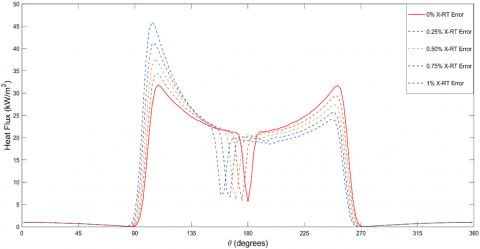
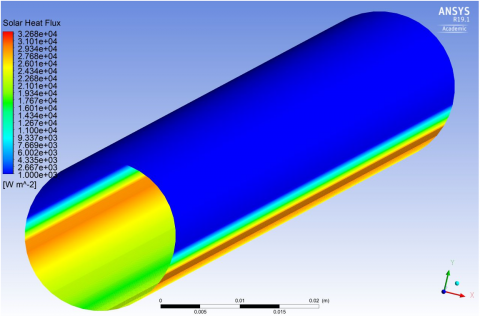
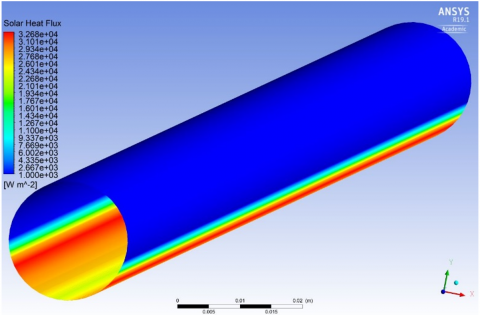
The distribution of reflected solar radiation on the absorber tube's outside diameter is shown in Figure 7. The figure shows the average heat flux for average heat flux for various receiver X-misalignment cases as well as the ideal case (no receiver tube misalignments). The X-misalignment values are 0%, 0.25%, 0.5%, 0.75%, and 1% of the collector half width. Due to the absence of receiver misalignments, the graphic demonstrates (read colour) that the distribution of solar rays on the absorber tube for the ideal situation is symmetrical. This result showed that the reflected solar heat flux is distributed symmetrically over the outside surface of the collector absorber tube, as revealed in Figure 8.
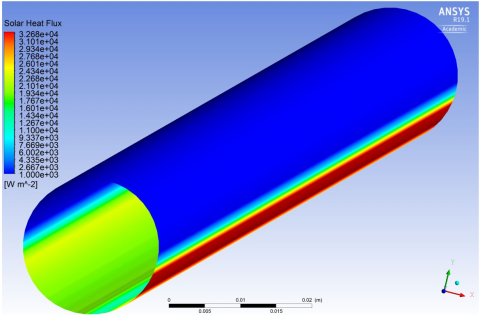
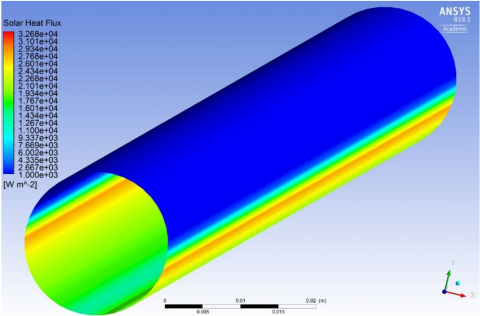
Figure 7 further demonstrates that when the X-misalignment value reached 1%, the non-symmetrical distribution of the reflected rays likewise rose rapidly and reached its maximum non-symmetrical profile. The reason for this could be that the reflected rays of the sun concentrate more and more on the opposite side of the absorber tube while diverging less from one side of the absorber surface. Figure 9 illustrates how the X-misalignments contribute significantly to the surface of the absorber tube warming. HTF oil leakage and component cracking could result from this.
Figure 7. The average flux distribution of incident sun rays (1000 W‧m2) around the absorber tube circumference with absorber horizontal misalignments
Figure 8. The distribution of the solar heat flux for the ideal situation (i.e., no receiver misalignments) is presented fluidly on the collector absorber tube
Figure 9. The distribution of solar heat flux on the collector absorber tube with 1% X-directional receiver tube misalignment
5.1.2 Y-Direction misalignments: Heat flux distribution
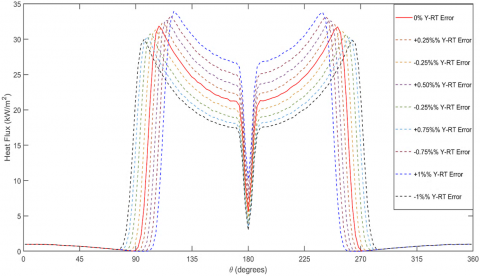
With an isolation of 1000 W/m² and under varying receiver tube misalignment above and down the reflector focal line, Figure 10 displays the distribution of the average solar heat flux from reflected solar radiation over the absorber tube's diameter. The receiver tube vertical misalignments are from 0% to 1% of the value of the reflector focal distance. It can be seen from this figure that the distribution of the rays for the normal case (red colour), as mentioned before, is symmetrical on the absorber tube. This resulted in releasing asymmetrical solar heat flux distribution on the absorber tube surface, as shown in Figure 11 and Figure 12.
This asymmetric profile of the fluxes, however, leads to an increase in temperature gradient across the tube circumference. This amplifies thermal stress and takes the risk of structural deformation, also observed by Wu et al. [24], who revealed a great deal of absorber deflection around the centre owing to positive Y-misalignments. Quite the contrary, when the tube is moved below the focal line (-Y) as in Figure 12, the rays reflected get distributed over a wider area of the absorber surface. This causes reduced hummocks, higher heat, and lower hummocks, fewer hummocks, decreased thermal pressure, but also, in the process, augmented heat loss to temperature since a greater area is exposed. The results are also in line with the findings by Song et al. [22], who established that vertical misalignment enhances the circumferential heat flux non-uniformity, affecting the uniformity of the heat transfer in the HCE.
Figure 11 demonstrates that the receiver misalignment up or down the collector focal line has a significant impact on the heat flux distribution on the receiver. As can be seen from the figure that as the Y-misalignment increased (moved the absorber tube above the axis of the collector focal line), the reflected rays concentrated more and more on the lower part of the absorber tube surface. This makes the region of the concentrated solar heat flux become smaller and smaller as the Y-installation error increases more and more above the axis of the collector focal line. The figure also indicates that Y-misalignments resulted in an overheating region due to the concentrated reflected heat flux on the absorber tube's limited surface area. This could consequently produce absorber thermal stress and bend the absorber tube.
Figure 10. The average flux distribution of incident sun rays (1000 W‧m2) around the absorber tube circumference with absorber vertical misalignments
Figure 11. Fluent representation of the collector absorber tube's dispersion of solar heat flux for a 1% Y-misalignment (maximum receiver tube vertical misalignments above the focal line) receiver tube misalignments
Figure 12. Fluent representation of the distribution of solar heat flux on the collector absorber tube with a 1% Y-direction receiver tube misalignment (maximum receiver tube vertical misalignments lower the focal line)
Figure 12, however, also shows that the curves surrounding the absorber tube's outer diameter (concentrated rays) grew larger and larger as the collector receiver tube moved lower the focal line axis (in a negative direction). This led basically to make the area of the solar heat flux concentrating become larger and larger as the -Y misalignment increased more and more, as it is shown in Figure 12. Due to the concentrated heat flux's distribution over a greater absorber tube surface area. This phenomenon minimizes the effect of heat strain on the tube's surface. This results in decreased absorber surface temperatures and may, on the other hand, lead to increased receiver heat losses.
5.2 Receiver tube thermal performance
5.2.1 X-misalignment errors
As expected, the X receiver tube misalignments have a notable effect on the temperature’s distribution of the receiver tube domain. This is due to deviating the concentrated heat flux from striking the absorber tube at the designed place and concentrating on a small surface region, as is illustrated in Figure 9.
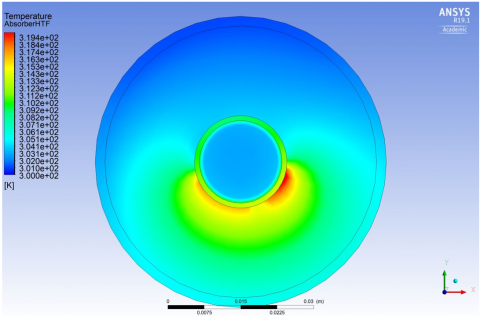
Figure 13. Receiver tube domain temperature distribution for the typical (optimal) case with a collector concentrating ratio of 11.14 and an insolation of 1000 W‧m-2
Figure 14. Depicts the temperature distribution of the receiver tube domain with a 1% displacement in the X axis (the greatest horizontal misalignment), an 11.14 collector concentrating ratio, and 1000 W‧m-2 insolation
Figure 13 displays the optimal temperature distribution in the receiver tube domain, while Figure 14 displays the optimal temperature distribution in the receiver tube domain with the greatest X-receiver tube misalignment. Both graphs (Figure 8 and Figure 13) show that the receiver solar heat flux distribution and receiver tube domain temperature distribution are identical. So, in the normal case, the temperature distribution is symmetrical. While for the X-misalignment situation, its surface is hotter at one receiver side and comparatively colder at the other receiver tube side, as shown in Figure 14.
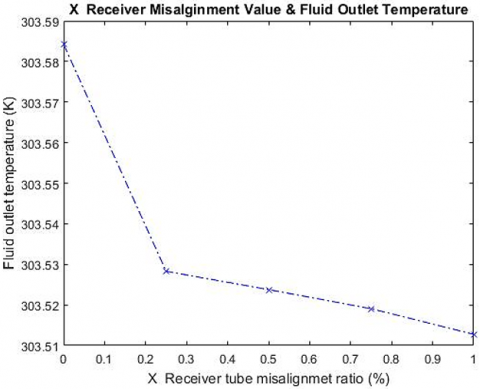
Figure 15. Heat transfer fluid outlet temperature for the variation of X- receiver tube misalignments at constant temperatures for the ambient and HTF inlets (300 K), constant solar radiation (1000 W/m2), and a constant volume of flow rate of water (0.06 L/s-1)
Figure 15 displays the PTSC receiver tube's HTF outlet temperatures for X-misalignment ranges from 0% to 1% of the collector half-width, under constant HTF inlet temperatures of 300 K and receiver tube mass flow rates of 0.06 L/s. From the figure, it is obvious that the receiver X-misalignment has a significant impact on fluid outlet temperature. When the X-misalignment was low, the HTF outlet temperatures were higher; however, as receiver misalignment increased, these temperatures rapidly dropped. The increased deviation of reflected rays from striking the absorber surface could explain why the HTF outlet temperatures decreased as X-misalignment increased. This subsequently leads to a reduction in the amount of solar energy that the absorber surface can absorb, which lowers the amount of heat gain received by the HTF and lowers the outlet temperature.
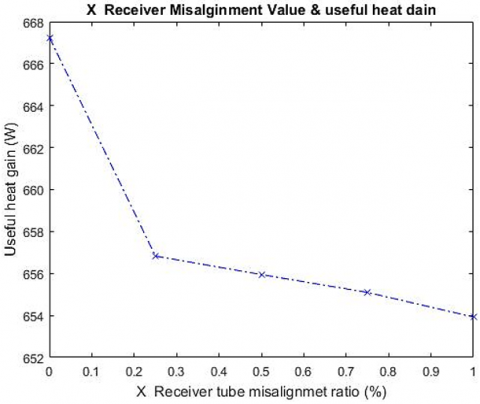
Figure 16. PTSC system useful heat gain for the variation of X- receiver tube misalignments at constant temperatures for the ambient and HTF inlets (300 K), constant solar radiation (1000 W/m2), and a constant volume of flow rate of water (0.06 L/s-1)
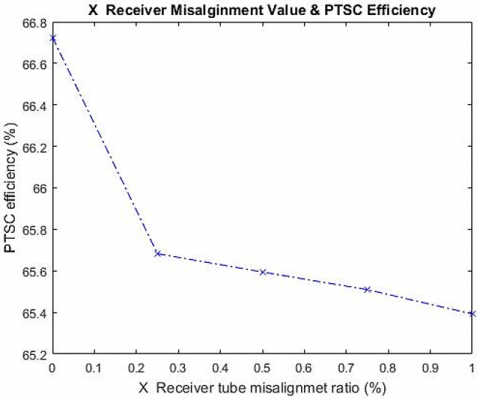
Figure 17. PTSC system thermal efficiency for the variation of X- receiver tube misalignments at constant temperatures for the ambient and HTF inlets (300 K), constant solar radiation (1000 W/m2), and a constant volume of flow rate of water (0.06 L/s-1)
As expected, as the X-errors grew, the useful heat gain dropped as a result of the lower HTF outlet temperatures Figure 16. The relationship between the X errors and collector efficiency is depicted in Figure 17. According to this graph, when the X-misalignment increased from 0% to 1%, the efficiency decreased from 66.7 (the perfect condition) to roughly 65.4. This shows that the X-error, even with tiny X variations, has a considerable impact on the PTSC performance. In addition, as previously mentioned, the X-misalignments created an overheated zone on the absorber surface area (Figure 9), which might have resulted in significant absorber thermal stress, which would have destroyed the absorber tube and lost the HTF oil.
5.2.2 Y-misalignment errors
As mentioned before that the effect of receiver misalignment in the up and down PTSC focal line affected heat flux distribution. Figure 18 shows the temperature distribution of the receiver tube domain for the normal case.
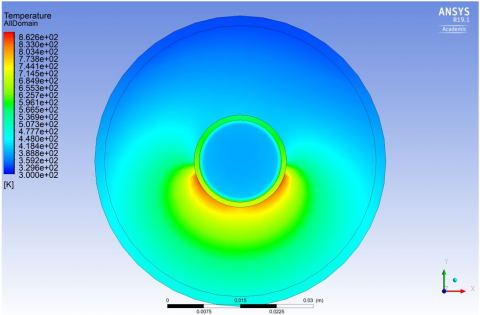
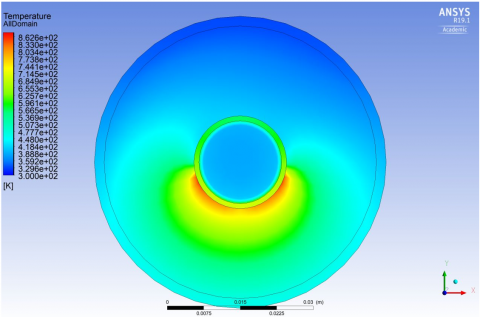
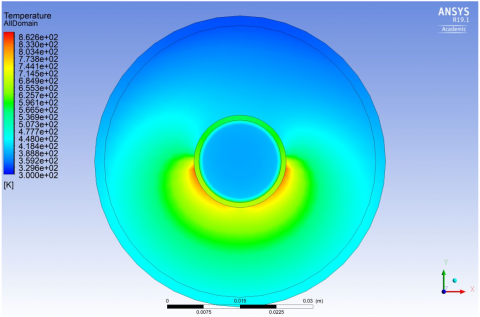
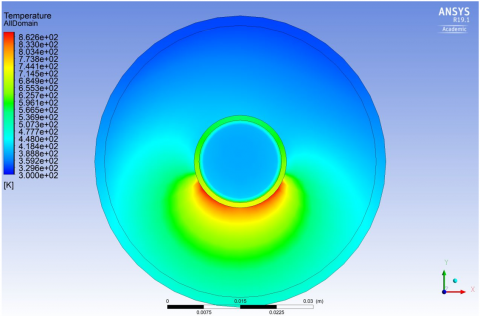
Figure 19 displays the receiver tube domains' temperature distribution at the largest vertical misalignments that reduce the collector focal line (-Y). The receiving tube's temperature distribution domains for the maximum receiver tube misalignments that are above the collector focal line (+Y) are shown in Figure 20. It is clear that the profiles of the temperature domain distributions for the Y-misalignment cases are comparable to the heat flux distribution cases, as demonstrated by the distribution profiles of solar heat flux trend in Figure 11 and Figure 12.
It is clear from the domain temperature distributions that the hot region for the case of -Y receiver misalignment is noticeably lower than for the +Y case. This is because, in this instance, the receiver moved lower on the collection focal line, distributing the heat flux over a greater surface area of the absorber tube. As a result, the domain temperature was decreased. It is clear that the hot zone in the case of +Y misalignments is higher than it is in the case of -Y. This is because when the receiver raises above the focal line, the solar heat flux that is reflected focuses on a smaller region, which raises the temperature of that absorber's domain.
Figure 18. Receiver tube domain temperature distribution for the typical (optimal) case with a collector concentrating ratio of 11.14 and an insolation of 1000 W‧m-2
Figure 19. Temperature distribution of receiver tube domain for the1% receiver tube misalignment in -Y direction (maximum receiver tube misalignments lower the focal line) under insolation of 1000 W‧m-2 and collector concentrating ratio 11.14
Figure 20. Temperature distribution of receiver tube domain for the1% receiver tube misalignment in +Y direction (maximum receiver tube misalignments above the focal line) under isolation of 1000 W‧m-2 and collector concentrating ratio 11.14
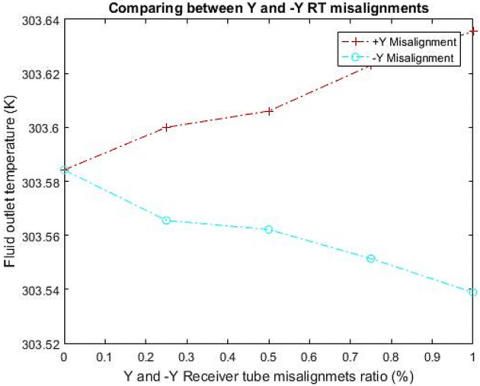
Figure 21 shows the output HTF temperatures for various Y receiver tube misalignments, above and below the collector focal line. It can be observed from the figure that the Y-misalignment affects the HTF outlet temperature. The HTF outlet temperatures (red line) increased as the Y-misalignments (which moved above the focal line) increased. For example, as the Y-misalignment varied from zero to one percent of the collector focal line distance, the temperature rose from 303.58 K to reach roughly 303.64 K. The increase in HTF outlet temperatures may be caused by the solar heat flux being concentrated on a smaller area of the absorber tube, which primarily reduces the amount of heat losses through convection heat transfer from the receiver tube to the environment. Thus, the absorber tube wall enhances convective heat transfer between the inner absorber surface and the HTF by permitting more concentrated solar energy to flow through. The HTF outlet temperatures eventually increased as a result of that.
On the other hand, the figure shows that when the receiver tube proceeded down the collection focal line (the optimum case) to reach around -1% of the focal distance, the outlet temperatures decreased from 303.58 K to reach around 303.54 K. This might be the consequence of the solar heat flow in this case being concentrated on the absorber tube's larger surface area. Thus, the absorber tube's exposed hot surface area increases, causing the receiver tube's heat loss to the outside world to increase.
Figure 21. Heat transfer fluid outlet temperature for the variation of +Y and -Y receiver tube misalignments at constant temperatures for the ambient and HTF inlets (300 K), constant solar radiation (1000 W/m2), and a constant volume of flow rate of water (0.06 L/s-1)
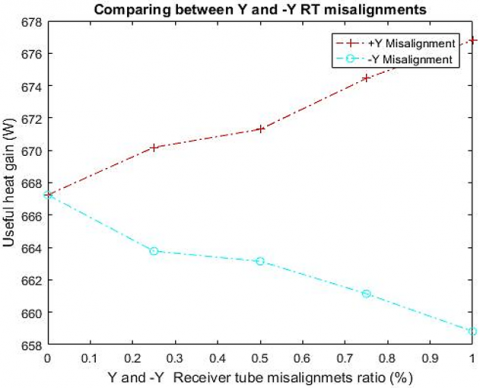
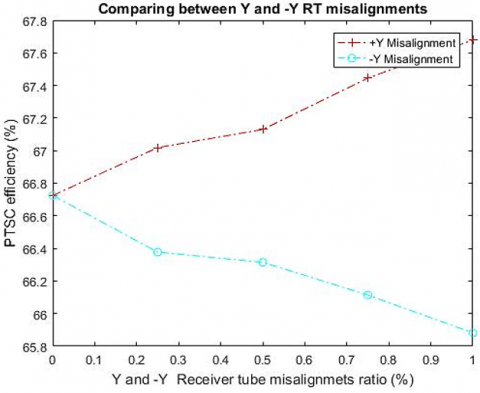
As would be expected, the usable heat gain trended upward and downward with the outlet HTF temperature trend Figure 22. As the Y-misalignment of the receiver tube grew (+Y) and dropped (-Y), it directly impacted PTSC efficiency. The thermal efficiency of the PTSC is shown in Figure 23. It shows the collector receiver tubes with +Y and -Y misalignments above and below the collector focal line. This figure illustrates that when the Y-misalignment probability grew from zero (the ideal case) to approach 1% of the half collector width above the focal line, the collector efficiency increased from 66.8% (the ideal case) to reach around 67.7%. However, the thermal efficiency of the collector decreased as the receiver tube moved down from the collector focal line (following the same behaviour of the HTF outlet temperatures). When the receiver tube was shifted 1% down the focal line, it decreased from 66.8% to roughly 65.8%. As a result, it is clear that the +Y has a positive effect on the PTSC's thermal performance, resulting in more heat gain. but the challenge with this situation is overheating (optical issue), as it was previously illustrated.
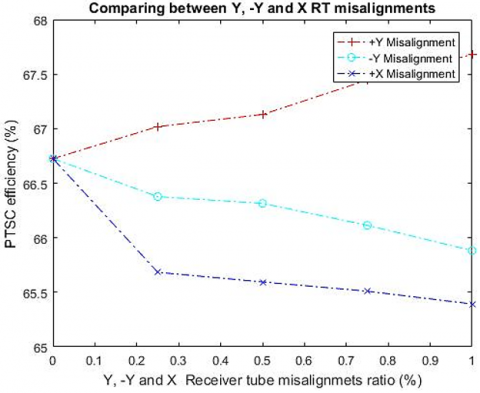
This section presents a comparison study for the PTSC thermal efficiencies under X and Y receiver tube misalignments. it presents the magnitude and compares the impact of these misalignments on the PTSC thermal performance, as shown in Figure 23. Two important conclusions can be drawn from this figure. First, it is obvious that the X-misalignment has a greater negative effect on the PTSC thermal performance than the plus or minus vertical receiver direction misalignments. Then it produced a higher overheating region than what the Y-misalignments caused. However, as mentioned before, the misalignment above the focal axis enhances PTSC efficiency, but it creates a small overheating surface area that could break the receiver.
As a result of this comparative study, it is important to pay attention to the X-receiver tube deviation during the stages of production, assembly, and operation.
Figure 22. PTSC system useful heat gain for the variation of +Y and -Y receiver tube misalignments at constant temperatures for the ambient and HTF inlets (300 K), constant solar radiation (1000 W/m2), and a constant volume of flow rate of water (0.06 L/s-1)
Figure 23. PTSC system thermal efficiency for the variation of X, +Y, and -Y receiver tube misalignments at constant temperatures for the ambient and HTF inlets (300 K), constant solar radiation (1000 W/m2), and a constant volume of flow rate of water (0.06 L/s-1)
Because of vertical misalignment above the focal point (Figure 24 +Y), there is a relatively low increase in thermal efficiency (less than 1 percent), but at the cost of increased risk of tube overheating. such self-defeating action can be attributed to decreased optical losses, which is confirmed by a higher heat transfer coefficient between the absorber wall and the HTF because the more the flux is localized, the higher the internal heat gain is, which is supported by Mwesigye et al. [37], who demonstrated that the enhancement of the local flux replenishes internal heat gain regardless of the higher surface temperatures.
Table 3. Comparison table
|
Study |
Scale |
Method |
Misalignment Range |
Reported Efficiency Loss |
This Work |
|
Treadwell (1976) [17] |
Large |
Experimental |
0–30 mm |
Up to 30% |
N/A |
|
Zhu (2013) [13] |
Large |
Optical model |
0–25 mm |
45% Optical drop |
N/A |
|
Al-Ogaili (2019) [3] |
Small |
Experimental |
0–10 mm |
1.5% Thermal loss |
Matches 1.4% |
|
This Study |
Small |
MCRT + FVM |
0–15 mm |
±1.5% |
Validated |
Figure 24. PTSC system thermal efficiency for the variation of +Y and -Y receiver tube misalignments at constant temperatures for the ambient and HTF inlets (300 K), constant solar radiation (1000 W/m2), and a constant volume of flow rate of water (0.06 L/s-1)
On the other hand, misalignment of Y negatively alters the incoming radiation such that the hottest part moves to a broad region and reduces the hottest but enhances the convective heat loss owing to a larger area of hot base. This is a trade-off that causes a reduction in efficiency of about 1.0% caused by the lower average absorber surface temperatures and weaker internal convection.
Such effects of vertical misalignment demonstrate that excellent copies of the initial thermodynamic law: A gradual increase may positively shift performance through loss reduction of surfaces and fit in excess of performance capacities; and a gradual decrease can cut down on the quantity of energy harnessed through an unhappy curvature of the flux profile.
5.3 Validation and comparison with existing work
In order to determine the accuracy of the simulation framework, the findings of the current optical and thermal modelling were analysed with the existing literature regarding experimental and numerical works.
5.3.1 Optical validation
As shown in Figure 4, SolTrace ray tracing findings will be almost identical with the experimental findings presented by Al-Ogaili [3], indicating that the incident flux distribution along the receiver is consistent with small-scale PTSCs. In particular, the peak solar flux and circumferential symmetry at 0% misalignment indicate the values within the range of 5% deviation of the experimental values, which proves the optical boundary conditions and the representation of the sun shape.
5.3.2 Thermal validation
Table 2 suggests that useful heat gain was found to be in close relation with experimental data of Dudley et al. [44], with deviations less than 1.2% following a mesh independence refinement. In addition, the outlet HTF temperature distributions in X-misalignment are similar to the results provided by Cheng et al. [30], who also found that the inefficiency of lateral misalignment was mainly due to heat flux disproportion and disequilibrium conduction paths.
5.3.3 Misalignment effects comparison
Previous large-scale research, like Treadwell [17] and Zhu [13], was concerned with large-scale PTSCs, with a 30 mm receiver error being able to result in a 30–50% reduction in optical efficiency. Our small-scale model, on the contrary, covers finer ranges of misalignment (0–15 mm) and shows variation in efficiency going within ±1.5% which is more reflective of the real-world lab-scale prototypes. Instead of seeing the high level of deviation, as was previously inaccessible, this is novel in that it implements MCRT + FVM coupling on these small deviations, providing a more granular view of that deviation (see Table 3).
This study examines the effects of both horizontal and vertical receiver tube misalignment on the optical and thermal performance of a small PTSC model. According to the findings, the absorber tube surface's distribution of solar heat flux was significantly impacted by horizontal receiver misalignments, and as these misalignments increased, the absorber surface overheated.
In addition, the results for the receiver's vertical misalignments demonstrated that misalignments above the collector focal line led to an overheating of the receiver tube's bottom surface. Furthermore, it was found that receiver misalignments under the collector focal line axis minimized the impact of the concentrating heat flux. Because of the way the reflected heat flux is distributed throughout the large absorber's surrounding surface. This could extend the absorber tube's operational life while decreasing maintenance and replacement expenses.
The thermal efficiency of the PTSC small model, on the other hand, significantly decreased as the horizontal receiver tube malalignment increased. As the receiver horizontal misalignments rise from 0% to 1% of the collector half-width, the PTSC thermal efficiency falls by about 1.4%. The main cause of this is that the horizontal misalignments prevent some of the solar energy that is reflected from reaching the absorber surface, which lowers the useful heat absorption. Furthermore, the thermal influence of the vertical misalignments - above the collector focal line- has enhanced the collector thermal performance. It is found that when receiver misalignments increased from 0% to 1%, the collector thermal efficiency improved by around 1%. This could be due to concentrating solar heat flow on a tiny absorber tube surface area, which decreased the convection heat loss. On the other hand, it was discovered that when the vertical misalignments were raised lower the focus line from 0% to 1%, the collector thermal efficiency decreased by about 0.8%. The absorber surface's zone of concentrated solar flux may have grown, and there may have been a considerable increase in convective heat loss between the receiver tube's surface and the surrounding air.
The main findings are:
1. These misalignments affect lateral (X-direction) movement. This caused a large thermal loss - as much as 1.4 percent at 1 percent tilt - through redistribution of the concentration of heat flux and local overheating of components, which may accelerate structural degradation.
2. Vertical misalignment (Y-direction) exhibited a bi-faceted response where +Y displacement increased efficiency by 1 per cent because it concentrated the energy in just a small area and reduced convective losses, whereas the -Y displacement decreased it by 1.5 per cent because the heat spread out and more heat was lost through the surface.
3. Rigid simulations were near experimental levels (within 5 percent), which proved that the model is reliable at predicting small-scale PTSC behaviour under geometric imperfections.
4. These results provide realistic advice in the production of tolerances, adjustment, and care of tiny-sized solar thermal systems, where even the slightest defect will influence operations and longevity.
Although the present research provides useful data on the impact of the stationary receiver tube misalignments on the optical and thermal performance of the small PTSCs, there are still several significant directions to be followed in the future:
1. Dynamism Misalignment Effects: This work was based on the assortment of immobile, even mispositioned. But in real practice, dynamic misalignments occur as a result of structural vibrations, different loads on the structure in the wind, long-term thermal expansion, and mechanical wear. The way forward is to include time-dependent receiver displacement modelling of receiver dynamic behaviour under operational and environmental loading, possibly with coupled fluid structure interaction (FSI) methods.
2. Field validation and experimental correlation and Field validation and experimental correlation: Although the numerical findings are confirmed using past experimental findings, on-site confirmation of the simulated misalignment effects is required to enhance practical applications. Future research ought to contain: The testing of the small prototypes of PTSC in the case of the experimentally varied receiver tube position. IR thermography or an array of temperature sensors to record the real-time distribution of heat flux. Monitoring of long-term performance in different operating and weather conditions.
3. Control Systems integration: Active tracker and alignment sensors are the possible adaptive control mechanisms that can be considered to correct alignment defects in real-time. The study can be improved in the future by determining how sensor feedback loops, which can be used to automatically control the position of the receiver and reduce loss of efficiency.
4. Material and Structural Optimization: Future research can also explore how new absorber tube materials can be used or how materials used as structural supports can be made lighter so that they are not subject to sagging and thermal deformation. Other technologies that could be used to enhance structural stability to misalignments include advanced composites and shape memory alloys.
5. Long Geometric and Optical Arrangements: Real-life complexities could be further modelled by expanding the domain of simulation to non-uniform or segmented misalignments, non-circular cross-sections, or multi-axis errors (pitch, yaw, and roll). Furthermore, testing of the misalignment can be reduced by investigating secondary concentrators or altered shapes of the reflector.
6. Life Analysis Thermal Stress and Fatigue: Due to the misalignment causing local overheating, additional effort is required to determine the accumulation of thermal stress, material fatigue, and lifetime expectations of the absorber tube during the change of cycle loads and temperature gradients.
7. Lifecycle Analysis and Economic Analysis: Finally, the economic analysis of misalignment tolerances and the costs of maintenance and performance penalties, and system lifetime would provide valuable actionable information in commercial implementation, especially in low-cost and small-scale CSP projects.
[1] Wu, Z.Y., Li, S.D., Yuan, G.F., Lei, D.Q., Wang, Z.F. (2014). Three-dimensional numerical study of heat transfer characteristics of parabolic trough receiver. Applied Energy, 113: 902-911. https://doi.org/10.1016/j.apenergy.2013.07.050
[2] Aider, Y., Singh, P. (2025). Experimental study on flow and thermal transport characteristics of moving packed bed through a channel featuring single column of inline cylindrical pins. International Journal of Heat and Mass Transfer, 236: 126286. https://doi.org/10.1016/j.ijheatmasstransfer.2024.126286
[3] Al-Ogaili, K.S.J. (2019). Optical and thermal optimisation of parabolic trough solar collectors for heating applications via a novel receiver tube. University of Southern Queensland.
[4] Binotti, M., Zhu, G., Gray, A., Manzolini, G., Silva, P. (2013). Geometric analysis of three-dimensional effects of parabolic trough collectors. Solar Energy, 88: 88-96. https://doi.org/10.1016/j.solener.2012.10.025
[5] Price, H., Lüpfert, E., Kearney, D., Zarza, E., Cohen, G., Gee, R., Mahoney, R. (2002). Advances in parabolic trough solar power technology. Journal of Solar Energy Engineering, 124(2): 109-125. https://doi.org/10.1115/1.1467922
[6] Kalogirou, S.A. (2004). Solar thermal collectors and applications. Progress in Energy and Combustion Science, 30(3): 231-295. https://doi.org/10.1016/j.pecs.2004.02.001
[7] Güven, H.M., Bannerot, R.B. (1986). Determination of error tolerances for the optical design of parabolic troughs for developing countries. Solar Energy, 36(6): 535-550. https://doi.org/10.1016/0038-092X(86)90018-6
[8] Pottler, K., Ulmer, S., Lüpfert, E., Landmann, M., Röger, M., Prahl, C. (2014). Ensuring performance by geometric quality control and specifications for parabolic trough solar fields. Energy Procedia, 49: 2170-2179. https://doi.org/10.1016/j.egypro.2014.03.230
[9] Geyer, M., Lüpfert, E., Osuna, R., Esteban, A., Schiel, W., Schweitzer, A., Zarza, E., Nava, P., Langenkamp, J., Mandelberg, E. (2002). EUROTROUGH - Parabolic trough collector developed for cost efficient solar power generation. In Proceedings of the 11th International Symposium on Concentrating Solar Power and Chemical Energy Technologies, Zurich, Switzerland, pp. 1-7.
[10] Peng, W., Sadaghiani, O.K. (2021). Evaluation of heat flux distribution uniformity around the receiver tube of parabolic trough collector based on six statistical and geometrical indices. International Journal of Heat and Mass Transfer, 164: 120547. https://doi.org/10.1016/j.ijheatmasstransfer.2020.120547
[11] Iverson, B.D., Ehrhart, B.D., Flueckiger, S.M. (2011). Trough heat collection element deformation and solar intercept impact. Sandia National Laboratories, Albuquerque, NM (United States). https://www.osti.gov/biblio/1106501.
[12] Wu, Z.Y., Lei, D.Q., Yuan, G.F., Shao, J.J., Zhang, Y.T., Wang, Z.F. (2014). Structural reliability analysis of parabolic trough receivers. Applied Energy, 123: 232-241. https://doi.org/10.1016/j.apenergy.2014.02.068
[13] Zhu, G.D. (2013). Study of the optical impact of receiver position error on parabolic trough collectors. Journal of Solar Energy Engineering, 135(3): 031021. https://doi.org/10.1115/1.4024247
[14] Stynes, J.K., Ihas, B. (2012). Absorber alignment measurement tool for solar parabolic trough collectors. In Proceedings of the ASME 2012 6th International Conference on Energy Sustainability Collocated with the ASME 2012 10th International Conference on Fuel Cell Science, Engineering and Technology. ASME 2012 6th International Conference on Energy Sustainability, San Diego, California, USA, pp. 437-447. https://doi.org/10.1115/ES2012-91283
[15] Prahl, C., Röger, M., Stanicki, B., Hilgert, C. (2017). Absorber tube displacement in parabolic trough collectors – A review and presentation of an airborne measurement approach. Solar Energy, 157: 692-706. https://doi.org/10.1016/j.solener.2017.05.023
[16] Heller, P., Meyer-Grünefeldt, M., Ebert, M., Janotte, N., Nouri, B., Pottler, K., Prahl, C., Reinalter, W. Zarza, E. (2011). KONTAS - A rotary test bench for standardized qualification of parabolic trough components. In 17th SolarPACES International Symposium on Concentrated Solar Power and Chemical Energy Technologies.
[17] Treadwell, G.W. (1976). Design considerations for parabolic-cylindrical solar collectors. Sandia National Laboratories, Albuquerque, NM (United States). https://doi.org/10.2172/7267964
[18] Treadwell, G.W., Grandjean, N.R. (1982). Systematic rotation and receiver location error effects on parabolic trough annual performance. Journal of Solar Energy Engineering, 104(4): 345-348. https://doi.org/10.1115/1.3266328
[19] Wang, P., Liu, D., Xu, C. (2013). Numerical study of heat transfer enhancement in the receiver tube of direct steam generation with parabolic trough by inserting metal foams. Applied Energy, 102: 449-460. https://doi.org/10.1016/j.apenergy.2012.07.026
[20] Khanna, S., Kedare, S.B., Singh, S. (2013). Analytical expression for circumferential and axial distribution of absorbed flux on a bent absorber tube of solar parabolic trough concentrator. Solar Energy, 92: 26-40. https://doi.org/10.1016/j.solener.2013.02.020
[21] Zhao, D.M., Xu, E.S., Wang, Z.F., Yu, Q., Xu, L., Zhu, L.Z. (2016). Influences of installation and tracking errors on the optical performance of a solar parabolic trough collector. Renewable Energy, 94: 197-212. https://doi.org/10.1016/j.renene.2016.03.036
[22] Song, J.F., Tong, K., Luo, G., Li, L. (2017). Influence of non-ideal optical factors in actual engineering on the safety and stability of a parabolic trough collector. Renewable Energy, 113: 1293-1301. https://doi.org/10.1016/j.renene.2017.06.106
[23] Aichouba, A., Merzouk, M., Valenzuela, L., Zarza, E., Kasbadji-Merzouk, N. (2018). Influence of the displacement of solar receiver tubes on the performance of a parabolic-trough collector. Energy, 159: 472-481. https://doi.org/10.1016/j.energy.2018.06.148
[24] Wu, S.Y., Luo, J.G., Xiao, L., Chen, Z.L. (2020). Effect of different errors on deformation and thermal stress of absorber tube in solar parabolic trough collector. International Journal of Mechanical Sciences, 188: 105969. https://doi.org/10.1016/j.ijmecsci.2020.105969
[25] Naveenkumar, R., Ravichandran, M., Stalin, B., Ghosh, A., Karthick, A., Aswin, L.S.R.L., Priyanka, S.S.H., Kumar, S.P., Kumar, S.K. (2021). Comprehensive review on various parameters that influence the performance of parabolic trough collector. Environmental Science and Pollution Research, 28: 22310-22333. https://doi.org/10.1007/s11356-021-13439-y
[26] Agagna, B., Behar, O., Smaili, A. (2022). Performance analysis of parabolic trough solar collector under varying optical errors. Energy Sources, Part A: Recovery, Utilization, and Environmental Effects, 44(1): 1189-1207. https://doi.org/10.1080/15567036.2022.2052385
[27] Tian, L.T., Liang, M.M., Guo, J.L., Zhang, Y., Wu, Z.Z., Wang, K. (2024). Heat transfer and thermal stress of a parabolic trough solar collector with secondary reflector using microencapsulated phase change material slurries. Thermal Science and Engineering Progress, 48: 102364. https://doi.org/10.1016/j.tsep.2023.102364
[28] Rodriguez-Sanchez, D., Rosengarten, G. (2024). Optical efficiency of parabolic troughs with a secondary flat reflector; effects of non-ideal primary mirrors. Energy, 288: 129521. https://doi.org/10.1016/j.energy.2023.129521
[29] Cheng, Z.D., He, Y.L., Cui, F.Q. (2013). A new modelling method and unified code with MCRT for concentrating solar collectors and its applications. Applied Energy, 101: 686-698. https://doi.org/10.1016/j.apenergy.2012.07.048
[30] Cheng, Z.D., He, Y.L., Cui, F.Q., Xu, R.J., Tao, Y.B. (2012). Numerical simulation of a parabolic trough solar collector with nonuniform solar flux conditions by coupling FVM and MCRT method. Solar Energy, 86(6): 1770-1784. https://doi.org/10.1016/j.solener.2012.02.039
[31] Cheng, Z.D., He, Y.L., Xiao, J., Tao, Y.B., Xu, R.J. (2010). Three-dimensional numerical study of heat transfer characteristics in the receiver tube of parabolic trough solar collector. International Communications in Heat and Mass Transfer, 37(7): 782-787. https://doi.org/10.1016/j.icheatmasstransfer.2010.05.002
[32] Delatorre, J., Baud, G., Bézian, J.J., Blanco, S., et al. (2014). Monte Carlo advances and concentrated solar applications. Solar Energy, 103: 653-681. https://doi.org/10.1016/j.solener.2013.02.035
[33] Donga, R.K., Kumar, S. (2018). Parabolic trough collector with rhombus tube absorber for higher concentration ratio. Energy Sources, Part A: Recovery, Utilization, and Environmental Effects, 40(1): 2620-2631. https://doi.org/10.1080/15567036.2018.1505981
[34] Ghomrassi, A., Mhiri, H., Bournot, P. (2015). Numerical study and optimization of parabolic trough solar collector receiver tube. Journal of Solar Energy Engineering, 137(5): 051003. https://doi.org/10.1115/1.4030849
[35] Gong, X.T., Wang, F.Q., Wang, H.Y., Tan, J.Y., Lai, Q.Z., Han, H.Z. (2017). Heat transfer enhancement analysis of tube receiver for parabolic trough solar collector with pin fin arrays inserting. Solar Energy, 144: 185-202. https://doi.org/10.1016/j.solener.2017.01.020
[36] He, Y.L., Xiao, J., Cheng, Z.D., Tao, Y.B. (2011). A MCRT and FVM coupled simulation method for energy conversion process in parabolic trough solar collector. Renewable Energy, 36(3): 976-985. https://doi.org/10.1016/j.renene.2010.07.017
[37] Mwesigye, A., Huan, Z., Bello-Ochende, T., Meyer, J.P. (2016). Influence of optical errors on the thermal and thermodynamic performance of a solar parabolic trough receiver. Solar Energy, 135: 703-718. https://doi.org/10.1016/j.solener.2016.06.045
[38] Roesle, M., Coskun, V., Steinfeld, A. (2011). Numerical analysis of heat loss from a parabolic trough absorber tube with active vacuum system. Journal of Solar Energy Engineering, 133(3): 031015. https://doi.org/10.1115/1.4004276
[39] Wendelin, T., Dobos, A., Lewandowski, A. (2013). SolTrace: A ray-tracing code for complex solar optical systems. National Renewable Energy Laboratory, Golden, CO, United States. https://docs.nrel.gov/docs/fy14osti/59163.pdf.
[40] Wang, F.Q., Shuai, Y., Yuan, Y., Yang, G., Tan, H.P. (2010). Thermal stress analysis of eccentric tube receiver using concentrated solar radiation. Solar Energy, 84(10): 1809-1815. https://doi.org/10.1016/j.solener.2010.07.005
[41] Wirz, M., Roesle, M., Steinfeld, A. (2012). Three-dimensional optical and thermal numerical model of solar tubular receivers in parabolic trough concentrators. Journal of Solar Energy Engineering, 134(4): 041012. https://doi.org/10.1115/1.4007494
[42] Shi, S., Chen, S., Fu, J.H. (2024). Determination of interparticle radiative heat transfer and radiation absorption for ellipsoidal particle beds using Monte Carlo ray tracing. International Journal of Heat and Mass Transfer, 228: 125618. https://doi.org/10.1016/j.ijheatmasstransfer.2024.125618
[43] Caliot, C., d'Alençon, L., Blanco, S., Forest, V., Fournier, R., Hourdin, F., Retailleau, F., Schoetter, R., Villefranque, N. (2024). Coupled heat transfers resolution by Monte Carlo in urban geometry including direct and diffuse solar irradiations. International Journal of Heat and Mass Transfer, 222: 125139. https://doi.org/10.1016/j.ijheatmasstransfer.2023.125139
[44] Dudley, V.E., Kolb, G.J., Mahoney, A.R., Mancini, T.R., Matthews, C.W., Sloan, M., Kearney, D. (1994). Test results: SEGS LS-2 solar collector. Sandia National Laboratories, Albuquerque, NM (United States).
[45] Chang, C., Sciacovelli, A., Wu, Z.Y., Li, X., Li, Y.L., Zhao, M.Z., Deng, J., Wang, Z.F., Ding, Y.L. (2018). Enhanced heat transfer in a parabolic trough solar receiver by inserting rods and using molten salt as heat transfer fluid. Applied Energy, 220: 337-350. https://doi.org/10.1016/j.apenergy.2018.03.091
[46] Li, Z.Y., Huang, Z., Tao, W.Q. (2016). Three-dimensional numerical study on fully-developed mixed laminar convection in parabolic trough solar receiver tube. Energy, 113: 1288-1303. https://doi.org/10.1016/j.energy.2016.07.148
[47] Liang, H.B., Fan, M., You, S.J., Zheng, W.D., Zhang, H., Ye, T.Z., Zheng, X.J. (2017). A Monte Carlo method and finite volume method coupled optical simulation method for parabolic trough solar collectors. Applied Energy, 201: 60-68. https://doi.org/10.1016/j.apenergy.2017.05.047
[48] Saini, P., Singh, S., Kajal, P., Dhar, A., Khot, N., Mohamed, M., Powar, S. (2023). A review of the techno-economic potential and environmental impact analysis through life cycle assessment of parabolic trough collector towards the contribution of sustainable energy. Heliyon, 9(7): e17626. https://doi.org/10.1016/j.heliyon.2023.e17626
[49] Forristall, R. (2003). Heat transfer analysis and modeling of a parabolic trough solar receiver implemented in engineering equation solver. National Renewable Energy Laboratory, Golden, CO. (US). https://doi.org/10.2172/15004820