Ermanno Zuccarini![]()
© 2025 The author. This article is published by IIETA and is licensed under the CC BY 4.0 license (http://creativecommons.org/licenses/by/4.0/).
OPEN ACCESS
An analysis of summer Urban Heat Island (UHI) is underway at the University of Modena and Reggio Emilia for the Municipality of Carpi, a town of seventy-two thousand inhabitants located in the central Po Valley, Italy. A work in progress is described here for the application of Long Short-Term Memory Neural Networks (LSTM NN) to a range of data typologies wider than previous research. A network of IoT control units hourly provides air temperature, pressure, relative humidity, wind, solar radiation, and rain. The study to better integrate the LSTM NN meteorological datasets with those of urban characteristics is now underway. The surface data come from WV3 satellite imagery, aggregated energy consumption counters and traffic control units. The predictive model of the trained LSTM NN will forecast, in the same areas now monitored by every climate control unit, the reduction of air temperature following improvements in surrounding urban fabric: more green, gray asphalts, energy retrofitting of buildings, etc. The simulations will provide hourly forecasts of air temperature under different weather conditions, represented by data that extends back to the previous days. Different combinations of urban improvements will be tested to obtain the best cost-effective temperature behavior.
summer urban heat island, LSTM neural Networks, urban planning, smart city, urban microclimate
In urban development, natural land cover is replaced with built structures and related human activities. This generates the Urban Heat Island (UHI) effect. The term derives from color gradient maps, where temperature hotspots are depicted as warm "islands" in a cooler rural blue "sea".
The summer UHI effect and traffic problems are the starting points of the Smart City Project in Carpi, an Italian town of almost 72,000 inhabitants located in the central Po valley. Carpi expanded significantly after WWII, driven by its textile industry. Most residential areas were built between the 1950s and 1980s. By now, energy retrofitting in buildings is slowly being adopted, but air conditioning is common. The town also has industrial zones that constitute further hotspots of the UHI. Climate change is worsening the situation with hotter and longer summer heatwaves, when city center temperatures reach values around 45℃ in the afternoon and stay high (around 25℃) during "tropical nights," endangering vulnerable residents.
This document outlines an ongoing analysis of the UHI effect using Long Short-Term Memory Neural Networks. This is part of the broader research project "Urban Comfort and Heat Island Mitigation", actually conducted by the University of Modena and Reggio Emilia (UniMoRe) for the Municipality of Carpi.
2.1 The whole research activities of the project “Urban Comfort and Heat Island Mitigation”
•Study of the optimal choice and positioning of IoT sensors for meteorology.
•Processing of WV3 satellite images to map urban surfaces, taken in 2023, deriving Normalized Difference Vegetation Index (NDVI) and albedo.
•Anthropogenic heat analysis: traffic and consumption of gas and electricity.
•Development of a statistical-predictive model, based on Long Short-Term Memory Neural Networks, that uses the data collected by IoT sensors, satellites and aggregated energy consumption counters, to estimate temperature reduction following urban improvements. This is the work conducted by the author of the present article.
•Study of the urban pavement materials to optimize solar reflectance and reduce heat perceived by pedestrians.
•Development of a prototypical Computational Fluid Dynamics (CFD) model to simulate turbulent natural convection in a simplified prototype of an urban model.
•Support for the Municipality in progressive energy regeneration of public buildings, focusing on schools and offices, proposing solutions for insulation and adaptive climate control.
2.2 The sensor network
To address the UHI problem, starting from 2020, Carpi has installed a network of fixed IoT sensors collecting data on climate, air quality, and traffic. This initiative is a pilot project in the Emilia-Romagna region, run by the Regional Digital Multiutility Lepida, which manages the data infrastructure [1]. Data collected in the urban environment by meteorological sensors are compared with those collected in the countryside by the network of the Regional Environmental Agency ARPAE [2].
The actual first installation phase of control units, having different makes and models, aims to test their reliability and endurance.
This control unit network, once working at full capacity, will make available an amount of time-series data collected hourly adequate for LSTM Neural Networks modeling.
2.3 Satellite image processing
The WV3 images were taken during full foliage and processed, obtaining three files:
•An image in 16 bands in surface reflectance. The digital numbers were radiometrically corrected to obtain the radiance at the top of the atmosphere, then atmospheric corrections were applied to obtain the surface reflectance.
•A single-band image of the Normalized Difference Vegetation Index (NDVI) calculated as the normalized difference between the near-infrared band (B8 was chosen instead of B7) and the red band (B5). Higher NDVI values indicate the presence of lush vegetation.
•A single-band image of albedo values obtained using all 16 bands and assigning a "weight" to each band based on the Thuillier coefficients, the most commonly used in literature with WV3 data.
Further processing is needed to obtain the Normalized Difference Built-up Index (NDBI).
2.4 Statistical-predictive analysis using LSTM neural networks
2.4.1 Introductory notions
Traditional statistical methods have played a key role in analyzing observational data to identify correlations between urban characteristics and UHI intensity. More recently, data-driven statistical modeling using artificial neural networks and other machine learning techniques is emerging. The statistical approach offers an easy-to-obtain outlook of the urban factors that determine different trends of temperature in the various town zones [3, 4]. Hence, in urban planning activity, it is possible to simulate various combinations of modifications on those factors and choose the best cost-effective solution.
2.4.2 LSTM neural networks
Neural networks derive their name from their original aim: in 1943, they were conceived as a simplified model of signal propagation between neurons. But, apart from niche neurobiological studies, its mathematical model is widely useful as a universal function approximator, with inner parameters calibrated with cyclical refinements - “learning” - to emulate correlations between inputs and outputs. Neural networks are a subset of tools that constitute statistical Machine Learning [5].
Among the different paradigms of neural networks, Long Short-Term Memory (LSTM) Neural Networks, firstly presented in 1995, are suited to take as input a temporal series of values to make predictions for the near future, also in the form of further temporal series. One typical use in climate modeling is short-term localized weather forecasting.
2.4.3 Application of LSTM neural networks to UHI modeling
A search conducted on Scopus in early May 2025 yielded 20 results for "urban heat island long short-term memory". The studies that emerged are highly heterogeneous by objective, physical characteristics of the town and modeling methodology. Different studies relate to the application of LSTM Neural Networks over multiple years of satellite data that detect Land Surface Temperature (LST) in expanding cities, a trend not foreseen for Carpi. Furthermore, some LSTM modeling is specific for cities with characteristics significantly different from Carpi, e.g., cold, hilly, coastal, or that differ in typologies of available data. All these contributions had only an introductory role in this study, giving a panorama of LSTM modeling applied to UHI research.
A study by Yu et al. [6], which bears an analogy to the work of Carpi, demonstrates the effectiveness of LSTM modeling of the UHI using data collected by a network of IoT sensor units conducted in New York. But that research was aimed only at short-term emergency management.
Four articles, although very different in their approach and available data, offer hints for further development of the ongoing research because different methodologies are compared. In the study of Menon et al. [7], a comparison between multilinear regression (MLR) and LSTM Neural Network shows that the unexpected outperformance of MLR depends on the specific input data typology. In the studies of Huo et al. [8], Andres and Isa [9], and Yang et al. [10], bidirectional LSTM (Bi-LSTM) Neural Networks are introduced in UHI studies. Further modeling of the present research could verify whether, with the datasets adopted for Carpi, BI-LSTM Neural Networks outperform the LSTM ones.
2.4.4 First configuration and test of the LSTM neural network with only meteorological data
For a first computational cost checking, the LSTM model, run on a free version of Google Colab with TensorFlow machine learning library, has been successfully trained and tested, with these hourly inputs:
•Air temperature, absolute humidity, atmospheric pressure and solar radiation taken from the control unit located in the hospital parking.
•Sinusoidal and cosinusoidal values representing the period of year and day, substituting dates and hours.
•Countryside air temperature and hourly rain taken from the ARPAE control unit located near Cortle.
•Countryside wind speed and direction taken at 10 m. from the ARPAE control unit near Rolo.
The whole dataset covers hourly readings from January 2021 to December 2024–25664 hours. In the training phase, for each of 20 epochs of training, from the training dataset 40 batches are processed each having a size of 320 sequences. Each sequence has 240 hourly steps. A test has then been performed on a dataset of 6356 hours going from spring to winter 2023. This test phase involves 20 datasets, each of 320 sequences of 240 hours. The prediction accuracy on temperature normalized data has a loss of 0.0016. The accuracy decreases with variable weather and increases in days of good weather, but only this last result is relevant for UHI studies.
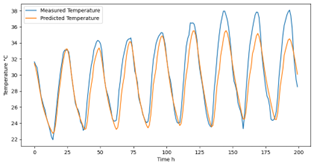
Figure 1 shows the test results on 1000 hours, covering in summer of 2023, a heat peak followed by a milder period. In Figure 2, the heat peak is shown in detail. By now, the input data for the neural network includes only the meteorological ones; hence, the network is not able to predict the flywheel effect of heat waves in the urban context. In fact, after a series of increasing temperatures, the measured values exceed those predicted by the neural network. But also, this lack highlights the effect of the accumulated heat on air temperature in the actual urban area of the hospital parking, including the more widespread heat accumulation in the Po Valley.
Figure 1. Test result
Figure 2. Details of the heat peak
With future fully functioning exterior IoT control units and additional input data on the surrounding urban characteristics, it will be possible to train the neural network under all the conditions of the various locations in Carpi. Hence, the neural network will acquire forecasting capability of the UHI effect. This capability will also be effective in different local contexts, not only already existing but also hypothetically improved.
2.4.5 Preliminary study for surface data buffering and integration in the neural network
The configuration of the surface input data for the LSTM Neural Network is in a preliminary study phase. For a first statistical processing only, albedo, NDVI, NDBI, anthropogenic heat, and road density could be added. Albedo, NDVI, and NDBI are derived from WV3 satellite images, anthropogenic heat from data of energy consumption and traffic, while road density from OpenStreetMap.
The surface data of the area surrounding every air temperature sensor has to be processed with reference to the sensor position. The area of Carpi and the surrounding land is completely plain. Hence, a first approach in bufferization is to draw with QGIS, for every control unit position, a circular area with a radius equal to the maximum diameter of the town, subdivided into three concentric zones, also subdivided into 8 sectors. This distinguishes areas of short, medium, and long range influence on the control unit and the sector corresponding to the main wind direction coming from the countryside. For every buffer obtained by this subdivision, the average NDVI, NDBI, albedo, anthropogenic heat, and road density will be calculated and weighted in function of the distance of the buffer itself from the control unit and the speed and direction of wind. This will give, at an hourly cadence, the contributions of those variables to the air temperature measured by the control unit. These contributions will be inserted as additional inputs in the LSTM Neural Network.
The radius of the circular area has to be equal to the maximum diameter of the town. For a control unit located at the extreme periphery, when the wind comes from the inside of the town, the entire town itself contributes to the measured air temperature.
This empirical approach will require multiple trials in buffer reshaping and weighting. In the scientific literature about UHI, buffering techniques are based in each case on the specific characteristics of the surface, available data, and methodology [11, 12]. The most similar to the approach outlined here is that adopted for a land use regression approach studying the city of Bern [13].
2.4.6 A further refined approach including physical laws with TEB-Tree Parametrization
In the research of Vieira Zezzo et al. [14], different microscale approaches are compared. Considering the actual available data for Carpi and the urban green integration plan outlined by the Municipality, the Town Energy Balance with tree parameterization (TEB-Tree Parameterization) looks fit for a refined modeling of hotspot UHI areas. Its detailed precision could become useful for its integration in the above-described UHI statistical modeling. In TEB-Tree Parameterization, the urban environment is represented as an array of street canyons, in order to calculate the energy balance for canyon facets (roofs, walls, ground) with a tree foliage layer taken into account. With tree parameterization, TEB models the radiative effects of trees (interception, reflection, transmission, absorption, and emission of shortwave and longwave radiation), separates the turbulent sensible and latent heat fluxes originating from trees versus ground-based vegetation, and incorporates the aerodynamic drag effect of trees on airflow within the canyon. For a detailed review of the literature and description of these features [15]. TEB modeling on a very high resolution satellite-derived vegetation database is described by Bernard et al. [16] and could be considered for an analogue application to the WV3 images of Carpi.
While the research on UHI regarding Carpi is ongoing and a discussion of results is premature, this article could incentivize the debate about LSTM Neural Networks in integration with the modeling of physical laws in urban canyons. This integration has not yet been developed in research.
LSTM Neural Networks result in cost-effectiveness in research with limited budgets for a statistical dynamic modeling of the whole UHI. But a more refined and reliable work imposes an integration with an expert modeling based on physical laws.
Thanks to: 1) Professor Alberto Muscio (DIEF, UniMoRe), who coordinates the research work concerning the Carpi UHI project and indicated in detail the variables for setting up the model here described; 2) the Municipality of Carpi for making available climate, satellite, and complementary urban data; 3) Francesca Despini (DIEF, UniMoRe) for processing WV3 satellite images.
[1] Rete IoT per la PA. Lepida. Bologna, Italy. https://www.lepida.net/azioni-strategiche-speciali/rete-iot-pa.
[2] Dati in tempo reale in Emilia-Romagna. ARPAE. Bologna, Italy. https://www.arpae.it/it/temi-ambientali/meteo/dati-e-osservazioni/dati-in-tempo-reale.
[3] Ghorbany, S., Hu, M., Yao, S., Wang, C. (2024). Towards a sustainable urban future: A comprehensive review of urban heat island research technologies and machine learning approaches. Sustainability, 16(11): 4609. https://doi.org/10.3390/su16114609
[4] Tehrani, A.A., Veisi, O., Delavar, Y., Bahrami, S., Sobhaninia, S., Mehan, A. (2024). Predicting urban Heat Island in European cities: A comparative study of GRU, DNN, and ANN models using urban morphological variables. Urban Climate, 56: 102061. https://doi.org/10.1016/j.uclim.2024.102061
[5] Warner, B., Misra, M. (1996). Understanding neural networks as statistical tools. The American Statistician, 50(4): 284-293. https://doi.org/10.1080/00031305.1996.10473554
[6] Yu, M., Xu, F., Hu, W., Sun, J., Cervone, G. (2021). Using Long Short-Term Memory (LSTM) and Internet of Things (IoT) for localized surface temperature forecasting in an urban environment. IEEE Access, 9: 137406-137418. https://doi.org/10.1109/ACCESS.2021.3116809
[7] Menon, S.P., Basavaraj, M., Tharun, A., Ramkumar, V. (2023). Prediction of temperature in Indian metropolitan cities using linear regression and long short term memory models. In 2023 International Conference on Network, Multimedia and Information Technology (NMITCON), Bengaluru, India, pp. 1-8. https://doi.org/10.1109/NMITCON58196.2023.10275987
[8] Huo, X., Cui, G., Ma, L., Tang, B., Tang, R., Shao, K., Wang, X. (2022). Urban land surface temperature prediction using parallel STL-Bi-LSTM neural network. Journal of Applied Remote Sensing, 16(3): 034529. https://doi.org/10.1117/1.JRS.16.034529
[9] Andres, D., Isa, S.M. (2023). A comparison of three deep learning methods for predicting land surface temperature using Landsat 8 imagery. ICIC Express Letters 17(11): 1177-1186. https://doi.org/10.24507/icicel.17.11.1177
[10] Yang, D., Zhong, S., Mei, X., Ye, X., Niu, F., Zhong, W. (2023). A comparative study of several popular models for near-land surface air temperature estimation. Remote Sensing, 15(4): 1136. https://doi.org/10.3390/rs15041136
[11] Lin, F.Y., Huang, K.T., Lin, T.P., Hwang, R.L. (2019). Generating hourly local weather data with high spatially resolution and the applications in bioclimatic performance. Science of the Total Environment, 653: 1262-1271. https://doi.org/10.1016/j.scitotenv.2018.10.433
[12] Chen, Y.C., Liao, Y.J., Yao, C.K., Honjo, T., Wang, C.K., Lin, T.P. (2019). The application of a high-density street-level air temperature observation network (HiSAN): The relationship between air temperature, urban development, and geographic features. Science of the Total Environment, 685: 710-722. http://doi.org/10.1016/j.scitotenv.2019.06.066
[13] Burger, M., Gubler, M., Heinimann, A., Broennimann, S. (2021). Modelling the spatial pattern of heatwaves in the city of Bern using a land use regression approach. Urban climate, 38: 100885. https://doi.org/10.1016/j.uclim.2021.100885
[14] Vieira Zezzo, L., Pereira Coltri, P., Dubreuil, V. (2023). Microscale models and urban heat island studies: A systematic review. Environmental Monitoring and Assessment, 195(11): 1284. https://doi.org/10.1007/s10661-023-11906-2
[15] Redon, E., Lemonsu, A., Masson, V. (2020). An urban trees parameterization for modeling microclimatic variables and thermal comfort conditions at street level with the Town Energy Balance model (TEB-SURFEX v8. 0). Geoscientific Model Development, 13(2): 385-399. https://doi.org/10.5194/gmd-13-385-2020
[16] Bernard, É., Munck, C.D., Lemonsu, A. (2022). Detailed mapping and modeling of urban vegetation: What are the benefits for microclimatic simulations with Town Energy Balance (TEB) at neighborhood scale? Journal of Applied Meteorology and Climatology, 61(9): 1159-1178. https://doi.org/10.1175/JAMC-D-21-0134.1