Mohammad Muslimin*![]() | Imaduddin Bahtiar Efendi
| Imaduddin Bahtiar Efendi![]() | Achmad Rijanto
| Achmad Rijanto![]() | Luthfi Hakim
| Luthfi Hakim![]() | Wawan Aries Widodo
| Wawan Aries Widodo![]()
© 2025 The authors. This article is published by IIETA and is licensed under the CC BY 4.0 license (http://creativecommons.org/licenses/by/4.0/).
OPEN ACCESS
Thermal management is a key aspect to maintain both the performance and safety of electric vehicle batteries. This study focuses on analyzing the air-cooling system for a prismatic battery pack containing 12 cells arranged in an aligned and paired configuration. Simulations using a 3D RNG k-ε model with enhanced wall treatment were conducted. Various airflow rates of 3, 12, and 21 L/s were used to evaluate the temperature distribution as well as the magnitude of the pressure drop. The results indicated that increasing the airflow rate reduced the module's temperature but resulted in an increase in pressure drop. When compared to the inline configuration, the paired arrangement provides more even cooling despite the increase in pressure drop. An increase in airflow from 3 L/s to 21 L/s can reduce the average module's temperature from 36.7℃ to 32.9℃ in the inline arrangement, and from 31.7℃ to 30.0℃ in the paired arrangement. These findings provide important insights for the development of battery thermal management systems, especially for simple cooling methods with low airflow rates.
air cooling, inline configuration, couple configuration, prismatic battery
Lithium-ion batteries are now serving as crucial components in various modern energy applications, for example, including energy storage systems, electric vehicles, and portable electronic devices. Of the various types of batteries available, prismatic lithium-ion batteries are the top choice due to their high energy density, space utilization efficiency, and superior thermal management performance [1, 2]. The thermal conditions of lithium-ion batteries greatly affect their performance and lifetime. High operating temperatures can accelerate electrochemical damage, decrease capacity, and even pose safety risks such as heat escape [3-5]. Thus, an optimized thermal management system is required to keep the battery operating within a safe temperature range. The ideal range for keeping lithium-ion batteries performing well, lasting longer, and ensuring safety is 25℃ to 40℃ [6]. In addition, in battery modules, the temperature difference between cells must be kept to a minimum of 5℃ [7].
Air cooling is a commonly used cooling technique due to its cost efficiency, ease of design, and ease of maintenance. It can also help prevent leaks since the system does not need liquid fluid [8]. However, air cooling faces challenges in maintaining even temperatures among battery cells and effectively lowering temperatures, especially in modules with several closely arranged cells. The layout of the battery can influence the airflow pattern, which impacts cooling performance [9, 10]. Boosting the airflow rate can improve the thermal performance by lowering the highest temperature and balancing the temperature across the cells, which adjusts the distance between them [11-13]. However, increasing the air flow rate can decrease the energy efficiency of the system as it increases the pressure difference between the inlet and outlet.
Previous research proved that the cell arrangement design and air-cooling method greatly affect the thermal performance of batteries, with rectangular, hexagonal, and circular arrangement patterns analyzed through 3D CFD simulations. These simulations took into account changes in fan location and the spacing between cells. The findings show that the fan configuration placed on the top side of the modules produces the highest cooling effectiveness. The rectangular configuration outperforms others in balancing cooling effectiveness and cost. At the same time, the hexagonal arrangement is more suitable when the primary focus is on space utilization efficiency. The spacing between cells has also been found to play a crucial role in enhancing the uniformity of temperature distribution [14]. Other studies have also been conducted to analyze the effects of ventilation type and speed, distance between cells, ambient and intake air temperatures, number of cells in a row, and battery diameter on cooling performance [15]. The results show that the local temperature difference first increases and then decreases as the airflow velocity rises. Also, changing the airflow direction between cell rows doesn't always lead to the best cooling. The distance between cells should not be too small or too large. When ambient temperatures are very high, the risk of thermal runaway can rise significantly.
Previous research has discussed the effects of inlet and outlet size, air inlet and outlet position [16], the effect of air flow rate variation [17], the influence of ducting design [18], and the effect of adding multiple vortex generators on battery cooling [19]. However, there are no studies comparing inline and coupled battery setup configurations. Whereas the difference in configuration significantly affects the airflow distribution, maximum temperature, and temperature uniformity between battery cells. Therefore, this study aims to analyze and compare the air-cooling performance of 12-cell prismatic battery modules with inline and coupled configurations using Computational Fluid Dynamics (CFD) simulation. Airflow rate variations (Flow rates of 3 L/s, 12 L/s, and 21 L/s) were used to evaluate the effect of cooling intensity on maximum temperature (Tmax), average temperature, and temperature uniformity (ΔT) between cells. The results of this study are expected to guide the optimal design of battery module configurations in terms of cooling efficiency and temperature uniformity.
2.1 CFD model description
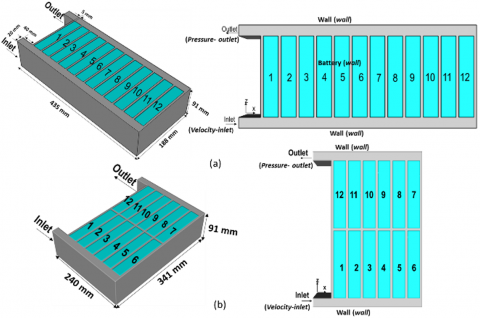
In this study, we conducted a 3D Computational Fluid Dynamics simulation of a battery module that contains 12 battery cells. The battery cells are arranged in two ways: the inline arrangement (Figure 1(a)) and the couple arrangement (Figure 1(b)). Each setup aims to evaluate the temperature distribution, cooling efficiency, and features of the cooling fluid flow. In the inline configuration, all battery cells are arranged in a row, lengthwise, allowing the cooling air to flow linearly from the inlet, following the direction of the cell arrangement, towards the outlet. Meanwhile, in the couple configuration, the battery cells are arranged in pairs in two adjoining rows, allowing for a variety of flow paths and the potential for different temperature distribution compared to the inline configuration.
Figure 1. Schematic of the battery modules configuration: (a) Inline arrangement and (b) coupled arrangement
The battery used in this research is a prismatic type with NMC (Nickel-Manganese-Cobalt) chemical material. This type of battery was chosen because it has high energy density and good performance stability. Every battery cell has a 43 Ah capacity and a 3.65 V voltage, allowing it to store sufficient energy for medium to high power applications. The cell is designed to operate at maximum charge and discharge currents of up to 2C, which means it can withstand currents of approximately twice its nominal capacity without experiencing significant performance degradation. The comprehensive battery specifications are provided in Table 1.
Table 1. Details of battery
|
Parameter |
Value |
|
Type of Battery |
Prismatic |
|
Chemistry Catoda |
NMC |
|
Capacity |
43 Ah |
|
Heat Capacity |
900 J/Kg-1K-1 |
|
Voltage |
3.65 Volt |
|
Charge/discharge limit current |
2C |
|
Dimensions of Single Battery |
27.5 mm × 91 mm × 148 mm |
|
Weight |
0.84 kg |
2.2 Computational domain and meshing
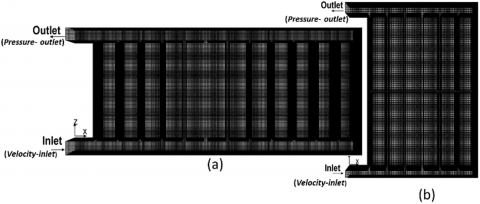
The simulated domain is a prismatic configuration of a battery module containing 12 cells, with two different configurations: inline and coupled arrangements. Each domain includes the battery cell geometry, along with the cooling air ducts, allowing for thorough simulation of fluid flow and temperature distribution. The meshing process was performed using the structured mesh method to obtain flexibility in following the contours of the prismatic geometry and maintaining element quality. The mesh size is chosen to strike a balance between the accuracy of simulation results and computational requirements. To ensure that the mesh used is adequate, mesh independence tests are also conducted, so that the results of temperature distribution and airflow do not depend solely on the number of elements, but truly represent the physical phenomena that occur. For the inline configuration, a total of 913,468 cells were used. While in the couple configuration, the number of elements reaches 10,368,423 cells. This significant difference is due to the complexity of the domain in the couple configuration, which has a tighter geometry and more complicated airflow channel details than the inline configuration. The shapes of both meshes are presented in Figure 2(a) and Figure 2(b).
Figure 2. Structured mesh of the battery modules configuration: (a) Inline arrangement and (b) coupled arrangement
2.3 Mathematical model
The impact of different airflows on battery cooling performance has been examined in this work using 3D CFD models. Energy, momentum, and continuity are among the fundamental equations that have been resolved. This simulation used the finite volume method with an explicit approach. To improve the solution's accuracy, the second-order upwind technique, the SIMPLE algorithm, and the discretization of the equations are combined. The turbulence model employed is the RNG k-ε model with enhanced wall treatment [20, 21], designed to better represent the near-wall flow phenomenon. Additionally, to ensure the conservation of mass, momentum, and energy in the simulation domain, a convergence requirement of 10-6 is applied to the continuity and energy equations.
The governing equations are expressed as follows:
Continuity equation
$\nabla \cdot(\rho V)=0$ (1)
$\rho\left(\frac{\partial V}{\partial t}+V \cdot \nabla \mathrm{~V}\right)=0$ (2)
$\rho C_p\left(\frac{\partial T}{\partial t}+V \cdot \nabla \mathrm{~T}\right)=\nabla \cdot(\mathrm{k} \nabla \mathrm{T})+Q_{g e n}$ (3)
In the equation, $\rho$ represents air density, $V$ is the velocity vector, $P$ describes static pressure, $\mu$ is dynamic viscosity, $C_p$ refers to specific heat, k is thermal conductivity, T represents temperature, and $Q_{\text {gen }}$ shows the rate of heat generated by battery cells per unit volume.
2.4 Validation
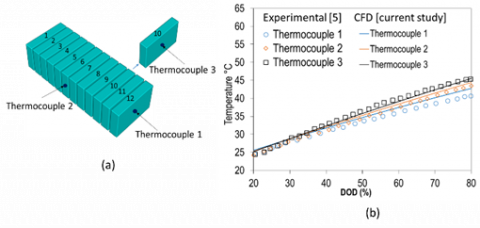
This research has been confirmed by experimental results from Akbarzadeh et al. [5]. Tests were conducted under uncooled conditions, using a discharge rate of 2C at an ambient temperature of 25℃. Three thermocouples were installed to measure the temperature at several points shown in Figure 3(a). A comparison between simulation results and experimental measurements is shown in Figure 3(b). Figure 3 also shows the validation results, illustrating the relationship of temperature to Depth of Discharge (DOD). The results show good agreement between the numerical and experimental data, with deviations of less than 3% for thermocouple 1, 2% for thermocouple 2, and 1% for thermocouple 3.
Figure 3. (a) Thermocouple locations on the module's surface; (b) Validation of numerical model with experimental data reported by Akbarzadeh et al. [5]
This section presents the simulation results of an air-cooling system for a battery module consisting of 12 prismatic cells, arranged either in parallel or in pairs. The simulations were carried out with variations in air flow rates of 3, 12, and 21 L/s. The focus of the analysis includes the temperature distribution in each cell, the intercellular temperature difference (ΔT) as a measure of uniformity, the average temperature of the modules, as well as the pressure drop along the battery modules. In addition, temperature contour graphs and thermal distribution visualizations are included to show how airflow rate variations affect cooling performance, improve temperature uniformity, and their impact on the magnitude of pressure drop.
3.1 Average temperature of the battery modules in an inline configuration
Monitoring the average temperature is an important step to assess the effectiveness of the air-cooling system in the battery modules. The average temperature of each cell provides an overall picture of how well heat is being removed from the system. It also reflects the thermal conditions experienced by each cell in the battery modules. If the battery cell's average temperature is lower and the temperature differential between battery cells is smaller, the heat dissipation process can proceed more efficiently. In other words, a low average temperature value suggests that the heat from the discharge process can be effectively eliminated, whereas a high value shows that the cooling system is limited in its ability to maintain the cell working temperature within the ideal range.
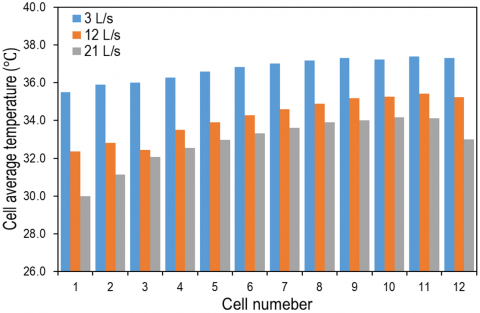
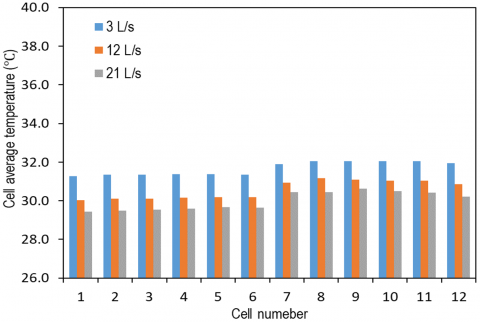
The average temperature distribution of each battery cell in the inline configuration for three airflow rate variations (3 L/s, 12 L/s, and 21 L/s) is shown in Figure 4. In general, the average temperature of battery cell 1 to battery cell 12 increases gradually at all airflow rate variations. This occurs because the cooling air experiences an increase in temperature as it passes through a row of battery cells, thereby reducing its ability to absorb heat. As a result, the battery cell temperature at the back tends to be higher than the battery cell at the front. Increasing the air flow rate can result in a decrease in the average temperature of the battery cell. In cell battery 1, the average temperature decreased from 35.5℃ (3 L/s) to 32.3℃ (12 L/s) and 30.0℃ (21 L/s). This trend was consistent until the last cell battery. In cell battery 12, the average temperature decreased from 37.3℃ (3 L/s) to 35.2℃ (12 L/s) and 33.0℃ (21 L/s). This suggests that a higher rate of increase in air flow can enhance the convection heat transfer coefficient [22]. However, the inline configuration causes air to pass through a row of battery cells in sequence, resulting in an increase in temperature from the initial cell to the last.
Figure 4. Average temperature of cells in the inline arrangement
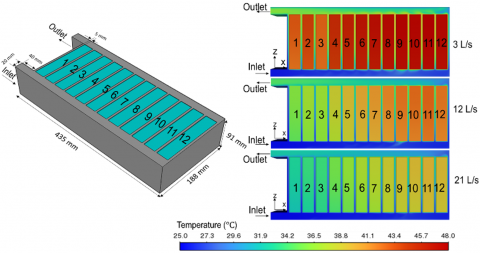
The temperature distribution in the inline configuration with three variations of airflow rate (3 L/s, 12 L/s, and 21 L/s) is shown in Figure 5. The airflow passes through the rows of prismatic battery cells that are lined up in the battery modules set after entering from the intake side (positive X-axis direction). The temperature of the battery cells is seen to progressively rise from cell one at the front to cell 12 at the back at an airflow velocity of 3 L/s. The front battery cells (Cells 1–3) have a temperature between 33.0℃ and 36.0℃, and the rear battery cells (Cells 10–12) have a temperature between 43.0℃ to 46.0℃. The significant temperature gradient indicates that the low airflow rate is not able to absorb heat effectively along the channel, resulting in heat accumulation in the cells at the back. At an airflow rate of 12 L/s, the temperature distribution becomes more even than at 3 L/s, and there is still a noticeable increase in temperature from the front to the back of the battery cell. The temperature of the battery cells at the front (Cells 1 to 3) ranges from 30.0℃ to 33.0℃, while the temperature of the battery cells at the back (Cells 10 to 12) ranges from 38.0℃ to 40.0℃. In addition, increasing the airflow rate increases the convection heat transfer coefficient, allowing heat to be absorbed faster and reducing the temperature gradient between cells. At an airflow rate of 21 L/s, the temperature distribution becomes the most even among the three conditions. The temperature of the battery cells at the front (Cells 1 to 3) ranges from 27.0℃ to 30.0℃, while the temperature of the battery cells at the back (Cells 10 to 12) ranges from 34.0℃ to 36.0℃. The temperature gradient from the front to the back of the battery cell is relatively small, indicating more effective convective cooling along the battery modules.
Figure 5. Temperature distribution of cells battery in the inline arrangement at flow rates variation
3.2 Average temperature of the battery modules in a couple configurations
The average temperature of the battery modules in a couple configuration depicts the average temperature distribution of each battery cell in a paired configuration. In the couple configuration, the battery cell arrangement is divided into two parallel rows. Battery cells number 1 to 6 are paired with batteries number 7 to 12. Thus, the positions of batteries 1 and 6 are at the front of the airflow direction, while batteries 7 and 12 are at the back. This arrangement pattern causes the cells in the back row to receive cooling air that has been warmed up from the front row, so they potentially have a higher temperature.
Each battery cell's typical temperature distribution in the pair configuration for three variations of airflow rates (3 L/s, 12 L/s, and 21 L/s) is shown in Figure 6. In general, the average temperature distribution in the couple configuration shows a decreasing temperature trend as the airflow rate increases. At an airflow rate of 3 L/s, the battery cell's typical temperature falls in the range of 31℃ to 32℃. In this condition, the temperature tends to increase slightly from the battery cell in front (Cell 1) to the last battery cell (Cell 12), which is next to each other. The increase in temperature between battery cells occurs due to heat accumulation and a decrease in air cooling capacity along the flow path. At a flow rate of 12 L/s, the cell temperature was in the range of 29.8-30.8℃, and the intercellular temperature difference was reduced, while a rate of 21 L/s produced the lowest average temperature, which is around 29-30.5℃. The 21 L/s flow rate condition produces the most uniform temperature distribution across the battery modules. This indicates that a larger airflow rate increases the intensity of convection heat transfer, and the accumulation of heat that occurs in a row of battery cells can be minimized.
Figure 6. Average temperature of cells in the couple arrangement
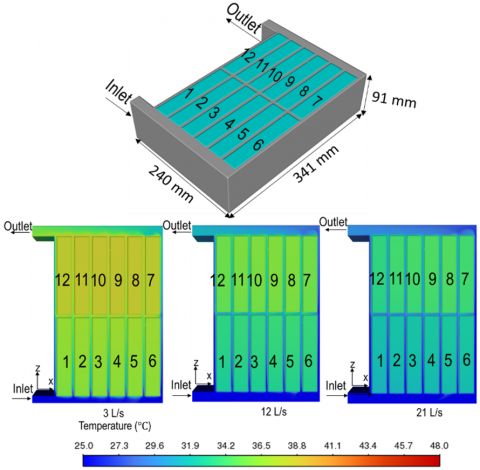
The temperature distribution in the couple configuration with three variations of airflow rates (3 L/s, 12 L/s, and 21 L/s) are presented in Figure 7. The airflow enters from the inlet side (positive X-axis direction) and flows past two rows of prismatic cells arranged in pairs in two parallel paths. At a flow rate of 3 L/s, the temperature gradient is clearly visible from the battery cells at the front (Cells 1-6) to the battery cells at the back (Cells 7-12). Visualization of the temperature contour shows that the cells at the back experience slightly higher heat accumulation due to a decrease in cooling air temperature after passing through the front row. Increasing the flow rate to 12 L/s has a significant impact on reducing the temperature gradient. A decrease in thermal resistance between the cooling air and the cell surface and an increase in the efficiency of convection heat transfer are indicated by the more uniform color distribution on the contours. The temperature differential between the front and rear battery cells is nearly undetectable at a flow rate of 21 L/s. The color of all cells is close to uniform (blue-green), indicating that forced convection is so dominant that the cooling air can maintain its cooling capacity to the last battery cell.
Figure 7. Temperature distribution of cells battery in the couple arrangement at flow rates variation
The better temperature uniformity in the couple configuration is due to the internal aerodynamic characteristics that are able to distribute airflow more effectively between the battery cells. The paired arrangement of cells generates secondary flows and localized vortices between the inter-cell gaps, which increase the intensity of turbulence and prevent the formation of stagnant zones that often appear as occurs in the inline configuration [5]. This condition makes the forced convection process at the cell surface more even, so that the convection heat transfer coefficient value becomes more uniform and the intercellular temperature gradient is reduced. In contrast, in the inline configuration, the airflow experiences a gradual decrease in velocity due to the cascading resistance of the battery cells arranged in order from upstream to downstream, which creates a thermal shadow zone and causes heat accumulation in the downstream cells. Thus, the couple configuration provides more stable cooling performance through a more balanced distribution of flow and heat transfer across the battery modules.
3.3 Pressure drop and temperature distribution in the configuration of an inline battery module
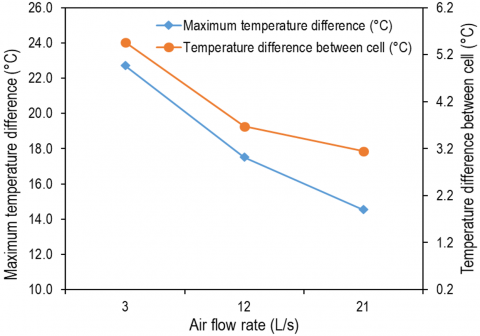
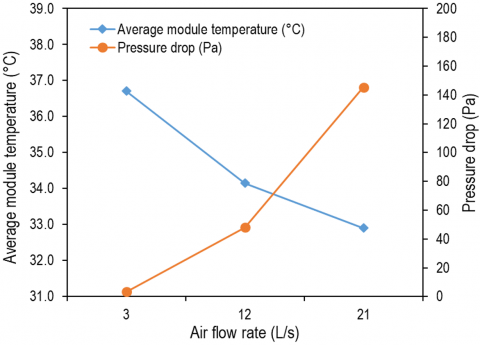
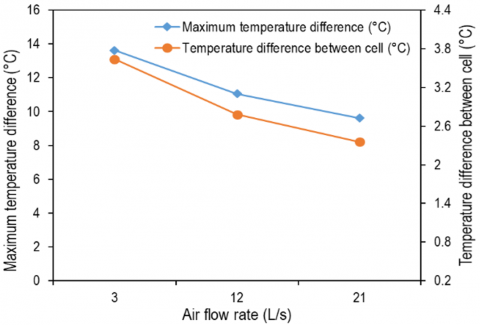
The average module temperature and pressure drop in the inline battery modules configuration are shown in Figure 8, while the highest temperature difference and temperature difference between cells are shown in Figure 8. As seen in Figure 8, the maximum temperature difference (℃) and the temperature difference between cells (℃) can be used to determine the cooling performance of battery modules. The difference between the highest and lowest temperatures in each battery module cell is known as the maximum temperature differential. In the meantime, Figure 9 illustrates how average module temperature and pressure drop are related. Pressure drop is the difference in pressure between the channel's inlet and outlet sides, whereas average module temperature is the mean temperature of all the battery cells within the modules.
Figure 8. Maximum temperature difference and temperature difference between cells for the inline configuration
Figure 9. Average module temperature and pressure drop for the inline configuration
The general degree of homogeneity in the temperature distribution is depicted in Figure 8. According to the simulation results, the maximum temperature difference may be decreased from 22.7℃ to 14.5℃, and the temperature difference between cells can be decreased from 5.4°C to 3.1℃ by increasing the cooling airflow rate from 3 L/s to 21 L/s. When the airflow rate is increased to 21 L/s, the maximum temperature in the inline arrangement, which is 47.7℃, can drop to 39.5℃. It happens because higher flow rates make forced convection stronger, which speeds up the airflow's ability to carry heat to the outlet. In the meantime, the reduction in the temperature differential across cells suggests that as the airflow rate rises, the temperature distribution between cells becomes more consistent. However, the gradual heating effect along the flow still causes the cells at the back to remain hotter than the cells at the front.
Figure 9 illustrates the relationship between average module temperature and pressure drop for the Inline Configuration. Increasing the airflow rate from 3 L/s to 21 L/s decreased the average battery temperature from 36.7℃ to 32.9℃. It suggests that increasing the airflow rate can enhance the cooling effectiveness. However, increasing the airflow rate also causes a significant increase in pressure drop, from 3.4 Pa at 3 L/s to 145.3 Pa at 21 L/s. The higher the airflow rate entering through the duct inlet, the greater the kinetic energy lost due to wall friction and turbulence effects, resulting in a significant increase in pressure drop. It means that although cooling is more effective, the fan power requirement to control pressure drop also increases.
3.4 Average module temperature and pressure drop in a couple of battery module configurations
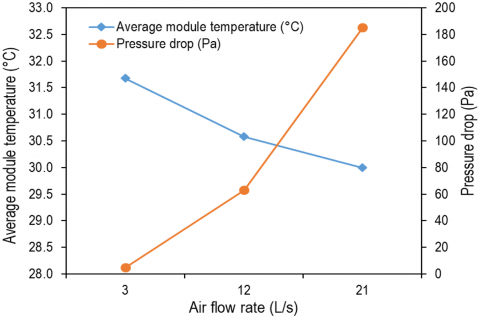
Figure 10 illustrates the maximum temperature difference and the temperature difference between cells, while Figure 11 shows the average module temperature and pressure drop in several battery module configurations. The couple configuration was chosen because its arrangement pattern allows for increased air mixing and expands the contact area of the flow against the cell surface, potentially improving temperature uniformity and lowering the maximum temperature. The selection of the couple as a comparison aims to identify the extent to which modifications to the array geometry can improve cooling performance without ignoring the implications for increased pressure drop.
Figure 10. Maximum temperature difference and temperature difference between cells for the couple configuration
Figure 11. Average module temperature and pressure drop for the couple configuration
Figure 10 represents the level of uniformity of battery modules' temperature distribution in the couple configuration. According to the modeling results, the greatest temperature differential drops from 13.6℃ at a 3 L/s airflow rate to 9.6℃ at a 21 L/s airflow rate. Furthermore, within the same flow rate range, the obtained temperature differential between cells drops from 3.6℃ to 2.3℃. At an airflow rate of 3 L/s, the couple configuration's maximum temperature is 38.7℃; when the airflow rate is increased to 21 L/s, the temperature drops to 34.6℃. This drop happens because raising the airflow rate can speed up the convection heat transfer rate, which enables the heat produced by the battery cell to be transported to the outlet more quickly. In the couple configuration, the airflow pattern is more diffuse, and the cross-interaction between battery cells can help improve the uniformity of temperature distribution.
Figure 11 shows the relationship between average module temperature and pressure drop for the couple Configuration. The simulation results show that the average module temperature decreases from 36.7℃ at an airflow rate of 3 L/s to 32.9℃ at 21 L/s. The relatively small temperature drop indicates that the temperature distribution becomes more uniform. In contrast, the pressure drops increase sharply from about 4.8 Pa at 3 L/s to 185.1 Pa at 21 L/s. In the couple configuration, the pressure drop value tends to be higher at large flow rates than in the inline configuration because the air path has turns and constrictions that can increase the flow resistance.
In general, a comparison between the inline and couple configurations shows that the inline arrangement has a lower pressure drop and is able to reduce the average module's temperature slightly more effectively. Therefore, the configuration settings on the battery play an important role in distributing the temperature so that it is more evenly distributed. This is evident from the results of this study, which show that the battery configuration can cause stability at the maximum temperature in the battery; as a result, the battery has the potential to have a longer service life due to a reduction in the temperature difference between battery cells. Ji and Zhang [23] have shown that setting the distance between cells in the battery can improve cooling efficiency and reduce temperature non-uniformity in the battery. From the results, it was found that the more even the temperature distribution inside the battery modules, the better their performance stability and the longer their life. However, this improvement comes with the consequence of increased pressure drop and greater power requirements.
Based on the results of this study, it can be concluded that there is a significant difference in evaluating the performance of the air-cooling system on a prismatic battery module consisting of 12 cells, with two cell arrangement configurations: in line and in pairs. To examine the effect of flow rate variation on module temperature distribution and pressure drop along the airflow path, we used various variations of airflow rates of 3 L/s, 12 L/s, and 21 L/s. At a flow rate of 3 L/s, the temperature difference between cells was recorded at 5.46℃ for the inline configuration and 3.63℃ for the pair configuration. Meanwhile, increasing the airflow rate from 3 L/s to 21 L/s reduced the average module temperature from 36.7℃ to 32.9℃ in the inline configuration, and from 31.7℃ to 30.0℃ in the pair configuration. However, this increase was accompanied by a significant spike in pressure drop, from 3.4 Pa to 145.3 Pa for the inline configuration, and from 4.8 Pa to 185.1 Pa for the pair configuration. A comparison between the two configurations shows that the paired arrangement tends to provide a more uniform temperature distribution, albeit with a relatively higher increase in pressure drop compared to the inline arrangement. These findings provide important recommendations for the development of battery thermal management systems, especially for simple cooling methods with low airflow rates.
The results of this study provide practical guidance in selecting prismatic battery module configurations based on air cooling performance. The couple configuration is recommended for applications that require temperature uniformity and high thermal stability, such as in energy storage systems and electric vehicles. In contrast, the inline configuration is suitable for systems with moderate cooling requirements or flow space limitations. This research is still limited to one condition of ambient temperature and fixed inter-cell spacing, and has not been experimentally validated. Therefore, further studies need to be conducted to examine the effect of temperature variation, inter-cell spacing, as well as air duct optimization through experimental studies.
|
CFD |
computational fluid dynamics |
|
3D |
three-dimensional |
|
RNG |
re-normalization group |
|
NMC |
nickel-manganese-cobalt |
|
Ah |
ampere-hour |
|
DOD |
depth of discharge |
|
Greek symbols |
|
|
$\rho$ |
air density, kg/m³ |
|
$V$ |
velocity vector, m/s |
|
$P$ |
static pressure, N/m² |
|
$C_p$ |
specific heat, J/kg·C |
|
$\mu$ |
dynamic viscosity, kg. m-1.s-1 |
|
$k$ |
thermal conductivity, W/m·C |
|
T |
temperature, ℃ |
|
$Q_{\text {gen }}$ |
rate of heat generation, J/s |
[1] Saber, N., Richter, C.P., Unnthorsson, R. (2025). Review of thermal management techniques for prismatic Li-Ion batteries. Energies, 18(3): 492. https://doi.org/10.3390/en18030492
[2] Shastri, D.S., Mahajan, M.R., Sur, A., Bhatkar, V.W. (2025). Electric vehicle battery cooling using phase change materials and nanofluids. International Journal of Heat and Technology, 43(3): 989-996. https://doi.org/10.18280/ijht.430317
[3] Macdonald, M.P., Chandrasekaran, S., Garimella, S., Fuller, T.F. (2021). Thermal runaway in a prismatic lithium ion cell triggered by a short circuit. Journal of Energy Storage, 40: 102737. https://doi.org/10.1016/j.est.2021.102737
[4] Wang, B., Zhou, Z., Li, L., Peng, Y., Cao, J., Yang, L., Cao, B. (2022). Experimental study on thermal runaway and its propagation of large format prismatic lithium-ion batteries. Journal of Energy Storage, 55: 105550. https://doi.org/10.1016/j.est.2022.105550
[5] Akbarzadeh, M., Kalogiannis, T., Jaguemont, J., Jin, L., Behi, H., Karimi, D., Beheshti, H., Van Mierlo, J., Berecibar, M. (2021). A comparative study between air cooling and liquid cooling thermal management systems for a high-energy lithium-ion battery module. Applied Thermal Engineering, 198: 117503. https://doi.org/10.1016/j.applthermaleng.2021.117503
[6] Pesaran, A.A. (2002). Battery thermal models for hybrid vehicle simulations. Journal of Power Sources, 110(2): 377-382. https://doi.org/10.1016/S0378-7753(02)00200-8
[7] Al-Zareer, M., Dincer, I., Rosen, M.A. (2017). Novel thermal management system using boiling cooling for high-powered lithium-ion battery packs for hybrid electric vehicles. Journal of Power Sources, 363: 291-303. https://doi.org/10.1016/j.jpowsour.2017.07.067
[8] Garud, K.S., Tai, L.D., Hwang, S.G., Nguyen, N.H., Lee, M.Y. (2023). A review of advanced cooling strategies for battery thermal management systems in electric vehicles. Symmetry, 15(7): 1322. https://doi.org/10.3390/sym15071322
[9] Zhang, S.B., He, X., Long, N.C., Shen, Y.J., Gao, Q. (2023). Improving the air-cooling performance for lithium-ion battery packs by changing the air flow pattern. Applied Thermal Engineering, 221: 119825. https://doi.org/10.1016/j.applthermaleng.2022.119825
[10] Alzwayi, A., Paul, M.C. (2024). Effective battery pack cooling by controlling flow patterns with vertical and spiral fins. Thermal Science and Engineering Progress, 55: 102907. https://doi.org/10.1016/j.tsep.2024.102907
[11] Ji, C., Wang, B., Wang, S., Pan, S., Wang, D., Qi, P., Zhang, K. (2019). Optimization on uniformity of lithium-ion cylindrical battery module by different arrangement strategy. Applied Thermal Engineering, 157: 113683. https://doi.org/10.1016/j.applthermaleng.2019.04.093
[12] Chen, K., Yang, L., Chen, Y., Wu, B., Song, M. (2024). Efficient design of battery thermal management systems for improving cooling performance and reducing pressure drop. Energies, 17(10): 2275. https://doi.org/10.3390/en17102275
[13] Kirad, K., Chaudhari, M. (2021). Design of cell spacing in lithium-ion battery module for improvement in cooling performance of the battery thermal management system. Journal of Power Sources, 481: 229016. https://doi.org/10.1016/j.jpowsour.2020.229016
[14] Wang, T., Tseng, K.J., Zhao, J., Wei, Z. (2014). Thermal investigation of lithium-ion battery module with different cell arrangement structures and forced air-cooling strategies. Applied Energy, 134: 229-238. https://doi.org/10.1016/j.apenergy.2014.08.013
[15] Zhao, J., Rao, Z., Huo, Y., Liu, X., Li, Y. (2015). Thermal management of cylindrical power battery module for extending the life of new energy electric vehicles. Applied Thermal Engineering, 85: 33-43. https://doi.org/10.1016/j.applthermaleng.2015.04.012
[16] Mustafa, J. (2022). Effect of inlet and outlet size, battery distance, and air inlet and outlet position on the cooling of a lithium-ion battery pack and utilizing outlet air of cooling system to heat an air handling unit. Journal of Energy Storage, 46: 103826. https://doi.org/10.1016/j.est.2021.103826
[17] Pan, Z., Zhi, M., Yuan, L., Xu, Q., Sun, Q., Chen, X. (2025). Study on the effect of air velocity and duct area on the heat dissipation of lithium-ion batteries. Batteries, 11(2): 43. https://doi.org/10.3390/batteries11020043
[18] Mansor, M.S.A., Ghazali, A.D., Ardani, M.I., Hussin, M., et al. (2023). Forced air cooling for battery module on series connected batteries: Temperature variation due to non-uniform flow across channel. Journal of Advanced Research in Fluid Mechanics and Thermal Sciences, 111(1): 226-236. https://doi.org/10.37934/arfmts.111.1.226236
[19] Gogoi, B., Deka, H., Bora, B.J., Paramasivam, P., Kamangar, S., Arabi, A.I.A., Razak, A., Wodajo, A.W. (2025). Optimizing thermal performance in air-cooled Li-ion battery packs with vortex generators for cleaner energy storage. Scientific Reports, 15(1): 25477. https://doi.org/10.1038/s41598-025-03134-0
[20] Joshi, A., Banerjee, R., Sreedhar, N., Kottayat, N. (2025). A comparative study on cylindrical and prismatic lithium-ion batteries: Thermo-hydraulic performance and entropy generation analysis for efficient cooling. CFD Letters, 17(11): 187-203. https://doi.org/10.37934/cfdl.17.11.187203
[21] Batista, R.C., Rajendran, R.C. (2023). Computational analysis of thermal performance augmentation in helical coil heat exchangers via CuO/water nanofluid. Power Engineering and Engineering Thermophysics, 2(3): 139-149. https://doi.org/10.56578/peet020302
[22] Bergman, T.L. (2011). Fundamentals of Heat and Mass Transfer. John Wiley & Sons.
[23] Ji, Z., Zhang, C. (2024). Study on the impact of battery pack arrangement on temperature uniformity distribution. Sustainable Energy and Fuels, 8(19): 4519-4532. https://doi.org/10.1039/d4se00459k