Leilei Zhang![]() | Yihan Xu
| Yihan Xu![]() | Taotao Song
| Taotao Song![]() | Yuping Chen
| Yuping Chen![]() | Tingting Zhang
| Tingting Zhang![]() | Hangyun Wang*
| Hangyun Wang*![]()
© 2025 The authors. This article is published by IIETA and is licensed under the CC BY 4.0 license (http://creativecommons.org/licenses/by/4.0/).
OPEN ACCESS
This study investigates the migration and retention behavior of suspended particles during the filtration process in porous media. A microfluidic experimental platform with microscopic visualization was constructed, and three representative particle sizes were selected under different concentrations and injection speeds. The study systematically examines three types of blocking mechanisms—adhesive retention, mechanical trapping, and suspension stagnation—and their synergistic effects within pore throats. The results indicate that larger particles tend to mechanically embed at the inlet pore throats and rapidly form bridging blockages. Particles of medium size are more prone to form multi-particle collaborative bridges at constrictions in the pore throat, demonstrating a dynamic balance between migration and retention, which can induce deep blockage. Smaller particles primarily undergo deep filtration and surface attachment, leading to a continuous and uniform reduction in permeability. Higher concentrations significantly intensify the blockage strength and accelerate pressure rise. At low injection speeds, stable deposition is favored, triggering persistent pressure accumulation, whereas high speeds result in more dispersed blockage locations. The study provides experimental evidence and mechanistic support for the optimization of porous media materials and the matching of operational parameters.
porous media, particle migration, blocking mechanisms, microfluidics, particle size effects
Porous media play a key role in various engineering and environmental fields, such as groundwater recharge, oil extraction, wastewater treatment, and air filtration systems. These media typically consist of complex pore networks that allow fluids and particles to pass through, thereby achieving filtration functions. However, during the filtration process, the deposition and accumulation of particles often lead to pore clogging, which significantly reduces the permeability and overall performance of the media. This phenomenon not only affects the long-term stability and efficiency of the system but may also result in environmental pollution or resource waste [1, 2]. In ultra-low-permeability reservoirs, microfluidic and core-scale NMR experiments further demonstrate that poor compatibility between injection and formation water can generate CaCO₃-rich scale microcrystals that undergo precipitation–migration–reprecipitation cycles in pore throats, shrink the median pore radius by more than 20%, and cause a multi-stage permeability loss exceeding 50% [3]. Meanwhile, the new generation of flow and transport models based on data-driven methods is rapidly developing, providing more refined predictive tools for fluid-particle coupling behavior in complex pore networks [4].
At the microscopic level, the restricted geometry of pore throats and hydrodynamic conditions jointly drive critical clogging and time-varying flux attenuation. Experimental and theoretical studies have revealed significant differences in clogging dynamics between homogeneous and heterogeneous media [2, 5], which are closely related to pore-size distributions and permeability variations governed by grain size distributions in conglomerate reservoirs [6]. The discrete element method (DEM) and CFD-DEM methods further provide insights into the micro-scale coordination rearrangement, stress chain, and arch formation corresponding to the clogging-unclogging cycle mechanism, and reveal the progressive clogging path dominated by dendritic build-up [7, 8]. In terms of operational conditions, the flow velocity and particle size distribution jointly control the time-varying responses of invasion depth, deposition morphology, and permeability [9-11]. Previous studies have shown that an increase in flow velocity accelerates particle migration through the porous medium, thereby affecting the particle deposition depth and morphology. In particular, under high flow velocity conditions, particles have a shorter residence time, resulting in thinner deposition layers [12]. Furthermore, the width and standard deviation of the particle size distribution significantly influence the particle capture probability and deposition behavior [13]. On the macro modeling side, deep bed filtration and filter cake filtration models have continuously evolved, introducing the concepts of deposition-erosion competition, porosity evolution, and mobile/immobile particle grouping within a unified framework to characterize permeability decay and pressure drop growth [14-16]. Meanwhile, the development of multimodal imaging techniques, such as X-ray μCT and pore-scale flow MRI, has made the "visualization-computation-verification" feedback loop of pore structure and flow field possible and has been applied in scenarios such as aquifer recharge [17, 18]. Combining pore-scale microfluidic visualization with online NMR, recent high-pressure water injection studies in tight sandstone have clarified how coupled pressure-driven flow and spontaneous imbibition reconstruct clustered residual oil into columnar and film-like configurations, drive oil migration from micropores to larger pores, and deliver an additional recovery of about 17–18% [19]. Parallel research in fiber filtration has clarified the efficiency-resistance tradeoff through loading models, microscopic collisions, and structural statistics (e.g., fiber length distribution), providing cross-material references for the clogging mechanism in porous media [20-23]. In addition, microfluidic investigations of surfactant–polymer solutions across different pore structures identify pore-structure-dependent optimal viscosity windows and provide pore-to-Darcy-scale insights into enhanced oil recovery efficiency [24].
Based on the above understanding, this paper constructs a micro-visualization experimental platform and a differential pressure measurement system, systematically examining three core factors—particle size, concentration, and filtration velocity—focusing on the clogging mechanisms such as particle attachment retention, mechanical trapping, and suspension stagnation in pore throats, and their synergistic effects. It presents the parameterized laws of permeability decay and clogging morphology.
2.1 Experimental setup
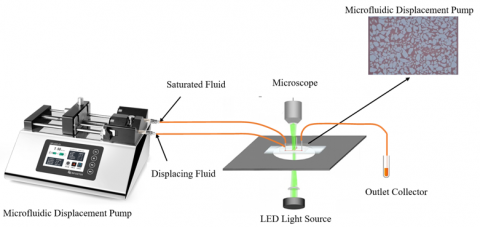
The experimental equipment includes a Nikon SMZ-745T optical microscope, SP-4KCH-IV high-speed camera (CCD), SPC/ZU-I microfluidic displacement pump, BoliGe Luer Lock syringe, glass microfluidic chip, PEEK tubing, LED cold light source, CYYZ31A pressure sensor transmitter, differential pressure transmitter, and data acquisition system, as shown in Figure 1. The experimental platform is constructed as follows.
Figure 1. Microfluidic experimental platform
The entire experimental setup consists of two core modules: the fluid driving module and the microscopic observation module. The core equipment for the fluid control part is the microfluidic displacement pump, which can precisely control the liquid flow state in the experimental system.
The microscopic observation system consists of optical magnification equipment and high-speed image recording devices. The microscope is equipped with a 10× eyepiece, and by switching to different objective lenses (up to 400× magnification), it can adapt to the observation needs of microfluidic chips with various specifications. To ensure observation quality, an LED cold light source illumination system is installed above and below the microscope stage. For image acquisition, the high-speed camera is coupled with the optical path of the microscope, allowing real-time microchannel flow images to be transmitted to the computer system for visual monitoring and data storage.
Meanwhile, the differential pressure across the chip’s input port is monitored in real-time using the pressure sensor transmitter, differential pressure transmitter, and data acquisition system, in order to observe the fluid equilibrium point and pressure variations.
2.2 Experimental materials and preparation
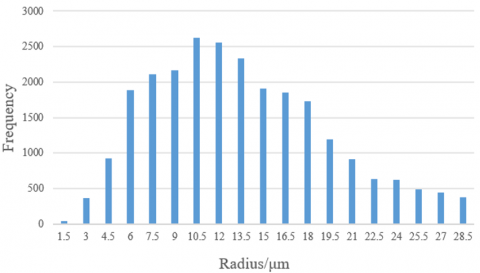
Experimental Model: A glass microfluidic chip is used to simulate porous media. The chip specifications are 6000 μm in length, 4000 μm in width, and the pore throat radius ranges from 1 to 50 μm. The model and pore throat radius distribution are shown in Figures 2 and 3.
Figure 2. Microfluidic model diagram
Figure 3. Pore throat radius histogram
Experimental Water: Deionized water was used, and the experiment was carried out at room temperature (25℃). The viscosity of the deionized water is 0.89 mPa·s. To clearly observe the clogging characteristics, a 2000 ppm red water-soluble dye was added to the deionized water.
Experimental Suspended Particles:
•800-mesh calcined kaolin particles
•2000-mesh calcined kaolin particles
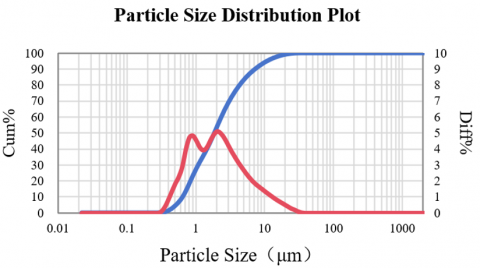
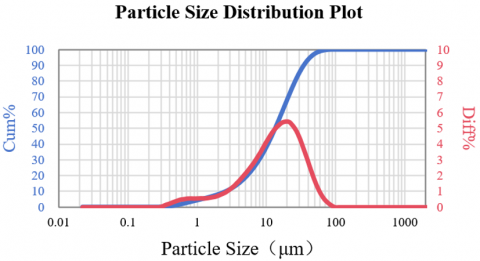
•4000-mesh calcined kaolin particles (The particle size distribution is shown in Figure 4).
(a) 4000-mesh
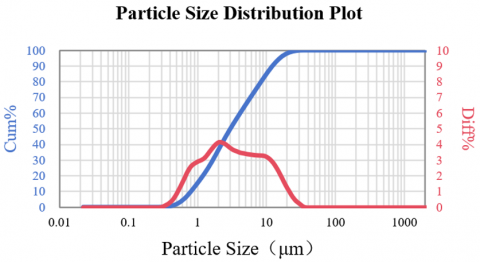
(b) 2000-mesh
(c) 800-mesh
Figure 4. Calcined kaolin particle size measurement report
2.3 Experimental plan
To investigate the migration and retention behavior of particles in porous media, this experiment designed multiple sets of experimental conditions as shown in Table 1, controlling variables such as particle size, concentration, and injection flow rate, so as to systematically analyze the effects of particle properties and hydraulic conditions on their migration and retention mechanisms in porous media.
Table 1. Pollutants injected into water
|
No. |
Particle Size (μm) |
Concentration (mg/L) |
Flow Rate (μL/min) |
|
1 |
13.37 |
10 |
20 |
|
2 |
13.37 |
15 |
20 |
|
3 |
2.987 |
15 |
20 |
|
4 |
2.987 |
15 |
10 |
|
5 |
1.858 |
10 |
20 |
|
6 |
1.858 |
15 |
20 |
2.4 Experimental procedure
The main experimental steps are as follows:
(1) Experiment Setup: Before starting the experiment, the pipeline is connected according to the designed experimental flowchart to set up the microfluidic system platform. During the setup process, attention is paid to the standardization of pipeline connections, and a leak-tightness test is conducted before the experiment to ensure the sealing of the microfluidic system.
(2) Injection Pump Setup: The microfluidic chip is fixed on the XYZ-axis lift stage, and PEEK tubing is used to connect the chip to the syringe, which is securely fixed on the injection pump.
(3) Imaging Setup: The microscope is connected to the high-speed CCD camera; the light source is aligned with the microfluidic chip to ensure that the high-speed CCD imaging can be displayed on the computer.
(4) Operation Process: The microfluidic chip is adjusted using the XYZ-axis lift stage so that the channel appears at the center of the microscope field. Then, the CCD's focus, frame rate, exposure time, and light source brightness are adjusted to ensure that the image of the microfluidic chip’s channel is clearly displayed in the center of the computer screen. The pressure detection software is also started.
(5) Pre-treatment (1 hour): The syringe filled with dyed deionized water is installed on the micro-injection pump. The syringe is connected to the microfluidic chip’s liquid-phase inlet via a capillary tube. The micro-injection pump is started, and the dyed deionized water is injected into the porous media area through the inlet. After the porous media area is filled with deionized water, injection continues until the pressure stabilizes, and the saturation process is completed.
(6) Injection of Polluted Water for Displacement (8 hours): The injection water is replaced to drive the displacement process, and the water is injected until the pressure stabilizes.
3.1 Particle clogging characteristics analysis
According to the particle size measurement report, the suspended solid particle system exhibits a typical normal distribution, with a broad particle size range. In this polydisperse particle system, different particle size components can cause clogging at the pore throat positions when passing through porous media. To further explore the particle clogging behavior and the particle size effect, the study constructs a visual pore structure model using microfluidic chip technology and uses a high-speed microscopic imaging system to capture the dynamic process of particle migration and retention in real-time. The clogging characteristics, clogging structure formation mechanisms, and clogging stability differences of particles of different sizes at the pore throat are systematically analyzed.
By observing the migration and retention behavior of suspended solid particles in the microscopic pore throat structure of the filtration medium, it is found that the clogging mechanism is mainly dominated by three basic action modes: particle surface attachment retention, mechanical trapping at the pore throat, and suspension stagnation inside the pores. The first two actions have a primary triggering effect on the clogging process.
During the dynamic filtration process, when the fluid carrying particles flows through the pore throat structure, the particle surface attachment retention phenomenon first occurs. Due to the surface charge of the pore throat wall, van der Waals forces, or chemical adsorption, some particles overcome the fluid shear force and adhere to the pore throat wall. This continuous surface deposition causes the effective flow pore size to gradually shrink, forming initial local clogging points (Figure 5(a)).
As the pore size decreases, the mechanical trapping effect at the pore throat is enhanced. When the particle size approaches or exceeds the characteristic size of the pore throat, particles become directly trapped at the narrow part of the throat, forming a bridging effect. This mechanical trapping has a significant amplification effect — the retention of a single particle triggers the chain accumulation of subsequent particles, ultimately forming a dense particle cake layer at the pore throat (Figure 5(b)). At this point, the cross-sectional area of the flow path decreases sharply, and the resistance to fluid flow increases significantly.
(a) Early filtration
(b) Late filtration
(c) Suspension retention
Figure 5. Particle clogging characteristics diagram
Meanwhile, in the low-flow regions of the pore space, due to insufficient shear force in the flow field to maintain particle suspension, some particles undergo suspension stagnation due to gravity sedimentation or collisions from Brownian motion. These stagnated particles do not directly clog the main flow path but indirectly increase the particle deposition efficiency at the pore throat by altering the local flow field distribution (Figure 5(c)).
Among the three mechanisms, surface attachment retention and mechanical trapping at the pore throat have significant synergistic effects. The former promotes mechanical trapping by altering surface roughness, while the latter increases the probability of subsequent particle attachment through flow path contraction. This positive feedback mechanism ultimately leads to the formation of three-dimensional particle accumulations in the pore network. When the connectivity of these accumulations reaches a critical state, the filtration system enters the complete clogging stage.
3.2 The effect of different particle diameters on migration and clogging in porous media
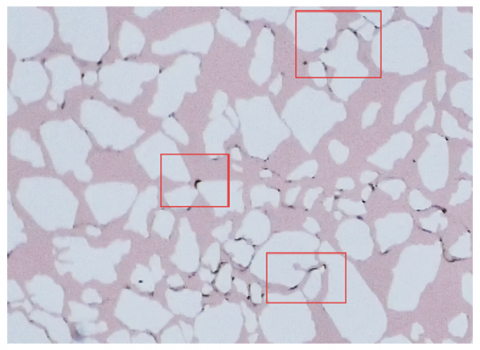
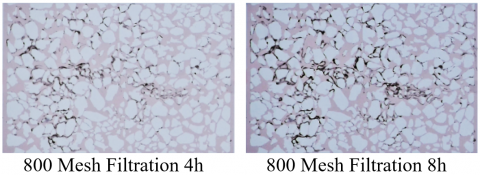
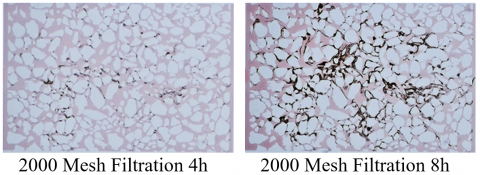
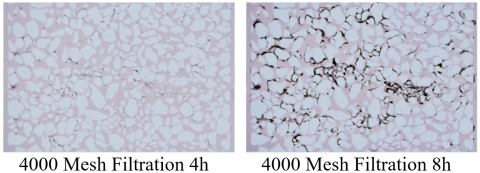
Through visual observation and dynamic pressure response analysis, the clogging behavior of kaolin particles of different mesh sizes in the filtration system shows significant differences (Figure 6), specifically:
(1) 800 Mesh Large Particles (13.37 μm): The clogging mechanism is dominated by mechanical trapping. In the initial stage of filtration, particles larger than the pore throat size mechanically embed at the pore entrance of the porous medium, as shown in Figure 6(a), forming a local dense clogging layer. This process directly blocks the fluid path and causes a sharp pressure increase. As time progresses, fine particles in the mixed system generate secondary effects in the deep pore spaces: first, they reduce the effective pore radius through surface adsorption, and then they promote the formation of bridging clogging in the restricted spaces, ultimately leading to a decline in permeability in the later stages of filtration.
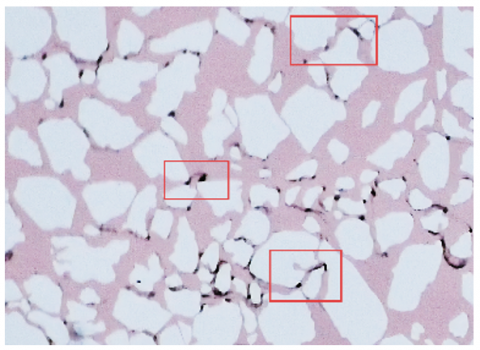
(2) 2000 Mesh Medium Particles (2.987 μm): These particles exhibit dynamic migration-retention equilibrium characteristics. With improved compatibility between particle size and pore throat, some particles can break through the front filtration zone and migrate further into the system, as shown in Figure 6(b). In this process, particles form multi-particle cooperative bridges at constriction points in the pore throats due to the combined effects of electrostatic forces and fluid shear forces. Over time, deep clogging develops in the porous medium. This clogging mode is spatially expansive, causing simultaneous pore blockage in different sections of the filtration system.
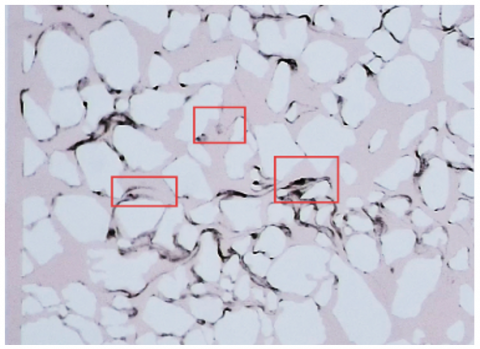
(3) 4000 Mesh Small Particles (1.858 μm): These particles exhibit high flow resistance at the beginning of injection, primarily due to their strong deep filtration effect and the sustained wall attachment driven by Brownian motion. As the attached layer accumulates and thickens, its effect on modifying the pore structure becomes more prominent, ultimately leading to uniform clogging through systematic pore narrowing, as shown in Figure 6(c). Compared to the immediate bridging effect in large particles, the clogging pattern in small particles shows a significant oscillatory increase due to secondary sedimentation, and in the later stages of the experiment, the pressure surpasses that of the medium and large particle systems.
The differentiated behaviors of particles at different sizes indicate that the spatial coupling of mechanical trapping, bridging effect, and attachment retention mechanisms jointly determine the overall clogging evolution process of the filtration system.
Figure 6. Filtration results of suspended solid particles of different sizes (Experiments 2/3/6)
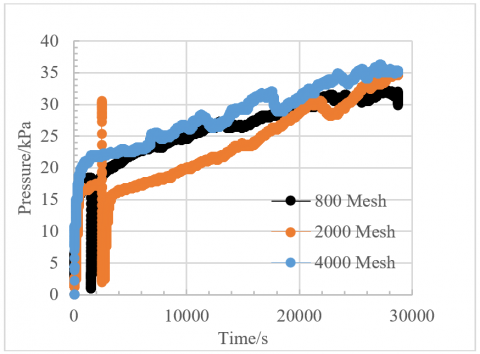
Based on the analysis of the injection pressure curve characteristics (Figure 7), the pressure evolution of different particle size systems shows significant differences:
The large particle (800 Mesh) system shows pressure fluctuations at the initial stage of the experiment. This is because the filtration chip is pre-filled with dyed liquid during pre-treatment, and the liquid needs a certain initial driving force to begin filtering in the capillaries of the filtration pores. After this, the curve rises at a relatively steady rate, with a clear pressure inflection point marking the initial filtration point. In the 0-25 minute period, the initial filtration points for the 800 Mesh, 2000 Mesh, and 4000 Mesh experiments were 18 kPa, 16 kPa, and 22 kPa, respectively. As time progresses, after 4 hours, the pressures in all three experiments increase to 1.5 times the initial filtration point. After that, the slope of the pressure curve increases, and the pressure rises more rapidly due to clogging within the system, leading to reduced filtration permeability. At the end of the experiment, the pressure in the large particle system stabilizes, and the filtration clogging reaches stability. In contrast, the medium and small particle groups continue to experience rising pressure, exceeding 1.5 times the initial filtration point, indicating that filtration and clogging are still ongoing.
Large particles (800 Mesh) rapidly cause mechanical trapping at the front end of the filtration, leading to a significantly higher initial pressure than the medium and small particle systems when the system stabilizes. During the filtration process of large particles, the embedded clogging formed at the pore throat entrance at the front end causes the pressure rise to slow and stabilize, reflecting a sharp decline in permeability and complete blockage of the flow path. The medium particle (2000 Mesh) system, due to the multi-particle cooperative bridging effect, leads to systematic pore radius reduction. Although its initial pressure is lower than that of the large particle system, the pressure increase accelerates significantly in the later stages of the experiment, eventually surpassing the injection pressure level of the large particle system at the same time. Small particle (4000 Mesh) systems exhibit the highest flow resistance at the beginning of injection, not only due to the initial blocking effect but also due to continued multi-particle cooperative bridging and secondary sedimentation. As a result, the pressure increases at a faster rate in the later stages of the experiment, showing an oscillatory rise throughout the injection process, ultimately surpassing the pressure levels of the medium and large particle systems at the same time.
Figure 7. Pressure curves of particles of different sizes
3.3 The effect of different injection speeds on migration and clogging in porous media
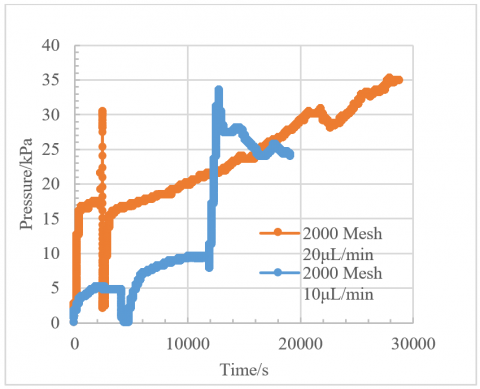
Figure 8 shows the dynamic pressure variation inside the filtration chip at two injection speeds (20 μL/min and 10 μL/min) for 2000 mesh medium-sized particles. The experimental results show that the difference in injection speed affects the migration mechanism and retention behavior in a phased manner.
Figure 8. Injection pressure curves of particle water (2000 Mesh) at different injection speeds 2000 Mesh 10 μL/min 2000 Mesh 20 μL/min
In the initial filtration stage, both injection speeds exhibit rapid pressure fluctuations, characterized by a short-term increase followed by a decrease. The initial pressure fluctuation at the 20 μL/min high-speed injection is significantly higher than at the 10 μL/min low-speed injection. This is related to the instantaneous accumulation effect of particles at the inlet of the filter material due to the high injection speed. During this stage, particles are mainly captured by the surface structure of the filter material through the mechanical trapping mechanism, with the particle size and pore matching directly influencing the retention efficiency.
As the filtration enters the middle stage, the pressure in the 10 μL/min system shows a steady increase, indicating that particles gradually form a uniform retention distribution inside the filtration chip. The 20 μL/min system, however, exhibits noticeable non-steady-state characteristics, with the pressure curve showing periodic fluctuations, reflecting the dynamic process of particle aggregation and de-aggregation during migration inside the filtration chip. This difference arises from the enhanced inter-particle interactions under high concentrations, where bridging effects form temporary clogging structures that partially dissociate under fluid action.
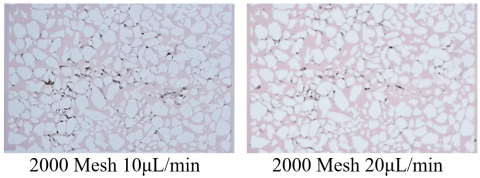
In the later filtration stages, the pressure accumulation in the 10 μL/min system exceeds that of the 20 μL/min system. The clogging condition is as shown in Figure 9. Mechanism analysis shows that at the low injection speed, particles gradually reduce the effective flow cross-section through continuous deep pore retention, while the dense accumulation layer formed at the early stage of high-speed injection may alter the flow field distribution inside the filter material, promoting secondary migration of some particles.
Through experimental research, it is revealed that particle concentration, by regulating the competition between particle-wall interactions and particle-particle interactions, dominates the deep filtration characteristics of the retention behavior during the filtration process. High injection speeds accelerate the formation of clogging at the pore throats, while low injection speeds achieve a more sustained pressure accumulation effect through progressive deep retention. This rule provides important reference for the performance optimization of filtration systems.
Figure 9. Clogging of medium-sized particles at different injection speeds
3.4 The effect of different particle concentrations on migration and clogging in porous media
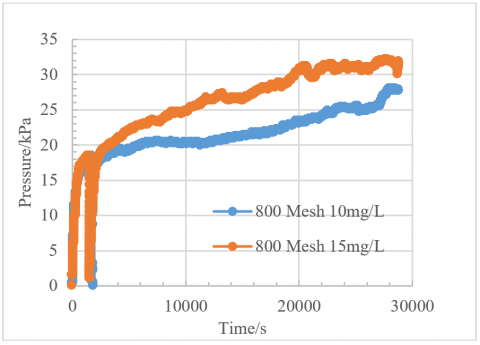
(1) The Effect of Different Concentrations of Particles on Injection Pressure in 800 Mesh Particles
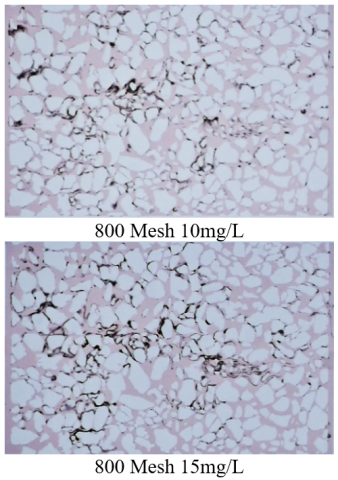
Under the 800 mesh particle condition, the experiment compares concentrations of 10 mg/L and 15 mg/L. From the pressure curve graph (Figure 10), it can be seen that the initial filtration points of both experimental groups are around 18 kPa. Over time, both concentrations cause the injection pressure to gradually rise. The orange curve corresponding to the 15 mg/L concentration shows a significantly higher pressure increase compared to the blue curve for the 10 mg/L concentration. This is because particles at higher concentrations generate mechanical trapping and bridging effects faster in the filtration chip, with more particles involved in the clogging process, leading to the faster occupation of the filtration path and a more rapid increase in pressure. In the initial stage, the pressure rise rates of both are similar, but as time progresses, the gap gradually widens, indicating that as the filtration process continues, the influence of concentration on pressure becomes more significant. At the same time, for the same time duration, the higher the concentration, the shorter the filtration duration. Ultimately, the injection pressure in both experimental groups rises to about 1.6 times the initial filtration point and continues to rise. Based on Figure 11, the clogging is not severe, indicating that filtration is still ongoing.
Figure 10. Injection pressure curves of large particles at different concentrations
Figure 11. Clogging of large particles at different concentrations
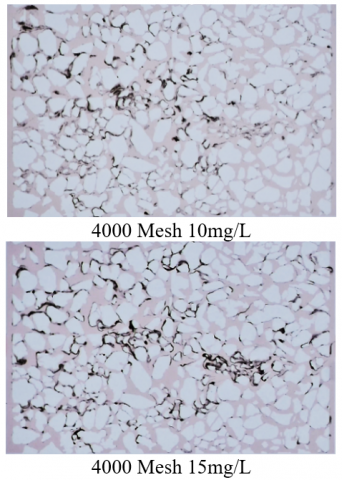
Figure 12. Injection pressure curves of small particles at different concentrations
Figure 13. Clogging of small particles at different concentrations
(2) The Effect of Different Concentrations of Particles on Injection Pressure in 4000 Mesh Particles
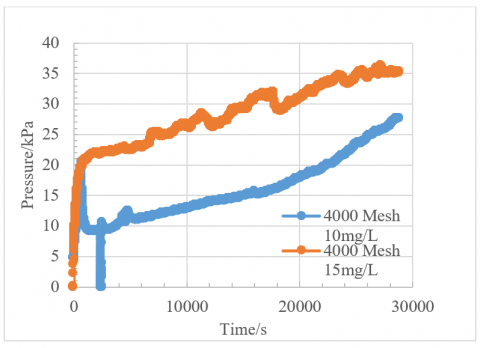
For the 4000 mesh particle size, concentrations of 10 mg/L and 15 mg/L were also tested. As shown in Figure 12, the initial filtration point for the 15 mg/L experimental group is around 22 kPa, while the initial filtration point for the 10 mg/L experimental group is around 9 kPa. The initial filtration point for the high-concentration filtration liquid is clearly higher. Eventually, the injection pressure rises to more than twice the initial filtration point and continues to increase, which can be analyzed as follows.
With a smaller particle size of 4000 mesh, particles are more likely to enter the internal pores of the porous medium (as shown in Figures 2-13). The injection pressure for the 15 mg/L concentration increases much faster than for the 10 mg/L concentration, as indicated by the orange curve in Figures 2-13. This is because, at higher concentrations, a relatively larger number of small particles are present, and these particles will more densely adhere to the pore walls or form attachment retention in the pore throats, rapidly reducing the effective filtration channel area, leading to a sharp rise in pressure. Moreover, compared to the 800 mesh particle size, the pressure rise difference caused by the same concentration difference (comparing 10 mg/L and 15 mg/L) is more significant at the 4000 mesh particle size, as the clogging effect of small particles is further amplified at high concentrations.
(3) Comparison of the Effect of Concentration on Pressure for Different Particle Sizes
Comparing 800 mesh and 4000 mesh particles, for the same concentration change (from 10 mg/L to 15 mg/L), the pressure rise for the porous medium at 4000 mesh is greater. This is because the small 4000 mesh particles not only accumulate at the front of the filtration but also penetrate deep into the filtration material, clogging the pores through attachment retention, bridging, and other mechanisms. Their clogging mechanism is more complex and efficient. In contrast, 800 mesh large particles mainly form a cake layer through mechanical trapping at the surface of the filter material to increase pressure, resulting in a relatively slower clogging rate. Therefore, the effect of concentration change on the injection pressure of the porous medium is more pronounced at 4000 mesh, with both the pressure rise rate and the final pressure value being higher.
Overall, regardless of whether it is 800 mesh or 4000 mesh, an increase in particle concentration accelerates the rise in injection pressure of the porous medium. However, for the 4000 mesh small particles, the pressure is more significantly affected by concentration changes.
(1) The clogging in porous media is dominated by the coupling of attachment retention, mechanical trapping, and suspension stagnation mechanisms. Attachment and trapping exhibit a positive feedback effect, promoting the formation of three-dimensional accumulations and rapid permeability decline.
(2) Particle size matching determines the dominant clogging mechanism: large particles tend to cause mechanical embedding at the inlet, medium particles form cooperative bridges and induce deep clogging, and small particles mainly engage in deep filtration and surface attachment, resulting in oscillatory rises with more significant clogging.
(3) Increasing concentration significantly amplifies clogging intensity and pressure rise rate. Small particles are more sensitive to concentration changes and exhibit a nonlinear response.
(4) Low injection speed is conducive to stable deposition and sustained pressure accumulation, while high injection speed weakens intensity but causes more dispersed clogging distribution.
[1] Mays, D.C., Hunt, J.R. (2005). Hydrodynamic aspects of particle clogging in porous media. Environmental Science & Technology, 39(2): 577-584. https://doi.org/10.1021/es049367k
[2] Wyss, H.M., Blair, D.L., Morris, J.F., Stone, H.A., Weitz, D.A. (2006). Mechanism for clogging of microchannels. Physical Review E, 74: 061402. https://doi.org/10.1103/PhysRevE.74.061402
[3] Gong, Z., Zhang, L., Zhang, T., Yan, Z., Cong, S., Zhou, Z., Kong, D. (2024). Evaluation of the compatibility between formation and injection water in ultra-low permeability reservoirs. Processes, 12(11): 2475. https://doi.org/10.3390/pr12112475
[4] Yang, G., Xu, R., Tian, Y., Guo, S., Wu, J., Chu, X. (2024). Data-driven methods for flow and transport in porous media: A review. International Journal of Heat and Mass Transfer, 235: 126149. https://doi.org/10.1016/j.ijheatmasstransfer.2024.126149
[5] Shen, J., Ni, R. (2017). Experimental investigation of clogging dynamics in homogeneous porous medium. Water Resources Research, 53(3): 1879-1890. https://doi.org/10.1002/2016WR019421
[6] Gao, W.B., Li, Y.Q., Kong, D.K., Luan, H.X., Chen, X., Qi, H., Tang, X. (2023). Effect of grain size distribution on pore size distribution characteristics in a conglomerate reservoir from an alluvial fan via artificial rock approach. SPE Journal, 28(6): 3063-3078. https://doi.org/10.2118/217426-PA
[7] Yin, Y., Cui, Y., Jing, L. (2024). Clogging and unclogging of fine particles in porous media: Micromechanical insights from an analog pore system. Water Resources Research, 60(1): e2023WR034628. https://doi.org/10.1029/2023WR034628
[8] Okaybi, W., Roman, S., Soulaine, C. (2025). Progressive colloidal clogging mechanism by dendritic build-up in porous media. Soft Matter, 21: 5687-5698. https://doi.org/10.1039/D5SM00285K
[9] Chang, S.B. (2023). Influence of ionic wind in micro electrostatic precipitator on internal air flow characteristics. International Journal of Heat and Technology, 41(1): 87-94. https://doi.org/10.18280/ijht.410109
[10] Sun, D. (2024). Microscale study on dynamics of particles in slurry filtrated through porous media. Computational Particle Mechanics, 11(2): 745-755. https://doi.org/10.1007/s40571-023-00650-6
[11] Won, J., Lee, J., Burns, S.E. (2021). Upscaling polydispersed particle transport in porous media using pore network model. Acta Geotechnica, 16(2): 421-432. https://doi.org/10.1007/s11440-020-01038-z
[12] Sun, D. (2023). Hydrodynamics and effect of velocity on particle filtration due to bridging in water-saturated porous media using CFD–DEM simulation. Environmental Science and Pollution Research, 30(44): 100124-100136. https://doi.org/10.1007/s11356-023-29398-5
[13] Li, Z., Yang, H., Sun, Z., Espinoza, D.N., Balhoff, M.T. (2021). A probability-based pore network model of particle jamming in porous media. Transport in Porous Media, 139(2): 419-445. https://doi.org/10.1007/s11242-021-01673-4
[14] Kuzmina, L.I., Osipov, Y.V., Pesterev, A.R. (2024). Deep bed filtration model for cake filtration and erosion. Applied Mathematics and Mechanics, 45(2): 355-372. https://doi.org/10.1007/s10483-024-3077-9
[15] Sacramento, R.N., Yang, Y., You, Z., Waldmann, A., et al. (2015). Deep bed and cake filtration of two-size particle suspension in porous media. Journal of Petroleum Science and Engineering, 126: 201-210. https://doi.org/10.1016/j.petrol.2014.12.001
[16] Pashkin, V.D., Lezhnev, K.E. (2021). Coupled model of deep-bed-filtration and cake filtration in porous media for gravel pack modelling. In International Summer School-Conference “Advanced Problems in Mechanics”, St. Petersburg, Russia, pp. 410-424. https://doi.org/10.1007/978-3-031-37246-9_31
[17] Karlsons, K., de Kort, D.W., Alpak, F.O., Dietderich, J., et al. (2022). Integrating pore-scale flow MRI and X-ray μCT for validation of numerical flow simulations in porous sedimentary rocks. Transport in Porous Media, 143(2): 373-396. https://doi.org/10.1007/s11242-022-01770-y
[18] Xu, Y., Ye, L., Li, Y., Wang, H. (2024). Microscopic mechanism of particle clogging in porous media during managed aquifer recharge: From X-ray computed tomography (CT) imaging to numerical modelling. Hydrological Processes, 38(11): e70002. https://doi.org/10.1002/hyp.70002
[19] Kong, D., Peng, Y., Zhou, Z., Peng, H., Chen, Z. (2024). Pore-scale mechanism of coupled pressure-driven flow and spontaneous imbibition in porous media during high-pressure water injection processes. Capillarity, 13(2): 29-36. https://doi.org/10.46690/capi.2024.11.01
[20] Berry, G., Beckman, I., Cho, H. (2023). A comprehensive review of particle loading models of fibrous air filters. Journal of Aerosol Science, 167: 106078. https://doi.org/10.1016/j.jaerosci.2022.106078
[21] Maddineni, A.K., Das, D., Damodaran, R.M. (2018). Air-borne particle capture by fibrous filter media under collision effect: A CFD-based approach. Separation and Purification Technology, 193: 1-10. https://doi.org/10.1016/j.seppur.2017.10.065
[22] Hou, L., Zhou, A., He, X., Li, W., Fu, Y., Zhang, J. (2019). CFD simulation of the filtration performance of fibrous filter considering fiber electric potential field. Transactions of Tianjin University, 25(5): 437-450. https://doi.org/10.1007/s12209-019-00218-7
[23] Li, Y., Cui, J., Chai, P., Wang, Y. (2025). Effect of dendritic structure on the filtration performance of fibrous media during dust loading by CFD-DEM. Scientific Reports, 15(1): 32161. https://doi.org/10.1038/s41598-025-93920-7
[24] Gao, W.B, Tang, X., Xu, M.M., Li, Y.Q., Zhong, Y.Y., Kong, D.B., Wen, Y.P., Li, Q. (2024). Surfactant–polymer viscosity effects on enhanced oil recovery across pore structures: Microfluidic insights from pore scale to darcy scale. Energy & Fuels, 38(18): 17380-17391. https://doi.org/10.1021/acs.energyfuels.4c02531