Zuryati Djafar*![]() | Jailani Ahmad Thufail
| Jailani Ahmad Thufail![]() | Sofia Nadila
| Sofia Nadila![]() | Dianti Utamidewi
| Dianti Utamidewi![]() | Mustofa
| Mustofa![]() | Wahyu Haryadi Piarah
| Wahyu Haryadi Piarah![]()
© 2025 The authors. This article is published by IIETA and is licensed under the CC BY 4.0 license (http://creativecommons.org/licenses/by/4.0/).
OPEN ACCESS
Clean water is a natural resource that humans really need. However, availability is starting to be limited. One solution to overcome this problem is to condense the water vapor in the atmospheric air. Condensation of water vapor can be done using an atmospheric water generator (AWG) based on the vapor compression cycle (VCC) using refrigerant. This research aims to find the best conditions for extracting water vapor content in atmospheric air where the best conditions are determined by the optimum amount of refrigerant used and also the optimum rate of atmospheric air. In this research, 3 variations of refrigerant mass flow rate were carried out, namely 0.00124 kg/s, 0.00128 kg/s and 0.00131 kg/s. Furthermore, for the best mass flow rate, 3 variations of atmospheric air velocity entering the cooling/condensing chamber were carried out, namely 2.7 m/s, 2.1 m/s and 1.6 m/s. The test results show that optimal conditions (producing the most water) occur at a refrigerant mass flow rate of 0.00124 kg/s and with an air velocity entering the condensation chamber of 1.6 m/s. The water produced under optimum conditions is 73 ml/hour. Furthermore, the test results also show that apart from being a water producer, the AWG tool can also be used as an air conditioner for tropical areas.
atmosphere, condensation, atmospheric water generator, water, vapor compression cycle
Humans need water for daily needs, such as drinking, cooking, washing, bathing, and various other daily activities [1]. Water is also needed for various sectors of life, such as industry, agriculture, health, trade and other sectors, so that demand has experienced a significant increase [2].
Currently, several countries are experiencing a crisis in clean water sources [3, 4]. This water crisis problem can be overcome by utilizing water sources that come from atmospheric air. The Earth's atmosphere contains billions of tons of fresh water (98% in the vapor state) in the form of potential atmospheric dew [5].
There are two ways that can be done to extract water from atmospheric air. Namely by using absorbent material and by cooling the air until it reaches the dew point temperature [6]. Furthermore, air cooling can be done using a vapor compression cycle (VCC) machine or using a thermoelectric cooler (TEC).
In line with the principle of air conditioning (AC) machines, Tripathi et al. [7] and Ahmad et al. [8] introduced a device called an atmospheric water generator (AWG) where atmospheric air is passed over a cold surface so that the water vapor in the air condenses into water.
AWG devices use the principle of latent heat absorption using a VCC machine where high pressure refrigerant is obtained using a compressor [9-12]. Unfortunately, information about AWG is still very minimal except that it is explained that the tool does not work well at atmospheric air temperatures below 18.3℃ and relative humidity of 30%. Other research on AWG with VCC is related to modification of the input power source using solar panels [13] and combination with parabolic collectors [14] as well as increasing the absorption capacity of atmospheric air [15-17]. Furthermore, Shahrokhi and Esmaeili [15] designed an AWG by utilizing the cold side of the Thermoelectric Cooler (TEC) as an evaporator to help accelerate the saturation point of atmospheric vapor. TEC's electrical energy input is obtained from renewable energy (PV). Like Shahrokhi and Esmaeili, Abirami et al. [18] have also utilized a thermoelectric cooler in their research to help produce water from atmospheric air.
Beyond air cooling methods, Ali et al. [16] proposed the use of composite carbon-based materials capable of absorbing sunlight across a broader energy spectrum to enhance the absorption capacity of atmospheric water vapor. Similarly, Xiang et al. [17] utilized nanoporous carbon to improve atmospheric vapor absorption, optimizing water generation performance.
From the description above, it raises curiosity about whether the lower the cold surface temperature, the greater the water production will be and also whether the more air introduced into the cooling chamber will have a positive impact on water production. In this research, the optimal conditions for the atmospheric air condensation system based on VCC refrigeration will be observed.
2.1 Air humidity
Atmospheric air consists of a mixture of dry air and water vapor [19]. In addition, air humidity is the amount of water vapor contained in the atmospheric air. The water vapor content in atmospheric air depends on the amount of evaporation in the surroundings, such as from seas, lakes and rivers, as well as from ground water. Beside that, it can also come from the transpiration process, namely evaporation from plants or human respiration and sweat. The amount of water vapor also depends on air temperature, air pressure and wind [15, 20].
2.2 Condensation
Condensation is the process in which water vapor transitions from the gaseous phase to the liquid phase [21]. This transformation occurs when the vapor is cooled below its saturation temperature, typically upon contact with a surface cooler than the vapor’s dew point. Initially, condensation begins with the formation of clusters of atoms or molecules in the air, situated in the interface between the gas phase and the liquid or solid surface [22].
Once liquid condensate forms on a surface, it typically flows downward under the influence of gravity. In many cases, the liquid wets the surface, spreading to form a thin film—a phenomenon referred to as film condensation. Conversely, when the surface is not wetted, individual droplets form, which coalesce and flow downward as they merge with other droplets, a process termed dropwise condensation [23].
Figure 1. Psychrometric of the air condensation process
The condensation process can be illustrated in Figure 1. For example, at Point A, where the air temperature is 20℃ and the relative humidity is 70%, the dew point is calculated to be 14.359℃. If air at these conditions contacts a surface with a temperature lower than the dew point, water vapor will condense into liquid droplets, reducing the vapor content in the air. As the surface temperature decreases further, more vapors condense [24]. The amount of condensation also depends on the air's humidity level; higher humidity allows for greater water collection. Studies have shown that water harvesting systems perform most efficiently in hot and humid environments [25-28].
2.3 Vapor compression cycle (VCC)
The basic configuration of a vapor compression refrigeration system (VCC) is shown in Figure 2. The working fluid, typically a refrigerant [29], undergoes phase transitions, along with changes in temperature and pressure, as it circulates through the system’s main components [30]. Heat absorption, which cools the air, occurs in the evaporator, while heat is released in the condenser. For the refrigerant to discharge heat effectively in the condenser, its temperature must exceed the ambient temperature. Achieving this temperature differential requires the use of a compressor.
Figure 2. Vapor compression
Each heat exchange device such as the evaporator and condenser has a certain ability to transfer heat.
2.4 R600a hydrocarbon refrigerant
Based on its chemical properties, a good refrigerant is: non-toxic, does not react with refrigeration components, and is not flammable, and does not have the potential to cause global warming (non-GWP (Global Warming Potential)) and does not damage the ozone layer (non-ODP (Ozone Depleting Potential)) [31].
In this research, the refrigerant R600a with the chemical formula C4H10, or it could also be called isobutane, was used. This refrigerant is widely used because of concerns about the problem of ozone layer depletion. Refrigerant R600a does not have the potential to damage ozone because it has ODP=0 and GWP=20 [32]. R600a refrigerant also has the characteristics of a lower pressure ratio, making it suitable for small compressors and saving energy consumption. Apart from that, R600a also has a smaller hydrocarbon density, so it uses less than synthetic refrigerants. In addition, the viscosity of R600a is smaller, this can lighten the load on the compressor [33, 34].
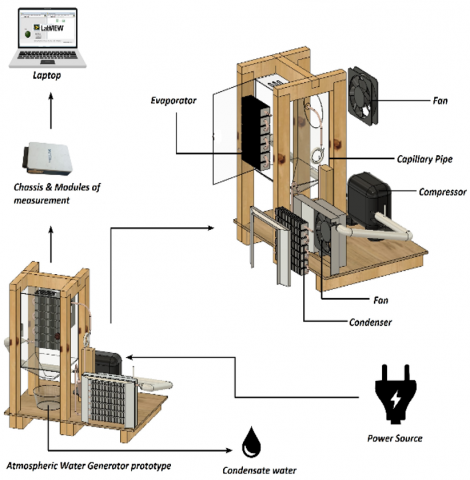
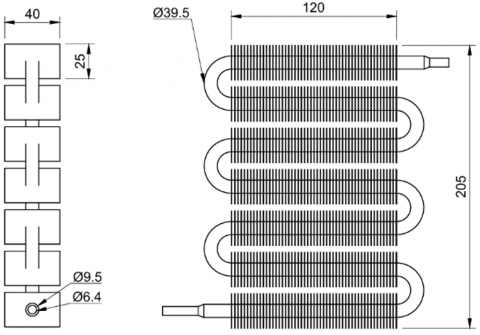
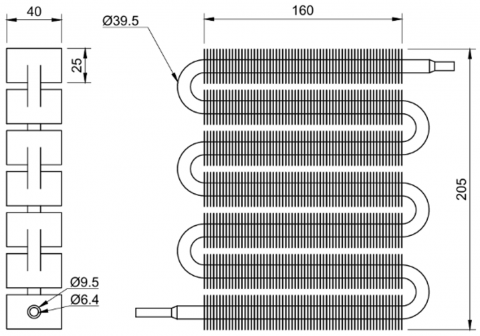
The research equipment setup is depicted schematically in Figure 3. The vapor compression system comprises four primary components: the evaporator, compressor, condenser, and capillary tube. The dimensions of the cooling/condensing chamber are 600 mm × 420 mm × 540 mm. In this study, a 1/8 PK compressor was employed, with three variations in refrigerant filling pressure to achieve differing refrigerant mass flow rates. Both the evaporator and condenser are constructed from U-shaped finned pipes with 3.5 bends (U.35 type), as illustrated in Figures 4 and 5. The evaporator’s dimensions (120 mm × 205 mm) are tailored to fit the cooling chamber, while the condenser’s dimensions (160 mm × 205 mm) are larger to account for the higher amount of heat released compared to the heat absorbed in the evaporator. A capillary tube with a diameter of 0.031 inches and a length of 160 cm was used.
Figure 3. Scheme of testing installation AWG
Figure 4. Dimension of evaporator
Air is introduced into the condensation chamber via a fan with three-speed settings, producing air velocities of 1.6 m/s, 2.1 m/s, and 2.7 m/s, achieved by adjusting the fan’s input voltage to 6 Volts, 8 Volts, and 12 Volts, respectively. Conversely, the air velocity passing through the condenser remained constant at 3.2 m/s, driven by a fan operating at 12 Volts. The primary research parameters measured included the refrigerant mass flow rate at the compressor, the evaporator temperature, air temperature, and relative humidity, and the air speed entering the cooling chamber. Additionally, the air temperature exiting the chamber was recorded. The quantity of water produced was collected and measured.
Figure 5. Dimension of condenser
3.1 Experiment set-up
The components of the VCC are assembled as in Figure 3 and connected directly to an electrical source and a computer as a data recording device equipped with the LabVIEW software program [35-37] from National Instrument. The AWG image on the top right is an illustrative image because, in reality, the Evaporator is in a cooling chamber made of acrylic. Meanwhile, the Fan is placed on the surface of the acrylic wall, which functions to draw atmospheric air into the cooling chamber with 3-speed variations. The real AWG image is shown in the lower left corner. The evaporator functions as a cooler that flows refrigerant from the compressor. The compressor is given 3 variations of charging pressure to get 3 variations of refrigerant mass flow rate. Data collection was repeated three times for each variation in compressor filling pressure and air speed entering the cooling room. The test duration for each variation was 60 minutes.
The study was conducted under three distinct environmental conditions: Inside a laboratory room, in an open courtyard adjacent to the laboratory building, and on the rooftop of the laboratory building, situated 13 meters above ground level.
The mass flow rate of the refrigerant used is one of the important parameters in heat absorption in a VCC engine.
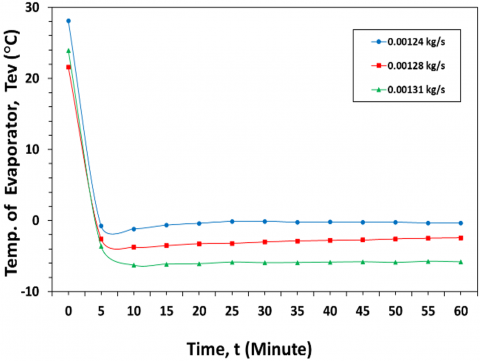
Figure 6 shows the evaporator temperature during 60 minutes of data collection at 3 variations in refrigerant mass flow rate. Initially the evaporator temperature decreases rapidly in about 5 minutes. Then it is relatively constant. It can be seen that the smaller the refrigerant mass flow rate, the higher the evaporator temperature will be closed to the air temperature. The difference between air and evaporator temperatures is getting smaller. This is in line with the less energy that can be absorbed by the evaporator. For a flow rate of 0.00131 kg/s, the evaporator temperature is around -5.81℃ and at a flow rate of 0.00128 kg/s it is around -2.45℃ and at a flow rate of 0.00124 kg/s it is around -0.35℃.
Figure 7 shows the volume of water produced at three variations of refrigerant mass flow rate with an inlet air speed of 1.6 m/s (6 Volts). The largest volume of water was produced at a mass flow rate of 0.00124 kg/s, namely 73 mL with air humidity of 78.8%. Meanwhile, at a mass flow rate of 0.00128 kg/s the volume of water produced is only 40 mL with an air humidity of 68.4%, and at a mass flow rate of 0.00131 kg/s the volume of water produced is 43 mL with an air humidity of 70.4%. At a mass flow rate of 0.00128 kg/s and 0.00131 kg/s the cooling temperature (evaporator) is significantly lower than 0℃ which results in the evaporator being covered in frost, thereby inhibiting the process of condensing the air into water drops. This results in low water production. This phenomenon shows that negative effects on water production occur if the coolant temperature is much lower than 0℃. It has been mentioned above that the amount of water production does not only depend on the cooling temperature but also depends on the amount of water vapor content in the air, so the performance of these three conditions can be assessed by comparing the ratio of the amount of water production to the relative humidity.
Figure 6. Graph of Evaporator temperature for 3 variations in refrigerant mass flow rate with air velocity of 1.6 m/s (6 Volts)
Figure 7. Graph of water volume and humidity for 3 variations of refrigerant mass flow rate with 1.6 m/s air velocity
In the Figure 7 shows that for a mass flow rate of 0.00124 kg/s the value is 0.93 and for a mass flow rate of 0.00128 kg/s the value is 0.58 and for a mass flow rate of 0.00131 kg/s the value is 0.61. The highest value is at a mass flow rate of 0.00124 kg/s. Another thing that can be taken from the results of this observation is that the lower the cooling temperature does not guarantee that the resulting water production will be better.
The best temperature should be slightly lower than 0℃. After obtaining the best mass flow rate, we will try to see how the air speed entering the cooling room affects water production.
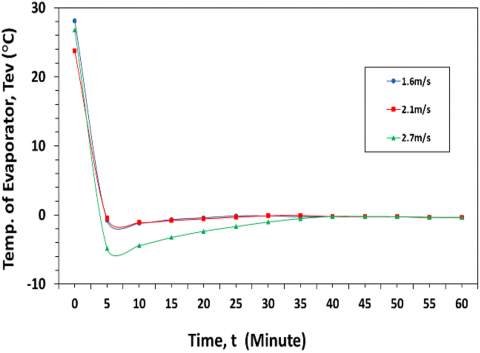
Figure 8. Graph of Evaporator temperature at 3 variations of air velocity at a refrigerant mass flow rate of 0.00124 kg/s
Figure 8 shows the evaporator temperature for 60 minutes at 3 variations of air velocity entering the condensation chamber: 2.7 m/s, 2.1 m/s and 1.6 m/s on a refrigerant mass flow rate of 0.00124 kg/s. If the speed increases, the air will touch the evaporator relatively briefly. This results in the heat transferred by the air to the refrigerant in the evaporator being relatively smaller so that the evaporator temperature is still relatively lower. On the other hand, if the air speed is slowed down, the contact time of the air on the evaporator will be longer so that the air will transfer heat to the evaporator to a greater extent which has implications for higher evaporator temperatures. It can be seen that at the 10th minute, the change in speed from 2.7 m/s, 2.1 m/s causes the evaporator temperature to change from -4.41℃ to -1.10℃. Furthermore, the change in speed from 2.1 m/s to 1.6 m/s shows a relatively small change in temperature. Because the heating process take place continously, over time the evaporator temperature will reach its equilibrium state. In the picture, it appears to occur starting at 40 minutes.
Figure 9 shows the volume of water produced and relative humidity in testing 3 variations of air velocity entering the cooling room for a refrigerant mass flow rate of 0.00124 kg/s. At an air velocity entering the cooling chamber of 2.7 m/s, it produces 39 ml/hour of water. At a velocity of 2.1 m/s it produces 54 ml/hour and at 1.6 m/s it produces 73 ml/hour. The quantity of atmospheric water produced from this research is greater than the study conducted by Ajiwiguna et al. [11] with maximum water production of 28.5 ml/hour at a velocity of 2.5 m/s. Furthermore, the ratio of the amount of water to relative humidity for velocities of 2.7 m/s, 2.1 m/s and 1.6 m/s is 0.53, 0.64 and 0.93, respectively. These results indicate that the optimum speed occurs at an inlet air velocity of 1.6 m/s.
Compared with thermoelectric-based AWG [38], the results of AWG based on the VCC provide much better results. The thermoelectric AWG produces 5.5 ml/hour of water while the VCC AWG produces 73 ml/hour of water.
Figure 9. Graph of water volume and relative humidity at 3 variations of inlet air velocity on a refrigerant mass flow rate of 0.00124 kg/s
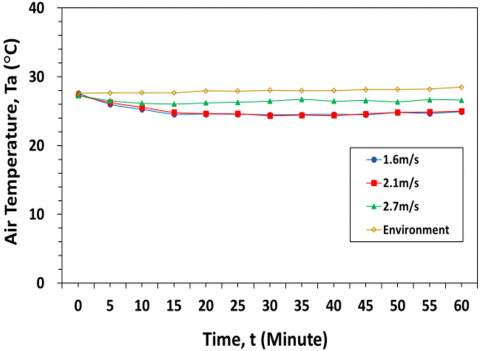
Figure 10. Graph of air temperature leaving the cooling room at 3 variations in air velocity
Another parameter measured is the temperature of the air leaving the cooling room. Figure 10 shows the average temperature of the air leaving the cooling room for 60 minutes with a refrigerant mass flow rate of 0.00124 kg/s with 3 variations in air velocity entering the cooling room. It is also shown that the temperature of the environmental air entering the cooling room is greater than 18.3℃ as required by Tripathi et al. [7].
As expected, the lower the inlet air velocity, the lower the outlet air temperature because the heat absorption process in the evaporator takes longer. This phenomenon is very clearly visible in the change in velocity from 2.7 m/s to 2.1 m/s. However, the temperature change from 2.1 m/s to 1.6 m/s is very small. This indicates that the maximum ability of the evaporator to transfer heat begins to occur around before 1.6 m/s.
It was also revealed that the exit air temperature could reach 24.46℃. This means that this AWG tool can also be used as an air conditioner, especially for tropical areas.
Lastly, try to place the AWG device in another position in the building and operating it using the best parameters (refrigerant mass flow rate 0.00124 kg/s and air velocity entering the cooling room 1.6 m/s). The test results for the 3 environmental variations, laboratory space, building courtyard and rooftop are shown in Figure 11. It can be seen that the use of AWG in the building courtyard and rooftop does not provide better results than when used indoors.
Figure 11. Comparison diagram of water volume and relative humidity at 3 different environments
The volume of water produced during 60 minutes of testing, in the laboratory environment, building roof top, and building courtyard were respectively 73 ml/hour, 10 ml/hour, and 28 ml/hour.
The test results show that the best conditions are obtained at a refrigerant mass flow rate of 0.00124 kg/s with an input air velocity in the cooling chamber of 1.6 m/s. The water production rate under these conditions is 73 ml/hour. Furthermore, cooling temperatures that are far below 0℃ will have a negative impact on water production. The test results also show that the AWG device can double as a space cooler in tropical areas because the air temperature leaving the cooling room can reach 24.46℃.
The authors would like to thank the Hasanuddin University who has funded this research through the Unhas Professor Research scheme.
|
t |
time, minute |
|
Ta |
air temperature, ℃ |
|
Tev |
evaporator temperature, ℃ |
|
Subscripts |
|
|
AC |
air conditioning |
|
AWG |
atmospheric water generator |
|
GWP |
global warming potential |
|
ODP |
ozone depletion potential |
|
PK |
paardenkracht |
|
PV |
photovoltaic |
|
TEC |
thermoelectric cooler |
|
PV |
photovoltaic |
|
UV |
ultra violet |
|
VCC |
vapor compression cycle |
[1] Exposto, L.A.S.M., Lino, M.N., Quim, J.A.C., Juvi Goncalves, M.J., Vicente, H.P. (2021). Efforts to improve clean water quality to support community health. KESANS: International Journal of Health and Science, 1(3): 236-251. https://doi.org/10.54543/kesans.v1i3.24
[2] Kilic, Z. (2020). The importance of water and conscious use of water. International Journal of Hydrology, 4(5): 239-241. https://doi.org/10.15406/ijh.2020.04.00250
[3] Liu, J., Yang, H., Gosling, S.N., Kummu, M., Flörke, M., Pfister, S., Hanasaki, N., Wada, Y., Zhang, X., Zheng, C., Alcamo, J., Oki, T. (2017). Water scarcity assessments in the past, present, and future. Earth’s Future, 5(6): 545-559. https://doi.org/10.1002/2016EF000518
[4] Gumelar, A.R., Sutjiningsih, D., Alamsyah, A.T., Moersidik, S.S. (2019). Facing Cilegon 2025 water crisis. In Proceedings of the 1st International Conference on Environmental Science and Sustainable Development (ICESSD). Indonesia. https://doi.org/10.4108/eai.22-10-2019.2291679
[5] Inbar, O., Gozlan, I., Ratner, S., Aviv, Y., Sirota, R., Avisar, D. (2020). Producing safe drinking water using an atmospheric water generator (AWG) in an urban environment. Water, 12(10): 2940. https://doi.org/10.3390/w12102940
[6] Kandeal, A.W., Joseph, A., Elsharkawy, M., Elkadeem, M.R., Hamada, M.A., Khalil, A., Moustapha, M.E., Sharshir, S.W. (2022). Research progress on recent technologies of water harvesting from atmospheric air: A detailed review. Sustainable Energy Technologies and Assessments, 52: 102000. https://doi.org/10.1016/j.seta.2022.102000
[7] Tripathi, A., Tushar, S., Pal, S., Lodh, S., Tiwari, S., Desai, P.R.S. (2016). Atmospheric water generator. International Journal of Enhanced Research in Science. Technology & Engineering, 5(4): 69-72. https://doi.org/10.22214/ijraset.2022.41406
[8] Ahmad, F.F., Ghenai, C., Al Bardan, M., Bourgon, M., Shanableh, A. (2022). Performance analysis of atmospheric water generator under hot and humid climate conditions: Drinkable water production and system energy consumption. Case Studies in Chemical and Environmental Engineering, 6: 100270. https://doi.org/10.1016/j.cscee.2022.100270
[9] Liu, S. He, W., Hu, D., Lv, S., Chen, D., Wu, X., Xu, F., Li, S. (2017). Experimental analysis of a portable atmospheric water generator by thermoelectric cooling method. Energy Procedia, 142: 1609-1614. https://doi.org/10.1016/j.egypro.2017.12.538
[10] Uglanov, D.A., Zheleznyak, K.E., Chertykovsev, P.A. (2018). The development and calculation of an energy-saving plant for obtaining water from atmospheric air. IOP Conference Series: Material Science and Engineering, 302(1): 012053. https://doi.org/10.1088/1757-899X/302/1/012053
[11] Ajiwiguna, T.A., Kirom, M.R., Suprayogi. (2023). Design, simulation, and optimization of portable atmospheric water generator using vapor compression refrigeration system. Journal of Physics Conference Series, 2673(1): 012001. https://doi.org/10.1088/1742-6596/2673/1/012001
[12] Ajiwiguna, T.A., Kirom, M.R. (2023). Design and optimization of simple atmospheric water generator using thermoelectric module. Dinamika Teknik Mesin, 13(2): 173-179. https://doi.org/10.29303/dtm.v13i2.663
[13] Runze, D., Qingfen, M., Hui, L., Gaoping, W. Wei, Y., Guangfu, C., Yifan, C. (2020). Experimental investigations on a portable atmospheric water generator for maritime rescue. Journal of Water Reuse and Desalination, 10(1): 30-44. https://doi.org/10.2166/WRD.2020.048
[14] Salek, F., Eshghi, H., Zamen, M., Ahmadi, M.H. (2022). Energy and exergy analysis of an atmospheric water generator integrated with the compound parabolic collector with storage tank in various climates. Energy Reports, 8: 2401-2412. https://doi.org/10.1016/j.egyr.2022.01.178
[15] Shahrokhi, F., Esmaeili, A. (2022). Optimizing relative humidity based on the heat transfer terms of the thermoelectric atmospheric water generator (AWG): Innovative design. Alexandria Engineering Journal, 67: 143-152. https://doi.org/10.1016/j.aej.2022.09.003
[16] Ali, A.S.M., Hegab, H.M., Almarzooqi, F., Jaoude, M.A., Hasan, S., Banat, F. (2024). Carbon composites for efficient solar-driven atmospheric water harvesting. Journal of Environmental Chemical Engineering, 12(5): 113319. https://doi.org/10.1016/j.jece.2024.113319
[17] Xiang, C., Deng, F., Wang, R. (2022). Passive rapid-cycling atmospheric water generator. Matter, 5(8): 2487-2490. https://doi.org/10.1016/j.matt.2022.06.032
[18] Abirami, A.N., Balamurugan, C.R., Meena, D. (2020). Water condensation system based on thermoelectric coller using solar energy. International Journal of Andvances in Applied Sciences, 9(2): 149-158. https://doi.org/10.11591/ijaas.v9.i2.pp149-158
[19] Gunawan, S., Asrizal, Hufri, Dwiridal, L., Arifin, I.B., Rahmatia, F. (2022). Effect of air temperature, air humidity, and air pressure on rainfall based on measurement result in Kototabang. Pillar of Physic, 15(2): 96-104.
[20] Santosa, I., Maulana, S.A. (2022). Analysis of filmwise become dropwise formation in flat, triangular and semicircular type steam catchers. Jurnal Teknologi, 14(1): 111-118. https://doi.org/10.24853/jurtek.14.1.111-118
[21] Bhavsar, H. (2023). Introduction and basics of condensation. PriMera Scientific Engineering, 3(1): 53-60. https://primerascientific.com/pdf/psen/PSEN-03-063.pdf.
[22] E. Yohanes, E., Soeparman, S., Siswanto, E. (2014). Heat flux of condensation in coconut shell charcoal media (Cocos Nurifera). Jurnal Rekayasa Mesin, 5(1): 39-49. http://eprints.itn.ac.id/id/eprint/5626.
[23] Welty, J.R., Wicks, C.E., Wilson, R.E., Rorrer, G.L. (2008). Fundamental of Momentum, Heat, and Mass Transfer, 5th Edition. John Wiley & Sons, Inc. United State of America.
[24] Rismaya, R., Pramudantoro, T.P., Khakim, N. (2023). Analysis of the effect of different temperature settings on condensate water production in mini freezer pre-coolers. Prosiding Industrial Research Workshop and National Seminar, 14(1): 453-457. https://doi.org/10.35313/irwns.v14i1.5427
[25] Ahamed, P.U., Ibraheem, M.P.M.M., Basith, K.M.S., Azharudeen, J.M., Kiyasudeen, P.A. (2023). Performance analysis of atmospheric water extraction by refrigerator cum air conditioner. International Journal of Advanced Research in Science, Communication and Technology (IJARSCT), 3(3): 318-339. https://doi.org/10.48175/IJARSCT-14341
[26] Qi, H., Wei, T., Zhao, W., Zhu, B., Liu, G., Wang, P., Lin, Z., Wang, X., Li, X., Zhang, X., Zhu, J. (2019). An interfacial solar-driven atmospheric water generator based on a liquid sorbent with simultaneous adsorption–desorption. Advanced Materials, 31(43): 1903378. https://doi.org/10.1002/adma.201903378
[27] Tawab, S.A., Abdelaal, W.G.A., Hamad, K.H. (2022). Water purification in atmospheric water generator. Port Said Engineering Research Journal, 26(4): 16-21. https://doi.org/10.21608/pserj.2022.134228.1180
[28] Cattani, L., Magrini, A., Leoni, V. (2022). Energy performance of water generators from gaseous mixtures by condensation: Climatic datasets choice. Energies, 15(20): 7581. https://doi.org/10.3390/en15207581
[29] Stoecker, W.F., Jones J.W. (1983). Refrigeration and Air Conditioning, Second Edition. McGraw-Hill, Inc. New York.
[30] Elonka, S.M., Minich, Q.W. (1973). Standard Refrigeration and Air Conditioning Questions and Answer, Second Edition. Mcgraw-Hill, Inc. New York.
[31] Irawan, R., Andrizal, Basri, I.Y. (2015). Comparison of coefficient of performance (COP) refrigerant R-134a with refrigerant MC-134 in car air conditioning systems. Automotive Engineering Education Journals, 4(2). https://api.semanticscholar.org/CorpusID:102026944.
[32] Aziz, A., Hanif, H. (2008). Use of hydrocarbons as a refrigerant in hybrid vapor compression cycle refrigeration machines utilizing exhaust heat of air conditioning devices. Jurnal Teknik Mesin, 5(1). https://www.researchgate.net/publication/277763456.
[33] Kusuma, I., Siregar, I.H. (2014). Comparating study of the performance of refrigrant R134a with R600a. Jurnal Teknik Mesin (JTM) Universitas Negeri Surabaya, 3(1): 33-39. https://www.academia.edu/103608136.
[34] Aravind, K. (2023). Investigation of the technological advancements and future prospects of atmospheric water generator systems. Journal of Student Research, 12(3): 195. https://doi.org/10.47611/jsrhs.v12i3.4684
[35] Djafar, Z., Salsabila, A.Z., Piarah, W.H. (2021). Performance comparison between hot mirror and cold mirror as a beam splitter on photovoltaic-thermoelectric generator hybrid using labVIEW simulator. International Journal of Heat and Technology, 39(5): 1609-1617, http://doi.org/10.18280/ijht.390524
[36] Pohl, M., Kariž, Z., Bajsi, I. (2003). Humidity generator for comparison calibration purpose. In Proceedings, XVII IMEKO World Congress, Dubrovnik, Croatia, pp. 1642-1645. https://www.imeko.org/index.php/proceedings/367.
[37] Wang, L., Tan, Y.Y., Cui, X.L. (2012). The application of LabVIEW in data acquisition system of solar absorption refrigerator. Advanced Materials Research, 532-533: 581-585. https://doi.org/10.4028/www.Scientific.net/AMR.532-533.581
[38] Djafar, Z., Arman, A.A., Sakka, A., Mustofa, Mahmuddin, F., Klara, S., Rauf, N., Piarah, W.H. (2023). Atmospheric water harvesting using thermoelectric cooling technology. International Journal of Design & Nature and Ecodynamics, 18(4): 1011-1016. https://doi.org/10.18280/ijdne.180430