Muna M. Alibrahim*![]() | Saja A. Zeadeh
| Saja A. Zeadeh![]() | Ayman Hassan AL-Qudah
| Ayman Hassan AL-Qudah![]() | Banan T. Alzoubi
| Banan T. Alzoubi![]()
© 2024 The authors. This article is published by IIETA and is licensed under the CC BY 4.0 license (http://creativecommons.org/licenses/by/4.0/).
OPEN ACCESS
In Jordanian building sector, a high percentage of cooling and heating energy is consumed. However, the occupants´ satisfaction regarding indoor thermal comfort is low as mentioned in previous studies. This study investigated the indoor thermal comfort and energy consumption at three zones in the office block before and after implementing corrective actions (CA) for enhancing thermal comfort level. Therefore, it is assumed that implementing CA will increase employees’ satisfaction without increasing energy consumption, Subsequently, that improve their health, performance, and productivity. A mixed approach is used to collect data by using experimental investigations and interviews. The employees’ satisfaction was evaluated in two phases: before and after the implementation of CA. The study showed that employees’ satisfaction increased, while the indoor ambient temperature (IAT) decreased to become closer to thermal comfort level without increasing the energy consumption ratio. Furthermore, changing functions during the construction phase represents a major challenge that affecting occupants' thermal comfort negatively. Finally, using isolated aluminum window frame or PVC windows instead of using traditional aluminum window frame is recommended as the results showed.
thermal comfort, office block, employees’ satisfaction, corrective actions, energy consumption
Globally, about 42% of energy is consumed within the building sector which is divided into 35% electricity and 65% non- electricity. Buildings’ energy consumption is about 30% of total energy consumption [1, 2]. Therefore, there is a need to estimate indoor temperatures, heating and cooling loads and energy requirements for buildings, due to the indoor environment has great influence on general well-being, health and performance of occupants [3, 4], so comfortable indoor environmental conditions increase occupants’ efficiency such as employees in public offices [5].
In Jordan the situation is not different with respect to its energy situation; where it has two challenges: the increasing demand of energy on one hand and resources scarcity to fulfil this demand on the other hand [6]. However, the buildings sector in Jordan (such as office blocks) grows and accounting for 46% of electricity use and 21.5% of Jordan’s total share of energy consumption [7]. In spite of that, the occupants at the buildings especially the office blocks are unsatisfied with the indoor thermal comfort at their workplace [8].
The employees worldwide realized that comfortable indoor environmental conditions directly impact their work performance as well as their productivity [5]. Nowadays, employees all over the world spend most of their daily time inside office blocks, thus that have great influence on their general well-being, health and performance [5, 9].
Employees’ satisfaction of indoor thermal comfort is different among individuals even within the same environment, this challenge initiate argument among researchers on how to measure thermal comfort during the operation phase [10-12]. Satisfactory and comfortable indoor conditions are essential if the health, performance, and productivity of employees in office blokes are aimed to be improved [13, 14].
Nowadays, designers use ASHRAE standards as a design guide to maintain an adequate level of thermal indoor comfort inside buildings. Where, indoor occupied spaces are determined by one of the assessment approaches identified under design requirements, which is why research literature significant work on thermal comfort and air quality during the building design process [15, 16]. Yet, much less work when it comes to employees’ satisfaction during the operation phase [17, 18]. This study focuses on how to increase the employees’ satisfaction without increasing the energy consumption rates at the presidency building of Jordan University of Science and Technology, Jordan.
The American Society of Heating, Refrigerating and Air-Conditioning Engineers (ASHRAE) defines thermal comfort as ‘‘the condition of mind which expresses satisfaction with the thermal environment” [19]. Referring to Djongyang et al. [20], "the thermal comfort occurs when body temperatures are held within narrow ranges, skin moisture is low, and the physiological effort of regulation is minimized”. Many circumstances relate to user’s place and the reason behind being at that place, as well as the seasons should be taken into consideration [21].
The thermal comfort is affected by three aspects personally, environmentally and psychologically. These aspects include six factors which are personal factors seen as age, gender, type of clothes, nature and status. Environmental factors are air speed, air temperature, humidity, and radiant temperature [22]. While, psychological aspect involves behavior of users due to the nature of windows and doors and use artificial lightening. The importance of these factors is achieving the optimum level of thermal comfort indoor buildings [23-25].
The fact that comfortable indoor thermal quality (ITQ) has a strong contribution towards increasing employees’ efficiency has been widely accepted among researchers [26, 27]. Employees spend the majority of time inside buildings which has a great influence on their general productivity, health and performance [5, 9, 28]. ASHRAE and the International Organization for Standardization (IOS 7730) are among the top contributors to thermal comfort research, their standards were used as a base for a wide range of indoor thermal comfort measurement tools. Many researchers have adopted these tools to achieve a high level of thermal comfort of building users, buildings can be considered as thermally comfortable if users were asked about the thermal state; they won’t prefer any thermal changes.
This study was designed to investigate ITQ in a public office block during the operation phase, Jordan. The sample was narrowed down to include employees at Jordan University of Science and Technology (JUST). Offices were studied to determine the level of comfort that employees experienced during working hours. After interviewing employees, nonconformity was detected in offices within three buildings at the university. Accordingly, CA were proposed, evaluated and implemented to enhance the employees’ satisfaction without energy consumption increase.
This study investigates indoor thermal comfort and energy consumption at three zones in the office block before and after implementing CA. To collect data, two different approaches were adopted, which are qualitative and quantitative. Qualitative method is structured interviews, in meanwhile, quantitative methods are physical measurements and simulation. The mixed approach was used for understanding employees’ satisfaction through the structured interview as well as measuring IAT and energy consumption through physical measurement and simulation The duration of this study was five months during working days (8 am- 4 pm) at three buildings: Human Resources (HR), Financial Affairs Unit (FAU) and Council Affairs Unit (CAU)) of JUST, AR Ramtha, Jordan.
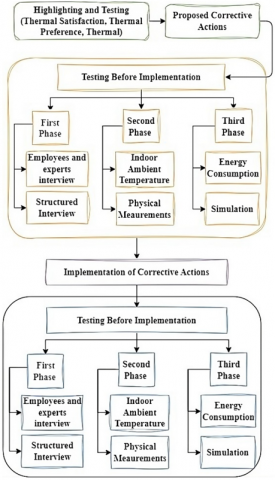
This study is divided into three phases before and after implementing CA (see Figure 1). The first phase was interviewing both the employee as well as the experts who are maintaining heating, ventilation, and air conditioning (HVAC) system. However, the experts just are interviewed once before implementing CA to find out the problem. The second phase, focused on the physical measurements of IAT, where the windows farm temperature and the heat flow through the windows frames are measured. Finally, the third phase, is simulation to measure the HVAC system’s cooling energy consumption rates of the studied offices using Carrier's Hourly Analysis Program (HAP). The implementation of the proposed CA is applied after collecting data through the three phases at the first part. Afterward, the three phases are conducted again to figure out the differences after implementing the proposed CA.
Figure 1. Work breakdown structure: testing process relating to corrective actions
3.1 Case study
3.1.1 Selection criteria
Jordan has a hot dry climate, Mediterranean in the north and west, to the desert in the east and south, but the land is generally arid with hot long summers, cool short winters. The monthly temperature ranges from 13 to 32℃ throughout the year.
The energy bill in Jordan represents 20% of the country’s gross domestic product (GDP), and over 40% of electrical power is consumed within the building sector, whereas it’s 35% Worldwide which is a high ratio because Jordan is one of the third world countries with low resources and low income. Currently, the Royal Scientific Society in Jordan starts to face the energy challenges by promoting energy efficiency standards through a set of codes for energy efficiency and discussing local infrastructure including air conditioning [29].
During the design and operation phases of building life cycle, there is a need to estimate indoor temperatures, heating and cooling loads, and energy requirements for buildings. Previous studies were limited to the design phase of project. Therefore, there is a need to highlight general thermal comfort and users’ satisfaction during the operation phase. This can be achieved through more field studies and determination of variables within the tested buildings. In the case of JUST campus employees have expressed discomfort as soon as the presidency building started operating. The building is designed to gather offices of Presidency, HR, FAU and CAU, which gathered around 130 employees working at offices in comparison with other buildings on campus. While, the university employs 1282 administrative and technical staff [30]. The new office buildings include more than 10% of the administrative staff within the campus. Hence, these buildings were selected to determine the factors affecting the largest possible sample of employees within a contained environment that is relatively affected by the same conditions. The majority of the building’s employees felt that there was corruption in the operation of HVAC system due to the high electricity bill even though indoor thermal comfort could not be achieved.
3.1.2 Location
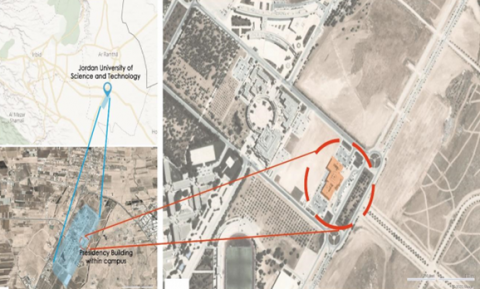
Ar-Ramtha city is in the far north of Jordan within Irbid Governorate. The city follows a Mediterranean climate with hot summers with daytime temperatures up to 36.1℃ and cold winters with nighttime temperatures below 0℃. JUST was established in 1986 and is geographically located in Ar-Ramtha with an area of approximately 11 km2 [30]. The office buildings were designed in late 2001 and added to the campus after the expansion plan in 2017. Figure 2 shows the studied buildings.
Figure 2. Case study location; maps are reproduced from Bing maps (2022)
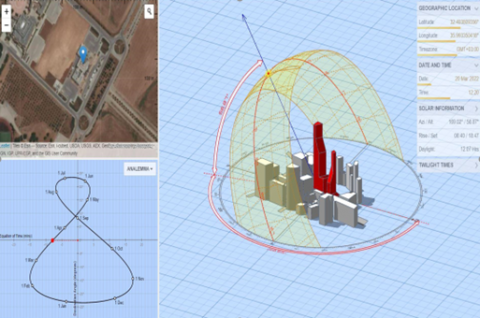
Generally, the campus is affected by the area’s temperature, however, in terms of microclimate the presidency building is surrounded by deserted lands gaining more exposure to direct sunlight in hot seasons, and less impact by the green areas within campus due to distance after relocation. Sun path diagram of the studied buildings is presented in Figure 3.
Figure 3. Sun path diagram; produced using sun path generator
3.1.3 Form and function
The building was designed in 2001 and built in 2017 with a design that consists of three semi-square-shaped masses. Each mass has a rectangular-shaped courtyard. However, the masses are unparalleled two corridors created to connect the courtyards with the outside, whereas the third is located in the central mass and fully enclosed. The four facades of the building are built of stone; the openings are double-glazed with aluminum frames, as shown in Figure 4.
Figure 4. New presidency building of JUST
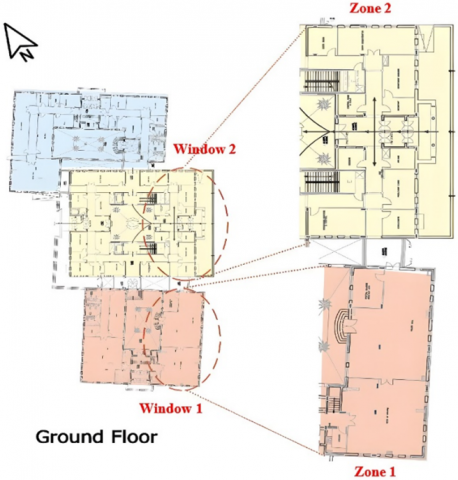
The building consists of two floors with an area of 4500 m2 [30]. Ground floor represents the center mass has the main entrance and the reception courtyard with offices surrounding it. The north mass has fully closed offices connected with one contentious centered corridor. While, the south mass has one large meeting room and the department of finance (open plan offices), as presented in Figure 5.
The first floor includes the three masses having the same plan layout, and fully closed offices connected with one contentious centered corridor as shown in Figure 6. The conditioned air that was supplied to the rooms through installed ducts connected to ceiling-mounted diffusers was provided by air handling units located in the ceiling. In each office, a single touch pad mounted on the wall to set the temperature manually.
Due to employees’ recommendations based on detected discomfort, three offices were repeatedly mentioned in the building. First, the FAU on the ground floor with an open plan layout; the offices are separated by partitions and the windows have south, and east orientations (20*11=220 m2). The second office is office no. 3 at the HR department with an area of 10 m2 on the ground floor. Finally, offices no. 3 and 4 with an area of 112 m2 on the first floor. Both offices (3 and 4) were suggested by the building manager because they recorded high temperatures although the central air conditioner is on with a 24℃ set point.
Figure 5. The office building layout showing the ground floor of the studied area
Figure 6. The office building layout presenting the first floor of the studied area
The area of the studied offices is 342 m2 with 30 employees, the temperature of the internal set point was directly managed from each office by a single wall installed touch pad. The building has HVAC system. A central air handling unit with a cooling capacity of 12 kW per floor was used to cool the offices. The studied offices are air-conditioned (AC) offices.
3.2 Structured interviews
The structured interviews were conducted with two categories: employees and experts. Employees were interviewed before and after implementing CA to understand their thermal satisfaction. Whilst, experts were interviewed one time before implementing CA to help in figuring out the problem.
Responses from AC spaces in the presidency building of JUST, the interviews were conducted with thirty employees to investigate the level of satisfaction in two phases. The first phase was before implementing CA, while, the second phase of interviews was conducted for validation after implementing CA. In meantime, experts are from academia, research team. Also, experts from industry were consulted.
3.3 Physical measurements
Measurements were conducted between the 1st of June 2022 and the 30th of October 2022 (five months). This method was used to measure the ITQ which is highly dependent on the IAT. The measurements were done in different positions at different times related to the usage of the instruments within the studied zones which are:
1- Extech RHT20 Humidity and Temperature Datalogger, used to record the temperatures of window frame that indicates the heat flow through the frames. The datalogger was set up to automatically measure the IAT of targeted zones Sunday to Thursday every 45 minutes.
2- Extech AN100: CFM/CMM Mini Thermo-Anemometer, used to record the IAT near glazed facade in different orientations every working day at specific times, three times a day (8:00 am, 11:30 am, and 2:00 pm). The temperatures were measured and recorded depending on the sun path orientation.
3- Fluke TIS10 9HZ: Thermal Infrared Camera, used to record the windows frame temperature Sunday to Thursday every two hours.
3.4 Simulation
This method was conducted to measure the HVAC system’s cooling energy consumption rates of the studied offices using Carrier's Hourly Analysis Program (HAP), because of its analysis capabilities for comparing the energy consumption of design and materials alternatives. Input data and results from design system calculations can be used directly in energy modelling studies. HAP performs the following tasks:
•Simulates the operation of all building heating and AC systems.
•Simulates the hours of operation in the building of all production equipment.
•Simulation of non-adaptive hourly operation including light.
•Simulation using HAP was conducted before and after the implementation of the CA, and then, compared to each other.
The CA measurements are required after nonconformity. Those measurements should be proposed, evaluated, and implemented [31, 32]. The significant conditions negatively affecting the thermal comfort of employees were defined and the actual causes related to them. Increasing employees’ satisfaction of the thermal comfort level is possible through removing the actual causes associated with these conditions. Accordingly, eleven CA were proposed, developed and defined to reduce or remove these conditions, where just eight of them were implemented.
4.1 Proposed corrective actions
The following list of CA were proposed after the data were primarily collected and several nonconformities were detected:
•Increase the capacity of air handling units by installing sensors that automatically open windows during nighttime to increase natural ventilation.
•Test the openings’ materials reflection, refraction, insulation and standards.
•Periodic maintenance for openings.
•Install lighting sensors and increase dependence on natural lighting instead of artificial ones.
•Increasing public awareness toward energy savings.
•Specialized courses should be held for two engineers at the HVAC system manufacturer’s headquarters, if not possible, at an accredited training center.
•On-the-job practical training for laborers about installing and maintaining the HVAC system equipment and programming training course for programmers.
•Functional and sutable inception tests are part of the pre-commissioning testing to make sure every item is ready to go securly onto the next phase.
•Operational tests are part of commissioning and performance twesting, which make sure the works can be used safely and according to specifications in all operating circmstances.
•Conducting trail operation test to be sure that the works operats dependly and in line with the contract.
4.2 Implemented corrective actions
•Change undersized fan coil units in seven offices with a higher size unit which maintained the indoor temperature as designed.
•Install sensors that automatically open windows during the night that increased the natural ventilation.
•System performance tests proved that the HVAC system works as specified under all operating conditions.
•Modify the windows lock hangers to be fixed which forbid the occupants from opening the windows while the HVAC system is operating which helps to maintain the indoor set point by the HVAC system.
•Install shading film on the out surface of all windows that decreased transition through windows and reduces the solar heat.
•Install window blinds which allowed occupants to control their environment more precisely as they desire.
•Replace the old type of main doors with automatic doors which minimized the internal air leakage through building envelope.
4.3 Why some proposed corrective actions were NOT implemented?
The priority for the evaluation and implementation of CA is based on the relative significance of the major conditions negatively affecting the employees’ thermal comfort identified through the investigation process. Some of the proposed CA were not implemented because they were not applicable during the study duration, but considered to be implemented in the future.
5.1 Before implementing corrective actions
5.1.1 Employees’ satisfaction
Employees were requested to explain in the interviews whether they are satisfied with the building's thermal comfort level during working hours. The results showed that the employees’ satisfaction ranges from 5% to 40% of the sample were dissatisfied with the thermal comfort level, where the highest percentage of dissatisfaction was at higher temperatures (27℃). In addition, employees were requested to describe the surrounding indoor environment. The results showed that 70% of employees expressed the unacceptability toward IATs. In meanwhile, 30% of employees expressed the acceptability toward IATs, which clearly indicates that thermal acceptability inside the AC office is related to the prevailing outdoor temperature.
5.1.2 Indoor ambient temperature
Asking four experts from the design team of the HVAC system to evaluate the HVAC system used in the studied zones and get feedback to eliminate any hardware or software inefficiency. we headed to the room where the main fan coil unit is located to ensure that the hardware was installed and running as designed, after that, we moved to the building management system’s control room and reviewed the operative reports which showed no errors during the operative phase of the studied building. Accordingly, we decided to measure the IAT that was conducted by using three instruments at the three offices, as shown in Figure 7.
Figure 7. Isometric view showing the studied area
During the study period, the employees who are working in the selected offices were also requested to do normal activities with normal clothing, where the AC set point was 23℃ at all times. First, the Extech AN100: CFM/CMM Mini Thermo-Anemometer was used to record the IAT near the glazed facade in different orientations every working day at specific times, three times a day (8:00 am, 11:30 am, 2:00 pm) due to the effect of sun bath on the indoor temperature. At 8:00 am, the IAT near the east facade was higher than the IAT near south and north facades because the sun was facing it, whereas at 2:00 pm the IAT near the south facade was higher than the IAT near east and north facades. This is because the sun was facing it, which means the heat gain by direct sunlight is the highest at this facade. Table 1 shows the recorded IATs at three times before the implementation of CA. Moreover, the study was focused on offices that had openings to the eastern facade, with the privilege of symmetrical design allows to compare offices with more similar conditions and characteristics before and after implementing CA.
Table 1. The IATs recorded using a thermo-anemometer before the implementation of CA
|
Measurement Time |
IAT Near East Facade (℃) |
IAT at Desk Level (℃) |
||
|
W1 |
W2 |
W3 |
||
|
Day 1 |
||||
|
08:00 am |
42.9 |
35.6 |
22.9 |
29 |
|
11:30 am |
41.5 |
34.8 |
27.5 |
28.3 |
|
02:00 pm |
32.9 |
31.7 |
31.9 |
27.6 |
|
Day 2 |
||||
|
08:00 am |
48.6 |
43.8 |
22.5 |
28 |
|
11:30 am |
42.4 |
40.1 |
30.5 |
27.8 |
|
02:00 pm |
40.5 |
39.2 |
37.1 |
27.2 |
The second instrument which is Extech RHT20 the Humidity and Temperature Datalogger, was used to record physical measurements. The datalogger was set up at desk-level to automatically measure and capture any significant differences of IAT inside the studied offices every 45 minutes. In addition, the Fluke TIS10 9HZ Thermal Infrared Camera was used to record the temperatures of aluminum window frame every two hours during working days. These measurements were taken to investigate the effect of the CA on the aluminum window frames (right, left sides and bottom), as well as the heat gain through infiltration has been taken into consideration. Table 2 shows a set of these measurements.
Table 2. Temperatures of aluminum window frames recorded by a Thermal Infrared Camera before the implementation of CA
|
Measurement Time |
Window No. |
Temperature (℃) |
||
|
Left Side |
Right Side |
Bottom |
||
|
09:00 am |
W1 |
44.1 |
43 |
48 |
|
W2 |
40 |
47.5 |
46.4 |
|
|
W3 |
34.7 |
38.9 |
38.1 |
|
|
11:00 am |
W1 |
45 |
43.6 |
48.2 |
|
W2 |
41.8 |
48.9 |
49.6 |
|
|
W3 |
33.8 |
37.7 |
36.4 |
|
5.1.3 Cooling energy consumption rates
A simulation was conducted via HAP to estimate the cooling capacities required for the studied offices before implementing CA. The results listed in Table 3 indicate to the loads of chiller that required to achieve the IAT measured earlier.
Table 3. The energy demand for cooling before the implementation of CA
|
Zone No. |
Cooling Loads Before CA (kW) |
|
Zone 1 |
8225 |
|
Zone 2 |
8231 |
|
Zone 3 |
4115 |
5.2 After implementing corrective actions
5.2.1 Employees’ satisfaction
Employees were requested to explain in the interviews whether they are satisfied with the building thermal comfort level during working hours. The results showed that the percentage of employees’ dissatisfaction decreased to 15% of the sample with the thermal comfort. Moreover, employees were requested to describe the surrounding indoor environment after implementing CA. The results revealed that the percentage of unacceptability toward IAT decreased in comparison with the percentage of unacceptability toward IAT before implementing CA, that became 58%. Whilst, the acceptability toward IAT after implementing CA is 42%. This in turn, indicates that more employees expressed thermal acceptability after CA were implemented.
5.2.2 Indoor ambient temperature
After implementing CA, the employees who is working in the selected offices were requested to do normal activities with normal clothing. The AC was always set at 23℃. First, the Extech AN100: CFM/CMM Mini Thermo-Anemometer was used to record the IAT near the glazed facade in different orientations every working day at specific times, three times a day (8:00 am, 11:30 am, 2:00 pm) due to the sun bath affected the indoor temperature. At 8:00 am, the IAT near the east facade was higher than the IAT near south and north facades because the sun was facing it, whereas at 2:00 pm the IAT near the south facade was higher than the IAT near east and north facades. This is because the sun was facing it, which means the heat gain by direct sunlight is the highest at this facade. The recorded IATs at three times after the implementation of CA are listed in Table 4.
Table 4. The IATs recorded using a thermo-anemometer after the implementation of CA
|
Measurement Time |
IAT Near East Facade (℃) |
IAT at Desk Level (℃) |
||
|
W1 |
W2 |
W3 |
||
|
Day 1 |
||||
|
08:00 am |
41.5 |
34.2 |
21.5 |
26 |
|
11:30 am |
40.6 |
33.1 |
25.4 |
25.8 |
|
02:00 pm |
31.8 |
30.2 |
31.6 |
25.6 |
|
Day 2 |
||||
|
08:00 am |
44.4 |
44.2 |
26.6 |
25.6 |
|
11:30 am |
45.6 |
39.8 |
30.2 |
25.3 |
|
02:00 pm |
39.4 |
35.0 |
35.2 |
25.1 |
The statistical significance of the variation in work area temperatures were tested by the t-test. The result revealed that there is a significant difference with p < 0.001 as shown in Table 5. This means that the insulation has an effect on reducing the IAT of the desk level. The Extech RHT20 Humidity and Temperature Datalogger was applied to record physical measurements. The datalogger was set up at desk-level to automatically measure and capture any significant differences of IAT inside the studied offices every 45 minutes. The Fluke TIS10 9HZ Thermal Infrared Camera was applied to record the temperatures of aluminum window frame every two hours during working days. These measurements were conducted to reveal the effect of the CA on the aluminum frames (right, left sides and bottom), as well as the heat that gain through infiltration is taken into consideration. Table 6 portrays a set of temperatures on aluminum window frames.
Table 5. The t-test of work area temperatures (one sample test)
|
Cooling Shade |
t |
df |
Sig. (2-tailed) |
Mean Difference |
95% Confidence Interval of the Difference |
|
|
Lower |
Upper |
|||||
|
Cooling W_shade |
7.721 |
5 |
0.001 |
6784.17 |
4525.59 |
9042.75 |
|
Cooling W-O shade |
8.042 |
5 |
0.000 |
6908.33 |
4700.17 |
9116.50 |
Table 6. Temperatures of aluminum window frame recorded by a thermal infrared camera after the implementation of CA
|
Measurement Time |
Window No. |
Temperature (℃) |
||
|
Left Side |
Right Side |
Bottom |
||
|
09:00 am |
W1 |
44.6 |
48.7 |
47.4 |
|
W2 |
48.2 |
55.6 |
50.2 |
|
|
W3 |
32.7 |
38.2 |
36.5 |
|
|
11:00 am |
W1 |
45.9 |
43.3 |
45 |
|
W2 |
44.0 |
41.1 |
47.1 |
|
|
W3 |
32.7 |
38.2 |
36.5 |
|
The temperatures of aluminum window frame were recorded and analyzed. The t-test was performed to evaluate the statistical significance of the variation in the window frame comparison. The result demonstrated that there is no significant difference with p > 0.05 which indicates that the insulation has No impact on the frame thickness.
5.2.3 Cooling energy consumption rates
A simulation was conducted using the HAP to estimate the chiller capacities required for the studied offices after implementing CA. Table 7 shows the results indicate the loads of chiller required to achieve the IAT.
Table 7. The energy demand for cooling before the implementation of CA
|
Zone No. |
Cooling Loads After CA (kW) |
|
Zone 1 |
8104 |
|
Zone 2 |
8033 |
|
Zone 3 |
3995 |
The t-test was done to investigate the statistical significance of the difference between before and after CA in heating and cooling loads of the selected offices. The results showed that there is a significant difference of p < 0.001 for cooling loads of chiller at all targeted office zones, see Table 8.
Table 8. The t-test of work area temperatures (one sample test)
|
Cooling Shade |
t |
df |
Sig. (2-Tailed) |
Mean Difference |
95% Confidence Interval of the Difference |
|
|
Lower |
Upper |
|||||
|
Cooling W_shade |
7.524 |
5 |
0.001 |
5703.66 |
3755.07 |
7652.27 |
|
Cooling W-O shade |
7.677 |
5 |
0.001 |
5712.00 |
3799.47 |
7624.53 |
The conducted measures after the implementation of CA to validate the assumption. The results clearly showed a notable enhancement in the building's thermal comfort without any increase in the energy consumption or the energy bill of the targeted building. Based on the results and discussions, the following conclusions can be drawn:
Employees’ satisfaction improved and became more comfortable with the indoor environment after implementing CA. As stipulated in IOS 7730 standard, the spaces can be considered thermally comfortable when the employees feel neither warmer nor cooler. Consequently, changing functions during the construction phase or when the building in use represents a major challenge affecting both employees' thermal comfort and the energy consumption. Furthermore, mistakes during design phase have effects on thermal comfort, thus increase energy consumption as well as decrease employees’ satisfaction. Therefore, Implementation of CA helped in improving the indoor quality without increasing the capacity of HVAC system when the building in use, but does not solving the problem.
This study investigated the thermal comfort during the operation phase to figure out the causes of increasing energy consumption and employees’ satisfaction which are the heat flow through aluminum windows frames and a high temperature close to glazed facade depends on the sun path orientation. Afterward, CA are proposed based on the outcomes of analysis before implementation of CA. Finally, generalizing the proposed CA is not feasible, due to proposing CA depends on the analysis of the space when it in use to find out the problems.
Achieving thermal comfort is a complex issue. Understanding the thermal comfort concept throughout all project life cycles will increase the number of occupants who experience a high level of thermal comfort. we recommend to highlight the following important issues:
•An important factor contributing to dissatisfaction with human thermal comfort in any building is change functions of original design when the building in use. A new simulation must be performed before the changing orders approved.
•Periodic tests are needed to ensure that the HVAC system is efficient to do the work with no increment in the energy consumption ratio, the maintenance has also a key role to keep the system running efficiently.
•It is not recommended to use traditional aluminum window frames in building envelopes in Jordan. Isolated aluminum frames or PVC windows instead of using traditional aluminum will provide much better control to building thermal comfort.
•More research and studies are needed to evaluate the thermal comfort situation in public office blocks in Jordan. The implementation of CA should be proposed to improve thermal comfort without increasing energy consumption because Jordan is one of the countries with limited energy sources.
[1] González-Torres, M., Pérez-Lombard, L., Coronel, J.F., Maestre, I.R., Yan, D. (2022). A review on buildings energy information: Trends, end-uses, fuels and drivers. Energy Reports, 8: 626-637. https://doi.org/10.1016/j.egyr.2021.11.280
[2] Nejat, P., Jomehzadeh, F., Taheri, M.M., Gohari, M., Majid, M.Z.A. (2015). A global review of energy consumption, CO2 emissions and policy in the residential sector (with an overview of the top ten CO2 emitting countries). Renewable and Sustainable Energy Reviews, 43: 843-862. https://doi.org/10.1016/j.rser.2014.11.066
[3] Ibrahim, M. (2019). Effects of art and design on orientation in healthcare architecture: A study of wayfinding and wayshowing in a Swedish hospital setting. Doctoral dissertation, Lund University.
[4] Arif, M., Katafygiotou, M., Mazroei, A., Kaushik, A., Elsarrag, E. (2016). Impact of indoor environmental quality on occupant well-being and comfort: A review of the literature. International Journal of Sustainable Built Environment, 5(1): 1-11. https://doi.org/10.1016/j.ijsbe.2016.03.006
[5] Rasheed, E.O., Khoshbakht, M., Baird, G. (2021). Time spent in the office and workers’ productivity, comfort and health: A perception study. Building and Environment, 195: 107747. https://doi.org/10.1016/j.buildenv.2021.107747
[6] Sandri, S., Hussein, H., Alshyab, N. (2020). Sustainability of the energy sector in Jordan: Challenges and opportunities. Sustainability, 12(24): 10465. https://doi.org/10.3390/su122410465
[7] Nazer, H. (2019). Developing an Energy Benchmark for Residential Apartments in Amman. Jordan Green Building Council.
[8] Al-Omari, K., Okasheh, H. (2017). The influence of work environment on job performance: A case study of engineering company in Jordan. International Journal of Applied Engineering Research, 12(24): 15544-15550.
[9] McArthur, J.J., Jofeh, C., Aguilar, A.M. (2015). Improving occupant wellness in commercial office buildings through energy conservation retrofits. Buildings, 5(4): 1171-1186. https://doi.org/10.3390/buildings5041171
[10] Da Silva, C.F., Freire, R.Z., Mendes, N. (2018). Optimization applied to energy efficiency and thermal comfort of buildings: Bibliometric analysis on techniques and applications. Revista de Engenharia Térmica, 17(2): 20-27.
[11] de Dear, R. (2004). Thermal comfort in practice. Indoor Air, 14(Suppl 7): 32-39. https://doi.org/10.1111/j.1600-0668.2004.00270.x
[12] Park, J.Y., Nagy, Z. (2018). Comprehensive analysis of the relationship between thermal comfort and building control research-A data-driven literature review. Renewable and Sustainable Energy Reviews, 82: 2664-2679. https://doi.org/10.1016/j.rser.2017.09.102
[13] Sadick, A.M., Kpamma, Z.E., Agyefi-Mensah, S. (2020). Impact of indoor environmental quality on job satisfaction and self-reported productivity of university employees in a tropical African climate. Building and Environment, 181: 107102. https://doi.org/10.1016/j.buildenv.2020.107102
[14] Andargie, M.S., Azar, E. (2019). An applied framework to evaluate the impact of indoor office environmental factors on occupants’ comfort and working conditions. Sustainable Cities and Society, 46: 101447. https://doi.org/10.1016/j.scs.2019.101447
[15] Huizenga, C., Abbaszadeh, S., Zagreus, L., Arens, E.A. (2006). Air quality and thermal comfort in office buildings: Results of a large indoor environmental quality survey. Proceedings of Healthy Buildings, 3: 393-397.
[16] Ameen, A., Mattsson, M., Boström, H., Lindelöw, H. (2023). Assessment of thermal comfort and air quality in office rooms of a historic building: A case study in springtime in continental climate. Buildings, 13(1): 156. https://doi.org/10.3390/buildings13010156
[17] Karmann, C., Schiavon, S., Arens, E. (2018). Percentage of commercial buildings showing at least 80% occupant satisfied with their thermal comfort. In Proceedings of 10th Windsor Conference: Rethinking Comfort Cumberland Lodge, Windsor, UK.
[18] Silva, A.S., Ghisi, E., Lamberts, R. (2016). Performance evaluation of long-term thermal comfort indices in building simulation according to ASHRAE Standard 55. Building and Environment, 102: 95-115. https://doi.org/10.1016/j.buildenv.2016.03.004
[19] Thermal environmental conditions for human occupancy. ANSI/ASHRAE Standard 55. https://www.ashrae.org/technical-resources/bookstore/standard-55-thermal-environmental-conditions-for-human-occupancy.
[20] Djongyang, N., Tchinda, R., Njomo, D. (2012). Estimation of some comfort parameters for sleeping environments in dry-tropical sub-Saharan Africa region. Energy Conversion and Management, 58: 110-119. https://doi.org/10.1016/j.enconman.2012.01.012
[21] Teixeira, L., Talaia, M., Morgado, M. (2014). Evaluation of indoor thermal environment of manufacturing industry. Occupational Safety and Hygiene II, 553-558.
[22] Van Hoof, J., Mazej, M., Hensen, J.L.M. (2010). Thermal comfort: Research and practice. Frontiers in Bioscience, 15(2): 765-788. https://doi.org/10.2741/3645
[23] Alam, M.S., Salve, U.R. (2021). Factors affecting on human thermal comfort inside the kitchen area of railway pantry car-a review. Journal of Thermal Engineering, 7(Supp 14): 2093-2106. https://doi.org/10.18186/thermal.1051612
[24] Albatayneh, A., Jaradat, M., AlKhatib, M.B., Abdallah, R., Juaidi, A., Manzano-Agugliaro, F. (2021). The significance of the adaptive thermal comfort practice over the structure retrofits to sustain indoor thermal comfort. Energies, 14(10): 2946. https://doi.org/10.3390/en14102946
[25] Rupp, R.F., Vásquez, N.G., Lamberts, R. (2015). A review of human thermal comfort in the built environment. Energy and Buildings, 105: 178-205. https://doi.org/10.1016/j.enbuild.2015.07.047
[26] Al Horr, Y., Arif, M., Kaushik, A., Mazroei, A., Katafygiotou, M., Elsarrag, E. (2016). Occupant productivity and office indoor environment quality: A review of the literature. Building and Environment, 105: 369-389. https://doi.org/10.1016/j.buildenv.2016.06.001
[27] Guan, J., Alonso, M.J., Mathisen, H.M. (2016). Questionnaire study of indoor environment in two office buildings in Norway: One ordinary renovated and the other highly energy efficient renovated. Indoor Air.
[28] Marigo, M., Carnieletto, L., Moro, C., Arcelli, T., Ciloni, C., Turchi, G.P., De Carli, M., Di Bella, A. (2023). Thermal comfort and productivity in a workplace: An alternative approach evaluating productivity management inside a test room using textual analysis. Building and Environment, 245: 110836. https://doi.org/10.1016/j.buildenv.2023.110836
[29] Awadallah, T., Adas, H., Obaidat, Y., Jarrar, I. (2009). Energy efficient building code for Jordan. Conference in Jerusalem, vol. 1, pp. 1-4. https://citeseerx.ist.psu.edu/document?repid=rep1&type=pdf&doi=b9af9b482d1731bc8b2525dd40d5c20662ae5fa3.
[30] JUST (2019). Quick Facts, in Information Technology and Communication Center, Jordan University of Science and Technology, https://www.just.edu.jo/Documents/Quick-Facts-English.pdf.
[31] Jones, D.S., King, K.K. (1995). The implementation of prompt corrective action: An assessment. Journal of Banking & Finance, 19(3-4): 491-510. https://doi.org/10.1016/0378-4266(94)00135-P
[32] Okes, D. (2019). Root Cause Analysis: The Core of Problem Solving and Corrective Action. Quality Press.