Wenyong Liu![]() | Changsheng Li*
| Changsheng Li*![]() | Chenyang Qi
| Chenyang Qi![]() | Lei Zhang
| Lei Zhang![]() | Jing Hui
| Jing Hui![]() | Yixin Li
| Yixin Li![]()
© 2024 The authors. This article is published by IIETA and is licensed under the CC BY 4.0 license (http://creativecommons.org/licenses/by/4.0/).
OPEN ACCESS
Mine coal spontaneous combustion is one of the five major natural disasters in coal mines, and determining the concealed fire source locations of coal spontaneous combustion is key to solving the problem. This paper determines the thermal conductivity of coal samples through a spherical heat conduction model, and based on experimental data, analyzes the fitting relationship between thermal conductivity and heating voltage, the outer wall temperature of the inner sphere, and the location of high-temperature points under different voltage conditions. The study concludes that there is a linear relationship between thermal conductivity and both heating voltage and outer wall temperature, with a correlation coefficient greater than 0.9. In ideal conditions, the highest temperature is located at the center of the flat wall of the spherical heat conduction model. This re-search provides a mathematical basis for the prevention and control of mine coal spontaneous combustion fires.
thermal conductivity, spherical heat conduction model, ignition source, high-temperature region
China is the world's largest producer and consumer of coal, boasting rich mineral resources, with coal still playing an important role in the country's energy structure [1-4]. Over the past decade, coal has consistently accounted for more than 65% of China's energy production structure, while the proportions of other fossil fuels such as oil and natural gas have remained below 10% [5]. With the rapid development of the economy, the demand for energy continues to increase. Due to China's situation of being rich in coal but poor in oil, the characteristics of production and consumption mainly based on coal will not change for a considerable time in the future [6, 7]. Spontaneous combustion of coal is one of the major natural disasters faced in coal mining [8]. Investigations show that about 100 to 200 million tons of coal are lost each year due to natural spontaneous combustion, accounting for about 20% of the national annual coal output. More seriously, it endangers human and property safety, causing catastrophic ecological damage and environmental pollution. More than 70% of mine fires are caused by spontaneous combustion of coal, with the majority of natural ignitions occurring in goaf areas and broken coal pillars along the roadway. Spontaneous combustion not only burns valuable coal resources, causing huge economic losses, but also releases a large amount of harmful gases, severely polluting the air and environment. Moreover, coal spontaneous combustion can often lead to gas combustion, dust explosions, and other accidents, resulting in serious casualties [9-13]. If the location of the fire source cannot be accurately determined, targeted measures and means cannot be taken to directly eliminate the fire source, because the ignition location of coal spontaneous combustion often has a concealed nature, not easy to detect, thus researching the ignition location of coal spontaneous combustion becomes particularly critical [14, 15].
Due to the large amount of residual coal in the goaf, which is prone to spontaneous combustion and can trigger fires, the goaf is one of the most severe areas for natural coal fire, accounting for more than 60% of the total number of spontaneous combustion areas [16, 17]. The special nature of the goaf prevents personnel from entering to obtain information about the fire source, therefore, data measured during the period of spontaneous fire must be used for inverse positioning to provide technical support for extinguishing fires in the goaf. Currently, methods used domestically and internationally for detecting the location of fire sources mainly include magnetic detection, resistivity detection, gas detection, radon measurement, electromagnetic wave detection, infrared detection, and temperature detection methods, etc. [18]. Among these methods, few are directly used for detecting fire sources in underground fire areas, and there are some limitations for the above methods in addressing the issue of spontaneous combustion in deep areas and goafs. For example, magnetic detection is mainly used to detect old burned areas and is less used in detecting fire sources in production mines. Other detection methods are easily influenced by geological conditions, have poor anti-interference ability, leading to lower accuracy of measurement results. The detection of concealed fire source locations in the goaf still faces challenges and requires further study.
For spontaneous combustion of coal, we cannot directly observe the location and temperature of the fire source, but we can explore the location of high-temperature points through experiments on thermal conductivity combined with geometric analysis. Therefore, it is necessary to conduct inverse calculations of the temperature field of the fire source, that is, to infer the whole from the part, to find the essence through phenomena [19-21]. This research will use the spherical method to measure the thermal conductivity of granular materials to determine the thermal conductivity of coal samples and perform geometric analysis of high-temperature regions to estimate the location of high-temperature points. By studying the calculation method for determining high-temperature points in loose coal bodies based on thermal conductivity, it aims to provide new ideas for coal fire disaster prevention and control methods and to provide a theoretical basis for the active prevention and control of coal spontaneous combustion.
2.1 Experimental background
Tunnel fires are an important component of mine fires. The spontaneous combustion of coal in the loose zone of tunnels is an inward-outward heat release process, and the radiant heat within the loose zone coal is extremely low, approximately equal to zero. At the same time, the airflow in the loose zone of the tunnel is not smooth, and the convective heat dissipation is minimal. Therefore, the spontaneous combustion process of loose coal within the loose zone of the tunnel can be approximated as a heat conduction process from a spontaneous hot spot source to the surrounding area.
In summary, solving the spontaneous combustion problem of loose coal within the loose zone of tunnels can be addressed using the steady-state spherical heat conduction model. In the steady-state spherical heat conduction process, as long as the thermal conductivity is obtained, the position and depth of the high-temperature point can be calculated.
2.2 Experimental principles and devices
The existence form or state of the fire source is closely related to the state of the coal body, the structure of the surrounding rock, and the shape of cracks (fissures), which involves uncertainties [22]. Therefore, it is treated as an ignition source for the study. The schematic diagram of the spherical experimental apparatus used in the experiment is shown in Figure 1. Without considering the range of the fire source, it is assumed that there is a single fire source, and the position of the fire source is at the center of the spherical experimental apparatus. It is also assumed that the medium near the high-temperature fire source is uniform and isotropic, and the heat is conducted outward uniformly. By applying Fourier's law of heat conduction and known conditions, equations are established, and the position of the fire source point relative to the wall is solved inversely [23-25]. It is now required to calculate the thermal conductivity of loose coal bodies. By using the spherical method to determine the thermal conductivity measurement device for insulating materials, the thermal conductivity of the material is obtained by measuring the outer wall temperature of the inner sphere and the inner wall temperature of the outer sphere based on different input voltages, and then the position and intensity of the fire source point are solved inversely by substituting these values into the equation.
Figure 1. Schematic diagram of experimental principle
The sphere method for measuring the thermal conductivity of materials is based on the one-dimensional steady-state heat conduction process of a spherical wall with uniform thickness. It is particularly suitable for granular loose materials. The construction of a sphere thermal conductivity meter can be divided into two types based on the different cooling methods of the sphere: free airflow cooling and constant temperature liquid forced cooling. This experiment adopted the latter method, using a constant temperature water-cooled jacketed sphere.
The main body consists of two copper spherical shells, 1 and 2, with a thickness of 1-2 mm. The outer diameter of the inner shell is d1, and the inner diameter of the outer shell is d2. The space between the two shells is uniformly filled with granular loose material. Generally, d2 ranges from 160 to 220 mm, d1 ranges from 30 to 60 mm, so the thickness of the filled material is about 50 mm. An electric heater is installed inside the inner shell, and the heat generated is conducted through the wall and the filling material to the outer shell. To keep the inner and outer shells concentric, there are support rods between the two shells.
There are generally two ways of heat dissipation for the outer shell: one is to use free airflow (with radiation) to remove heat from the outer shell, and the other is to add a cooling liquid jacket to the outer shell, with constant temperature water or other low-temperature liquids as the cooling medium. This experiment used a double water jacket structure. To ensure that the constant temperature effect of the liquid jacket is not affected by the external environment temperature, an additional insulating liquid jacket is installed outside the constant temperature liquid jacket.
The experimental setup is checked since the inner and outer spheres are completely concentric, the test specimen is homogeneous, and the temperatures of the inner and outer spheres' specific surfaces are uniform. In this experiment, the natural convection state of the outer sphere shell is maintained stable, establishing a one-dimensional steady-state temperature field within the specimen. Applying Fourier's law of heat conduction to this spherical wall's heat conduction process, the experimental conditions for measuring thermal conductivity are shown in Table 1.
Table 1. Experimental conditions for measuring thermal conductivity of granular materials by spherical method
|
Coal Sample Mass/g |
Inner Sphere Volume/cm3 |
Outer Sphere Volume/cm3 |
Coal Sample Density/(g/cm3) |
Coal Sample Prosity/% |
|
2000~2500 |
220.89 |
2806.19 |
0.873 |
36.34 |
2.3 Experimental conditions
The Heilonggou Mine is located in Jinjie Town, Shenmu City, Yulin City, Shaanxi Province. In May 2022, a spontaneous fire occurred in the old tunnel of the overlying coal seam of this mine. The overlying coal seam is a mined and sealed seam without high-volume leakage air supply conditions. The interlayer distance from the production area is 15-20 meters, and the interlayer distance at the spontaneous fire site is about 18 meters. Three equidistant holes were drilled in the coal seam in the fire area, and the temperatures t1, t2, and t3 in these equidistant holes were measured using a thermometer. It is required to calculate the position and temperature of the high-temperature point in the overlying coal seam.
To effectively measure the position and temperature of the high-temperature point in the overlying coal seam, it is necessary to know the thermal conductivity of the loose coal body according to the steady-state spherical heat conduction model. To achieve this measurement, coal samples from the overlying coal seam were taken from the mine, and the particle size distribution of the loose coal body in the fire area was obtained using a drilling core sampling method, as shown in Table 2.
Table 2. Particle size distribution data of loose coal body from drilling core sampling
|
Particle Size (mm) |
<0.9 |
0.9-3 |
3-5 |
5-7 |
7-9 |
>10 |
Remarks |
|
Mass (g) |
26.8 |
37.9 |
65.4 |
102.5 |
88.6 |
54.3 |
|
|
Proportion (%) |
7.1 |
10.1 |
17.4 |
27.3 |
23.6 |
14.5 |
|
2.4 Coal sample preparation
Based on the coal sample quality conditions in Table 1 and the mass percentage requirements for each particle size in Table 2, it is necessary to crush and prepare the coal samples from the fire area of the Heilonggou Mine.
Experimental studies have shown that the particle size of loose materials directly affects their thermal conductivity. The larger the particle size, the higher the porosity, resulting in different thermal conductivity test results depending on the material and porosity. For loose coal bodies, larger particle sizes result in higher thermal conductivity. Therefore, to more accurately measure the thermal conductivity of loose coal bodies, it is necessary to prepare loose coal bodies with proportions close to actual conditions.
The particle size of coal samples not only directly affects the air leakage and heat storage environment but also directly relates to the test results of the steady-state spherical thermal conductivity. By comparing particle size conditions and combining the particle size distribution obtained from field tests, the test coal samples are crushed and screened. According to the total sample weight requirement of 2200g, the mass of each particle size coal sample is calculated according to the mass distribution in Table 2, as shown in Table 3.
Table 3. Distribution data of each particle size coal sample for experimental testing
|
Particle Size (mm) |
<0.9 |
0.9-3 |
3-5 |
5-7 |
7-9 |
>9 |
Remarks |
|
Proportion (%) |
7.1 |
10.1 |
17.4 |
27.3 |
23.6 |
14.5 |
|
|
Mass (g) |
157.0 |
222.1 |
383.2 |
600.5 |
519.1 |
318.1 |
|
Based on this, the authors obtained block raw coal from the non-water-immersed area of the main mining working face of the spontaneous combustion mine. The raw coal was sealed tightly and sent to the laboratory of Xi'an University of Science and Technology. After removing the surface oxidation layer, the coal was processed using a jaw crusher and manually treated to obtain coal samples with particle sizes of <0.9mm, 0.9-3mm, 3-5mm, 5-7mm, 7-9mm, and >9mm. Each coal sample was prepared and screened according to the mass calculated in Table 3. Before the experiment, the coal samples were placed in a vacuum drying oven at 50°C for 24 hours. After drying, the coal samples were sealed in vacuum bags and then placed in a desiccator for storage.
3.1 Experimental data processing
Assuming the inner diameters of the spherical wall are d1 and d2 (with radii r1 and r2, respectively). Let the inner and outer surface temperatures of the spherical wall be maintained at t1 and t2, respectively, and remain stable. Applying Fourier's law of heat conduction to the conduction process of this spherical wall yields Eq. (1):
$Q=-\lambda F \frac{d t}{d r}=-\lambda 4 \pi r^2 \frac{d t}{d r}$ (1)
When the boundary condition is $r=r_1, t=t_1$; when $r=r_2, t=t_2$. Since the thermal conductivity of most engineering materials can be treated as a linear relationship with temperature over a not too wide temperature range, integrating Eq. (1) and substituting the boundary conditions into it yields Eq. (2):
$\lambda_m=\frac{Q \delta}{\pi d_1 d_2\left(t_1-t_2\right)}$ (2)
where, $\lambda m$ s the thermal conductivity of the material between the spherical walls at $\mathrm{tm}=\left(\mathrm{t}_1+\mathrm{t}_2\right) / 2$ , in $\mathrm{W} /\left(\mathrm{m} \cdot{ }^{\circ} \mathrm{C}\right) ; Q$ is the electrical heating power, in $\mathrm{W} ; \delta$ is the thickness of the material between the spherical walls, $\delta=\left(\mathrm{d}_1-\mathrm{d}_2\right) / 2$, in $\mathrm{m}$ .
After the power is turned on, the electrical heating power can be calculated using the heating voltage, current, and heating time as shown in Eq. (3):
$Q=\bar{U} \cdot \bar{I} \cdot T / 60$ (3)
where, $\bar{U}$ is the actual average voltage, in $\mathrm{V} ; \bar{I}$ is the actual average current, in $\mathrm{A} ; T$ is the actual heating time, in s. Assuming the thermal conductivity has a certain functional relationship with temperature, i.e., $\lambda=f(t)$. Using the spherical method to measure the thermal conductivity of granular materials, the method of changing the heating voltage is adopted, starting from 30V as the first set of data, with 10V as the gradient, and each subsequent set increasing by 10V. The calculated data of thermal conductivity under different heating voltages are shown in Table 4.
Table 4. Values of parameters under different heating voltages
|
Heating Voltage/V |
Average Voltage/V |
Average Current/A |
Inner Sphere Outer Wall Temperature, t1/℃ |
Outer Sphere Outer Wall Temperature, t2/℃ |
Heating Time, T/s |
|
40 |
35.7 |
0.1 |
53 |
48.7 |
23.2 |
|
50 |
36.3 |
0.1 |
70 |
53.6 |
26 |
|
60 |
43.2 |
0.1 |
82 |
63.5 |
28.9 |
|
70 |
46 |
0.1 |
94 |
72.1 |
31.4 |
3.2 Experimental data analysis
3.2.1 Relationship between thermal conductivity and heating voltage u and inner sphere outer wall temperature t1
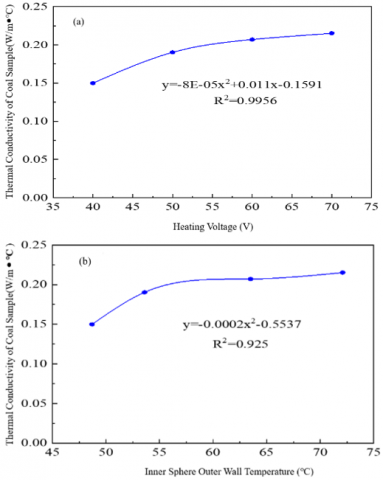
The fitting relationship between thermal conductivity and heating voltage U and inner sphere outer wall temperature t1 is shown in Figure 2. From Figure 2a, it can be observed that there is a linear relationship between thermal conductivity and heating voltage U, with a fitted function of $y=-8 E-05 x^2+0.011 x-0.1591$ nd a correlation coefficient $\mathrm{R}^2=0.9956$. From Figure 2b, it can be seen that there is also a linear relationship between thermal conductivity and inner sphere outer wall temperature $\mathrm{t}_1$, with a fitted function of $y=-0.0002 x^2-0.5537$ and a correlation coefficient $R^2=0.925$. Both correlation coefficients $\mathrm{R}^2$ are greater than 0.9, indicating a good linear relationship and fitting degree between the two variables.
Figure 2. Fitting relationship between thermal conductivity and heating voltage U and inner sphere outer wall temperature t1
3.2.2 Determination of fire zone position, temperature, and range
In the temperature field of the same isothermal surface in the spherical model, the temperature variation can be expressed by Fourier's law:
$Q=-\mathrm{A} \lambda \frac{t_1-t_2}{\sigma}$ (4)
where, $Q-$ heat, in $\mathrm{W} ; A-$ unit area; $\lambda-$ thermal conductivity of coal; $t_1$ and $t_2-$ temperatures of two points; $\sigma-$ distance between two points.
Under the conditions of the spherical model, the temperature distribution on any flat wall outside the ignited coal seam is circular, and the center temperature of the ring decreases towards the outer temperature of the ring. The ignition source center position is located at the highest center temperature of this flat wall, perpendicular to the perpendicular line of the flat wall, as shown in Figure 3. Assuming the temperature is $t_1$,the distance between this position and the ignition source is $r_1$ Taking two points with temperatures $t_1$, $t_2$, and $t_3$ at the same interval $L$ on a straight line, the geometric relationship can be obtained as:
$r_1^2+L^2=r_2^2$ (5)
$r_1^2+4 L^2=r_3^2$ (6)
Figure 3. Geometric calculation model
Combining boundary conditions and Eqs. (2), (5), and (6), we have:
$\lambda=\frac{Q\left(r_m-r\right)}{4 \pi r r_m \Delta t}$ (7)
From Figure 3, it can be observed that under ideal conditions, the highest temperature is located at the center of the flat wall, with its position closest to the fire zone and perpendicular inwardly, passing through the fire zone position. By substituting $t_1, t_2$ and $t_3$ into Eq. (7), we can simplify it as:
$\left\{\begin{array}{l}\frac{\left(r_1-r\right)}{r_1\left(\mathrm{t}-\mathrm{t}_1\right)}=\frac{\left(r_2-r\right)}{r_2\left(\mathrm{t}-\mathrm{t}_2\right)} \\ \frac{\left(r_1-\mathrm{r}\right)}{r_1\left(\mathrm{t}-\mathrm{t}_1\right)}=\frac{\left(r_3-r\right)}{r_3\left(\mathrm{t}-\mathrm{t}_3\right)}\end{array}\right.$ (8)
4.1 Analysis of thermal conductivity error
Analyzing the fitting relationship between thermal conductivity and heating voltage U, as well as inner sphere outer wall temperature t1, reveals a good linear relationship in the experimental results. The main cause of experimental errors is likely systematic errors, such as uneven filling of granular materials leading to a decrease in thermal conductivity and a decline in thermal performance. Inaccurate measurement of heating resistance temperature results in an overestimation of t1 during the experiment, leading to a smaller experimental result. Systematic errors may also arise from insufficient accuracy of components (ammeter, voltmeter) and internal structural issues of the sphere. Additionally, the small temperature difference between the inner and outer sphere shells can contribute to the error.
4.2 Analysis of model error in fire source localization in high-temperature areas
Analysis of the calculation results of the fire source localization model reveals a certain degree of error compared to the actual situation. The possible reasons for this error are as follows:
(1) Model Error in Spherical Model: In the spherical shell model, to simplify the problem and calculation difficulty, variations in the density of coal around the fire source, changes in porosity, and variations in thermal conductivity due to temperature changes are all ignored. The crushed coal is considered a homogeneous medium. While this simplification reduces the complexity of the model and calculation, it also introduces discrepancies compared to the actual situation.
(2) Observational Error: For known quantities obtained in this experiment, such as thermal conductivity measured by the shell method, the data are manually recorded and processed. Accumulation of observational errors can lead to errors in the final model results.
(3) Computational Error: The results obtained from the computational model in this experiment are based on calculations performed by a computer. However, the number of calculations may not reach the level of hundreds or thousands, and while the results may not be "swamped" by errors, the generated error is still significant and cannot be ignored.
In practical situations, the thermal conductivity of coal is influenced by both environmental factors and its own properties. While constructing the geometric model, this study assumed uniformity among all points, neglecting the differences in thermal conductivity coefficients at each discrete point. Therefore, it is necessary to analyze the factors influencing the thermal conductivity of coal.
(1) Porosity
The porosity of coal varies, leading to significant differences in its thermal conductivity. When gas enters the pores, the thermal conductivity of the test block decreases due to the reduced thermal conductivity coefficient of the gas. Thus, the thermal conductivity of coal is negatively correlated with porosity and temperature. As porosity increases and temperature rises, the thermal conductivity of coal decreases [26].
(2) Degree of Coalification
The thermal conductivity of coal is closely related to its composition, and the degree of coalification is a crucial factor determining coal composition. Coal of different degrees of coalification exhibits differences in composition (volatile matter, moisture, ash content, etc.). Coal with higher volatile matter and ash content tends to have a lower degree of coalification and a higher thermal conductivity coefficient.
(3) Uniformity of the Medium
Generally, the thermal conductivity coefficient of single-crystal materials is slightly higher than that of polycrystalline materials. Coal seam structures are complex, leading to a lower thermal conductivity coefficient. The more complex the chemical composition of the coal seam, the more impurities present, or the more solid solutes formed after the addition of components, and the lower the thermal conductivity coefficient. This is because the addition of impurities and the formation of solid solutes tend to cause lattice distortion, torsion, and dislocation, disrupting the integrity of the crystal and resulting in a slightly poorer thermal conductivity.
This study employed a combined approach of experimentation and geometric analysis to analyze the correlation between thermal conductivity and voltage, temperature, and predict the high-temperature points of loose media by abstracting the spherical experimental device into a two-dimensional geometric model. The findings provide a mathematical basis for the prevention and control of coal spontaneous combustion fires in mines.
(1) Using the spherical thermal conductivity model, the thermal conductivity coefficient of coal samples was determined experimentally. The fitting relationship between thermal conductivity and heating voltage (U) and the temperature of the outer wall of the inner sphere (t1) was analyzed and established.
(2) By employing the geometric analysis method, the spherical experimental device was transformed into a two-dimensional model, determining the positions of high-temperature points in loose coal bodies.
[1] Fan, X., Zhang, L. (2022). Inter-provincial carbon emission intensity factor analysis and carbon intensity projection calculation in China. Ecological Economy, 18(4): 242-260.
[2] Jiang, D.L. (2022). Transformation and development of the coal-based energy industry under the goals of carbon peaking and carbon neutrality. Chinese Journal of Urban and Environmental Studies, 10(2): 17-28. https://doi.org/10.1142/s2345748122500087
[3] Wang, Z., Ma, J. (2021). Green Transformation of the energy system under the vision of carbon neutrality. China Oil & Gas, 28(4): 3-7.
[4] Shan, Y., Guan, Y., Hang, Y., Zheng, H., Li, Y., Guan, D., Li, J., Zhou, Y., Li, L., Hubacek, K. (2022). City-level emission peak and drivers in China. Science Bulletin, 67(18): 1910-1920. https://doi.org/10.1016/j.scib.2022.08.024
[5] Wang, K., Sun, L., Wang, J., Liu, L. (2024). The electricity, industrial, and agricultural sectors under changing climate: Adaptation and mitigation in China. National Science Open, 3(1): 100-146. https://doi.org/10.1360/nso/20230023
[6] Jun, L.D., Jian, W., Chuang, J.W., Wei, H.W. (2023). Safe and intelligent mining: Some exploration and challenges in the era of big data. Journal of Central South Universi-ty, 30(6): 1900-1914.
[7] Zou, C., Pan, S., Hao, Q. (2020). On the connotation, challenge and significance of China's “energy independence” strategy. Petroleum Exploration and Development, 47(2): 449-462. https://doi.org/10.1016/s1876-3804(20)60062-3
[8] Xu, Y.L., Huo, X.W., Wang, L.Y., Gong, X.J., Lv, Z.C., Zhao, T. (2024). Spontaneous combustion properties and quantitative characterization of catastrophic temperature for pre-oxidized broken coal under stress. Energy, 288: 129857. https://doi.org/10.1016/j.energy.2023.129857
[9] Pan, R., Fu, D., Xiao, Z., Chen, L. (2018). The inducement of coal spontaneous combustion disaster and control technology in a wide range of coal mine closed area. Environmental Earth Sciences, 77(10): 1-7. https://doi.org/10.1007/s12665-018-7540-1
[10] Bian, Z., Inyang, H.I., Daniels, J.L., Otto, F., Struthers, S. (2010). Environmental issues from coal mining and their solutions. Mining Science and Technology (China), 20(2): 215-223. https://doi.org/10.1016/S1674-5264(09)60187-3
[11] Jiao, T., Fan, H., Liu, S., Yang, S., Du, W., Shi, P., Yang, C., Wang, Y., Shangguan, J. (2021). A review on nitrogen transformation and conversion during coal pyrolysis and combustion based on quantum chemical calculation and experimental study. Chinese Journal of Chemical Engineering, 35: 107-123. https://doi.org/10.1016/j.cjche.2021.05.010
[12] Jin, Y.F., Yan, L., Liu, Y., Li, C.S. (2021). The spatiotemporal changes of oxygen consumption rate and heat release intensity during coal spontaneous combustion. International Journal of Heat and Technology, 39(4): 1287-1293. https://doi.org/10.18280/ijht.390427
[13] Kuai, D.L. (2021). Distribution law of three spontaneous combustion zones in the goaf area of a fully mechanized working face under high ground temperature. Environmental and Earth Sciences Research Journal, 8(2): 86-90. https://doi.org/10.18280/eesrj.080204
[14] Onifade, M., Genc, B. (2020). A review of research on spontaneous combustion of coal. International Journal of Mining Science and Technology, 30(3): 303-311. https://doi.org/10. 1016/j.ijmst.2020.03.001
[15] Wang, W., Qi, Y., Jia, B., Yao, Y. (2021). Dynamic prediction model of spontaneous combustion risk in goaf based on improved CRITIC-G2-TOPSIS method and its application. PloS One, 16(10): e0257499. https://doi.org/10.1371/journal.pone.0257499
[16] Lu, W., Cao, Y.J., Tien, C.J. (2017). Method for prevention and control of spontaneous combustion of coal seam and its application in mining field. International Journal of Mining Science and Technology, 27(5): 839-846.
https://doi.org/10.1016/j.ijmst.2017.07.018
[17] Liang, Y., Tian, F., Luo, H., Tang, H. (2015). Characteristics of coal re-oxidation based on microstructural and spectral observation. International Journal of Mining Science and Technology, 25(5): 749-754. https://doi.org/10.1016/j.ijmst. 2017.07.018
[18] Liu, C., Xie, J., Xin, L. (2019). Review of technology research on prediction of coal spontaneous combustion. Mining Safety and Environmental Protection, 46(3): 92-95, 99.
[19] Long, X., Liu, F., Xie, H., Lin, W., Liu, Y., Li, C. (2022). Seismic geothermal resource exploration based on CPU/GPU collaborative parallel prestack time migration. Acta Geologica Sinica‐English Edition, 96(5): 1742-1751. https://doi.org/10.1111/1755-6724.14895
[20] Ding, Y., Li, S., Zhu, B., Lin, H., Zhang, J., Tan, J., Chen, W. (2023). Research on the feasibility of storage and estimation model of storage capacity of CO2 in fissures of coal mine old goaf. International Journal of Mining Science and Technology, 33(6): 675-686. https://doi.org/10.1016/j.ijmst.2023.03.003
[21] Rui, Y., Zhou, Z., Cai, X., Lan, R., Zhao, C. (2022). A novel robust AE/MS source location method using optimized M-estimate consensus sample. International Journal of Mining Science and Technology, 32(4): 779-791. https://doi.org/10.1016/j.ijmst.2022.06.003
[22] Zhang, L. M., Cong, Y., Meng, F. Z., Wang, Z. Q., Zhang, P., Gao, S. (2021). Energy evolution analysis and failure criteria for rock under different stress paths. Acta Geotechnica, 16(2): 569-580.
https://doi.org/10.1007/s11440-020-01028-1
[23] Hu, Z., Gao, Y., Su, W., Xia, Q., Zeng, J. (2015). Study on inverting calculation of ignition point depth in coal waste pile based on ignition source model. Coal Science and Technolo-gy, 43(1): 134-137,20. https://doi.org/10.13199/j.cnki.cst.2015.01.032.
[24] Thaker, A.S., Hussien, F.M., Faraj, J.J. (2023). Numerical simulation of an indirect solar dryer equipped with thermal conduction enhancer augmented phase change materials (PCMs) for banana drying. International Journal of Heat and Technology, 41(5): 1158-1166. https://doi.org/10.18280/ijht.410506
[25] Zhang, L.M., Wang, X.S., Cong, Y., Wang, Z.Q., Liu, J. (2023). Transfer mechanism and criteria for static–dynamic failure of granite under true triaxial unloading test. Geomechanics and Geophysics for Geo-Energy and Geo-Resources, 9: 104. https://doi.org/10.1007/s40948-023-00645-w
[26] Zhang, Y., Yang, H., Wang, B., Khan, H.S., Duan, X., Liu, Y. (2022). Morphology Structure Evolution and Combustion Reactivity of Bituminous Char at Around Ash Melting Temperature. Journal of Thermal Science, 31(6): 2189-2202. https://doi.org/10.1007/s11630-022-1686-6