Rana Abd El-Hamied Haj Khalil![]()
© 2024 The author. This article is published by IIETA and is licensed under the CC BY 4.0 license (http://creativecommons.org/licenses/by/4.0/).
OPEN ACCESS
Renewable energy (RE) got exponential attention universally recently through successful ecological, economic, and social outcomes from giga-scale photovoltaic (PV) and wind projects. Hybrid RE systems (HRESs) express a distinguished example of RE frameworks. Nonetheless, designing an HRES is relatively challenging because of multiple factors engaged. Thus, optimization and sensitivity analyses are crucial to offer the lowest levelized cost of energy (LCOE). HOMER® software has been broadly employed lately, providing several advantages, including active provision of ecologically friendly and profitable HRESs. While the literature covers broad explorations of HRES worldwide, investigations on HRESs in Jordan are relatively rare. This work utilizes HOMER® to design a profitable HRES in Karak. Conducted HOMER® simulations revealed that the most cost-effective HRES comprised PV modules, diesel generator, Li-Ion battery, and power converter, supplying an LCOE of 488 USD/MWh with carbon emissions of 610.73 kton/annum. Simultaneously, an HRES containing PV modules, wind turbine, diesel generator, Li-Ion battery, and power converter had a higher LCOE (0.489 USD/kWh). An HRES of wind turbines, diesel generators, Li-Ion batteries, and power converters contributed to a higher LCOE (0.586 USD/kWh). A system’s LCOE with only a diesel generator was 0.727 USD/kWh. It is recommended to upgrade RE adoption to provide clean and profitable electricity. Furthermore, it is suggested to utilize energy storage to maximize HRES’s cost-effectiveness.
renewable energy, optimization, hybrid system, LCOE, cost-effectiveness, GHG emissions
Various developing and developed nations worldwide agreed on the considerable effectiveness of RE projects and alternative RE resources because of their expected successful results observed and practical relevance and benefits obtained from running solar PV, wind, bio, hydro, ocean, tidal, and other RE projects, reflected in (I) mitigating severe concentrations of Greenhouse Gas (GHG) emissions in the atmosphere, (II) providing sustainable energy resources as the fossil fuels will deplete, (III) minimizing other ecological issues noted globally, such as lower air quality, air pollution from particulate matter, global warming and climate change, and severe weather events associated with extremely hot days or very cold winters occurred in the recent years, and (IV) offering more cost-effective clean electrical power generation instead of fluctuating crude oil prices [1-5].
RE systems, either of small scales, like residential, commercial, and agricultural, large-scale for industrial purposes, or utility-size RE frameworks, which do include community RE plants, practical to supply necessary electricity for urbanized zones, do express essential chance for stable energy provision, helping make societies more resilient, sustainable, and more independent from different problems involved in fossil fuels. RE projects do also support in eliminating different negative impacts and severe issues correlated with fossil fuels, contributing to cleaner local environment [6, 7].
Generally, the available RE plants and systems that are commonly installed and prevalent in the RE market do contain one RE resource, like solar PV systems and wind farms. Nonetheless, relying solely on one RE resource of clean electricity may not achieve enhanced levels of ultimate energy production and amount of annual electricity yields per annum. For this reason, scholars and RE practitioners did shift into other frameworks of RE systems, which do consider utilizing one RE resource with a storage or a HRES that produces electricity from more than one RE resource and can utilize an energy storage technology [8-10].
The following paragraphs do express detailed analysis and in-depth discussions of various optimization and sensitivity analytical works conducted relying on mathematical modeling and numerical simulations by multiple advanced software packages to identify the profitability, feasibility, and practicality of RE systems, giving s special focus on HRESs, which do comprise more than one RE resource to offer sufficient electrical energy needs for local citizens.
From the available literature, it can be realized that various scholars in the last decades have innovated new software tools that have flexible capabilities of identifying the optimum components that should exist in each HRES to offer the best economic feasibility (expressed in LCOE) and lower adverse environmental impacts in terms of carbon dioxide and other GHG emissions and enhanced air quality characterized by very low particulate matter in the air. For instance, BlueSol, PVsyst, Helioscope, Pylon, SolarEdge Site Designer, and PV-Sol software tools were developed to manage good estimation and efficient design of different small and large-size solar PV projects worldwide [11-16]. At the same time, WindSim, WindStation, Meteodyn WT, and Windie program packages were innovated to help design various on- and off-shore wind farms more appropriately and smoothly [17, 18].
A unique example of an advanced software tool that has been broadly utilized by researchers and RE experts to estimate the LCOE is the HOMER® software tool. The available literature comprises various articles discussing the beneficial impacts and crucial LCOE findings from HOMER® software adoption. However, there is a considerable lack of publications that address the employment of this valuable software for different Jordanian provinces [19-27].
Regarding international experience in this software tool, diverse scholars reported some contributory outcomes and vital economic profitability measures that help assess and compare the financial effectiveness and feasibility of HRESs. For instance, Abdin and Mérida [28] guided an analysis exploring the LCOE rates of multiple RE systems correlated to off-grid power systems using hydrogen energy as a storage bank. The authors analyzed nine different RE frameworks considering battery and hydrogen technologies. They took into account five locations worldwide, which were Brisbane, California, Colorado, Los Angeles, and Golden from the USA, besides Adelaide from South Australia, Squamish from Canada, and Australia. The scientists employed various RE configurations, focusing mainly on solar PV and wind to help generate clean electrical power. They also relied on hydrogen energy and batteries to provide a storage bank that can store excess electricity when it is not utilized. Based on the simulation processes and mathematical modeling of the nine investigated RE systems, it was found that the most cost-effective RE configurations could depend on specific geographic regions. Additionally, the results revealed that the minimal LCOE for a PV, wind turbine, battery bank, electrolyzer, and hydrogen storage tank integrated into Golden, Colorado, USA, was 0.50 USD/kWh. Furthermore, the bare minimum LCOE was determined when the battery bank was excluded, corresponding to 0.78 USD/kWh for the same site. The higher price level was primarily attributable to the cutting-edge hydrogen technologies that are integral parts of the system. Depending on these findings, it was discovered that hydrogen storage technology could offer longer-term energy storage technology solutions (ESTSs) for off-grid RE systems due to its significant cost-effectiveness compared with batteries. Also, it was found that using those RE models had offered helpful gains for the nature and ecological systems due to the exclusion of fossil fuels and GHG emissions generation that are directly responsible for global warming and climate change.
Bošnjaković et al. [29] conducted numerical simulations aiming to evaluate a series of profitability measures and economic metrics of HRESs to offer means of clean electrical power with very low electricity tariffs. The scholars clarified that the dramatic drop in PV prices helped avoid increasing rates of electricity prices and large environmental pressure and burden due to extensive reliance on fossil fuels. As a result, utility-scale PV projects have been broadly implemented on rooftops worldwide. The authors examined the financial viability of some PV systems under Croatian weather conditions to offer clean electrical power for families and homes in the rural continental part of the country. A house in Dragotin, Croatia, was selected as a case study. This dwelling had an annual electricity consumption of 4,211.70 kWh. Solar PV panels were installed with the best south-facing slop for this house. The HOMER® program was hired to determine the optimum size of the corresponding PV framework operating at 3.6 kW without the need of battery. The daily load curve was derived by monitoring the facility’s electricity consumption continuously throughout a typical June day. Daily load curves were created for a typical day in each month of the year because most of the activities involve power consumption and occur on a daily basis throughout most of the year. Hourly measures on the electricity generation of selected PV modules for a typical day in each month were obtained using the online platform Solargis Prospect, considering the insolation for the provided location. The amount of energy added to and drawn from the grid was determined using historical information. Based on the HOMER® software simulation work, the economic analysis confirmed that the PV system could offer a payback period for itself in 10.5 years without government subsidies when considering existing rates for selling and purchase of electricity, investment prices, and maintenance of equipment. Moreover, it was found that the overall investment for a 3.6 kW PV power plant amounted to 4,653 USD. From the network, 1,456.92 kWh of energy was consumed, while 2,754.14 kWh of energy was provided by the PV system. On the other hand, it was found that the PV system had the potential to export 1,804.32 kWh. The price of electricity with a Value-Added Tax (VAT) of 13% reached 0.150 USD/kWh, which is considered the highest electrical tariff. In comparison, the lower electricity tariff reached 0.083 USD/kWh. The average unit price of electrical power without excise duties was recorded at a rate of 0.069 USD/kWh. Furthermore, these green systems have a great potential for minimizing GHG emissions because fossil fuels are not employed.
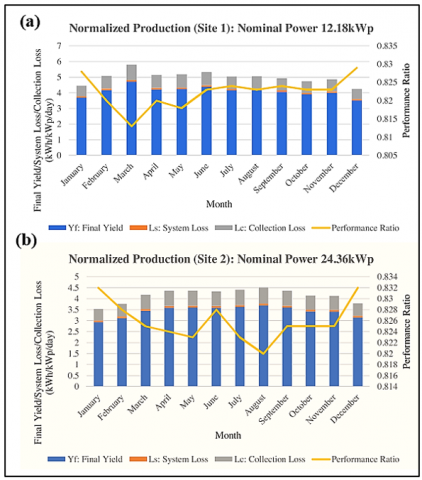
To evaluate the viability of using renewable energy sources at two urban farm sites in Malaysia, the authors of Teo and Go [30] developed a solar PV/hybrid/storage system seeking to estimate its performance when the building geometry modeling process was considered with the help of optimal energy yield estimation techniques. The scholars reported that vertical farms consumed between 430.116 kWh and 1,002.024 kWh of electricity every day. Their proposed solar PV/hybrid/storage system for these vertical farming facilities was the focus of their investigation. The researchers evaluated the energy yield, Performance Ratio (PR), economics, and environmental impact. In two locations, grid-connected solar PV systems met between 11.6 and 8.35% of the load usage. According to the HOMER® mathematical simulations, it was found that grid-connected solar PV systems offered lower values of LCOE and attained considerable performance ratios corresponding to 82.22% and 82.56% at Selangor and Sarawak, respectively. Nonetheless, a freestanding hybrid PV-battery-diesel system contributed to the most remarkable LCOE and the lowest performance ratios (with 69.60% and 70.91%, subsequently). The researchers utilized a collection of mathematical correlations for more amended analysis of HRES in their work, including the necessary row spacing between PV modules, $D_{ {Row,PV }}$, which can be expressed by:
$D_{ {Row }, P V}=h_{ {Tilt }, P V}[\cos \gamma / \tan \varphi]$ (1)
where, $h_{ {Tilt }, P V}$ indicates the height of the tilted PV modules, $\gamma$ is the azimuth angle, and $\varphi$ expresses the solar attitude corresponding to certain solar time. γ can be calculated from the algebraic relationship:
$\sin \gamma=\left(\frac{\cos \delta \sin \omega}{\cos \varphi}\right)$ (2)
where, ω is the hour angle and δ is the angle between the sun and equatorial plane. Besides, they considered another expression related to the calculation of grid-tied PV power, which can be illustrated in the following:
$P_{{On.Grid.PV }}=D F_{P V} P_{ {Rated }, P V}\left(I_G / I_{S, P V}\right)$ (3)
where, $P_{ {on.Grid.PV }}$ is the derating factor of PV panels, $P_{ {Rated, } P V}$ is the rated power of single $\mathrm{PV}$ module, $I_G$ is the global solar incident irradiation on the surface of PV arrays, and $I_{S, P V}$ displays the standard solar irradiation considered in rating the overall PV array capacity. Also, the crucial formula considered to compute the PV cell temperature, $T_{ {Cell.PV }}$, was examined as follows:
$T_{ {Cell.PV }}=T_{A m b} \times\left(1+\frac{N O C T_{P V}-T}{I_{S, P V}} \times H_{A v g}\right)$ (4)
where, $T_{A m b}$ is the ambient temperature, $N O C T_{P V}$ is the nominal operating cell temperature, and $H_{A v g}$ is the average solar irradiation. To evaluate the total capacity of the HRES’s battery, they utilized the following correlation:
$B C_{ {Tot }}=T_{ {Amb }} \times\left(1+\frac{E L_{ {Daily }} \times A u t_{ {Days }}}{N V_{ {Batt }} \times \eta_{ {Batt }} \times D O D_{ {Batt }}} \times H_{{Avg }}\right)$ (5)
where, $E L_{ {Daily }}$ is the electrical daily load, $A u t_{ {Days }}$ is the number of autonomy days, $N V_{\text {Batt }}$ is the battery’s nominal voltage, $\eta_{ {Batt }}$ is the battery efficiency, and $DOD_{\text {Batt }}$ is the battery’s depth of discharge. On the other hand, modeling of the LCOE was conducted in their work. The corresponding LCOE formula can be expressed by:
$L C O E=\left(\frac{N P C}{\left(\sum_{t=0}^{8,760} \frac{P_{ {Load }}}{1,000}\right)\left(S L_{ {Tot }}\right)}\right)$ (6)
where, NPC is the net present cost, $P_{{Load }}$ is the load throughout, and $S L_{T o t}$ is the overall system lifespan. Figure 1 displays the normalized RE production in the two investigated sites in their work.
Referring to local HRESs conducted in different Jordanian provinces, the literature does consist of multiple publications, involving certain discussions and investigations of RE and HRES relevance for considerable sustainability and monetary feasibility. For example, researchers [31-46] did conduct analytical research, investigating possible advantages, critical contributions, and various feasible impacts of HRESs in supplying sufficient scales of electrical energy with better LCOE values, taking into consideration optimization, sensitivity analysis, and alleviation of adverse fossil fuel impacts on environment.
Figure 1. Normalized RE production from the HRESs investigated in the work of Teo and Go (2021), including grid-tied PV system (a) site #1 and (b) site #2
For instance, Al-Masri et al. [47] explored all probable on-grid RE frameworks necessary for covering the electrical load linked to Al-Mastaba district, Jordan. Relying on the minimization procedure of the case study’s objective function related to the Grid Usage Factor (GUF), the latter index was minimized utilizing optimizations by the flow direction optimization algorithm (FDOA). Corresponding grid-tied HRESs included (a) PV only, (b) wind only, (c) hybrid PV/ wind, (d) PV/ pumped-hydro energy storage (PHES), (e) wind/ PHS, and (f) hybrid PV/ wind/ PHS.
For every scene, optimum sizing and RE management strategies were accomplished utilizing FDOA. The critical indices comprised the number of PV modules, the number of wind turbines, and/ or the upper reservoir (UR) height correlated to the PHES facility (h_hydro). Crucial measured input hourly databases linked to major systems’ parts have been provided from formal organizations to help offer realistic and future actual-life outcomes and future directions. The optimization findings affirmed that HRES of [(PV/ wind/ PHES), which expresses scenario #6] had the optimum effectiveness.
It had the least GUF that reached an amount of 0.59%. It comprised 12,692 solar modules, 28 wind turbines, and a UR of 106.98 m pertaining to h_hydro. Additionally, the uncertainty analysis on measured input databases was adopted to check the system’s robustness. It was noted that the 6th scene of the HRES produced a rate of 122.29 t/year of carbon dioxide emissions.
The corresponding RE storage coefficient was 63.72%, offering an LCOE of 0.042 USD/kWh, expressing the least LCOE level. The authors confirmed that their method proposed in their work is remarkably suggested for any place to help minimize grid purchases, offering alternative solutions of electrical energy to local electricity networks.
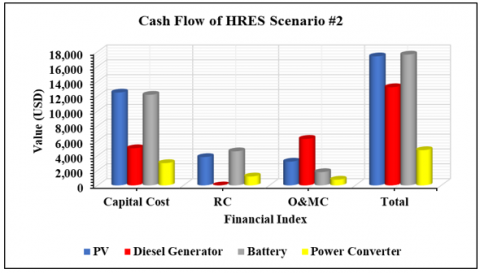
In the same manner, Bataineh and Al-Mofleh [48] conducted a profitability analysis and performance investigation concerning an HRES that could cover the overall electrical loading of the Um-Jamal, Mafraq, Jordan.
The authors utilized the HOMER® software to conduct necessary optimizations and sensitivity analysis. The HRES contained a diesel generator, power converter, primary electrical load of overall Amman populations, wind turbine, and PV modules, as illustrated in Figure 2.
Figure 2. The overall HRES analyzed in the work of Bataineh and Al-Mofleh [48]
Referring to HOMER® optimization procedures, it was found that the first three scenarios included HRESs of ([a] PV, batteries, and power converter, [b] PV, batteries, power converter, and diesel generator, and [c] PV, wind, batteries, power converter, and diesel generator), corresponding to LCOE rates of 0.186, 0.183, and 0.199 USD/kWh, respectively.
Figure 3 indicates critical monetary variables related to the second HRES scenario.
Figure 3. Critical monetary variables related to the second HRES situation in the work of Bataineh and Al-Mofleh [48]
Within this framework of background, it can be realized from preliminaries that continuous research and development (R&D) performed on HRESs have contributed to the innovation of more profitable, workable, and practical HRESs that consider utilizing multiple breakthrough ESTSs. Those state-of-the-art evolutions in the HRESs and ESTSs brought considerable amendments and enhancements to various HRESs utilized universally in terms of efficiency, robustness, reliability, cost feasibility, and ecological sustainability. Technically speaking, remarkably amended Li-ion batteries and other sorts of ESTSs helped expand the overall autonomy days and storage duration through which ESTSs could serve small- and large-scale facilities. Referring to local experience, RE companies in Jordan did follow global path of RE investment, evolution, and improvement, which can be noted in domestic, commercial, and community-scale PV projects and wind farm that utilized latest RE technologies and took into application the most advanced RE designs, products, and frameworks.
Additionally, as can be observed from frequent prosperous RE outcomes in Jordan linked to (a) economic profitability, (b) green environmental impacts, and (c) lower adverse air quality effects and deleterious emissions, many Jordanian scholars and investors involved recent publications, peer-reviewed papers, and RE investment in the field of RE in upgrading universal and local RE industry through novel HRES models, new RE concepts, and more feasible ESTSs to help make RE prevalent and robust internationally and in Jordan.
Correspondingly, this work contains some sections that address and discuss a group of RE themes correlated to HRES investigation in Karak. These sections are arranged in the following sequence:
Section 2 indicates the Materials and Methods that will describe the relevant ideas regarding the major research phases and analytical process utilized in this paper.
Section 3 addresses the critical numerical Outcomes obtained from the mathematical simulations and sensitivity analysis adopted in the research method to calculate the LCOE linked to the HRES.
Section 4 represents the Conclusions that summarize the main findings represented and explained in the previous section to categorize and elucidate the vital contributions of RE and HRES for economic effectiveness and ecological benefits.
Section 5 describes the Future Work of this research recommended to foster and elaborate on the primary outputs of this article.
2.1 The research method
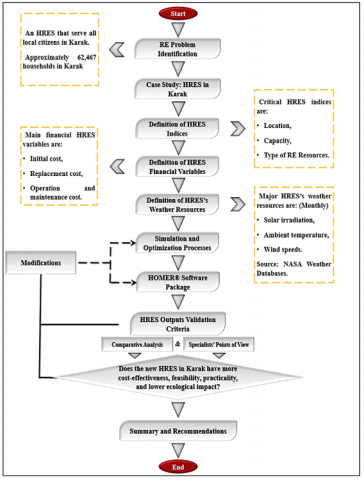
This research focuses on analyzing the performance and effectiveness of the overall HRES, including fiscal profitability through the evaluation of a series of economic variables pertaining to the numerical outcomes attained from the mathematical simulations, and optimization followed and applied in the HOMER® software tool. Firstly, the amount of the energy demand needed for local residential population in Karak was defined. This step was followed by identifying a set of critical RE indices, involving the location, capacity, and major RE resources utilized in the HRES, as shown in Figure 4.
To ensure an active simulation process using the HOMER® software, essential cost indices were selected, notably initial cost (IC), replacement cost (RC), and operation and maintenance cost (O&MC).
On the other hand, some crucial weather resources, namely (a) solar irradiation, (b) ambient temperature profile, and (c) monthly wind speeds of Karak were defined from the NASA weather resources built-in library in HOMER® program. After obtaining the results, validation was conducted relying on a comparative analysis with other results of scholars, who did a same work on HRES’s feasibility and effectiveness. Besides, RE specialist’ points of view were considered to verify these work outputs.
Figure 4. The study method considered in this work
After conducting necessary validation of the research outcomes, the discussion section was created to mention similar studies and optimization and simulation research carried out on the same HRES principles, helping confirm the work’s contributions, consistency, and rationale. Finally, corresponding summary and recommendations besides future work directions are proposed and drawn to aid scientists in improving the novelty and added value of this research for the global community.
The following paragraphs and sections explain some details relating to the software employed in this work. Moreover, the procedure followed to define and determine some necessary parameters is described.
2.2 The software package
HOMER® program tool, which stands for Hybrid Optimization of Multiple Electric Renewables, was created in North America by a group of scholars aiming to provide boosted estimates of LCOE related to an HRES combining more than single RE resource or multiple RE and nonrenewable energy resources to produce electricity with profitable tariffs. Nonetheless, the company responsible for this software kit offered less than 30 days as the first trial license for students and scholars. Consequently, the company requires fees for the next trials, helping conduct up-to-date amendments and continuous improvements to ensure its high performance and competitiveness among other software gadgets in evaluating the LCOE with elevated rates of accuracy and reliability [31].
The software is designed to assist in the development and design of economically viable energy frameworks that can supply adequate clean electrical power generation at the lowest rate of LCOE. It does so by incorporating a wide variety of RE resource categories, including solar PV, wind, hydroelectric, hydrogen, and solar thermal [32, 33].
This program relies on a combination of ESTSs, notably flywheels, fuel cells, and batteries, to help improve the efficiency, reliability, and consistency of RE systems by storing excess electrical power at peak generation time and consuming it when no wind or solar irradiation is present, such as night duration. However, engineers may employ a diesel generator in some cases and include it in the renewable energy scheme, which is not ecologically feasible with regard to sustainability metrics.
The working principles of the HOMER® software tool depend upon some criteria, which can be explained in Figure 5.
Figure 5. The major solution phases considered in the HOMER® energy optimization tool [36]
It can be inferred from the information represented in Figure 5 that the procedure of simulation, optimization, and sensitivity analysis follows three main phases, which are [34, 35]:
1) Simulation. This phase investigates the most convenient form and combination of RE systems that can achieve better economic and ecological results depending on the components selected and defined by the researcher. HOMER® simulation frequencies can rely on the complexity of the configuration defined by the scholar.
2) Optimization. In this phase, a further number of simulation procedures is adopted to support researchers in categorizing the optimum solution in respect of the lowest LCOE and lower harmful environmental effects via making a sorting process and filtering a series of combinations in line with the optimal cost-effectiveness.
3) Sensitivity Analysis. This stage is applied to determine the levels of ideality pertaining to the RE system that should respond flexibly to the factors and control criteria chosen by the scholar.
2.3 Definition of the research parameters
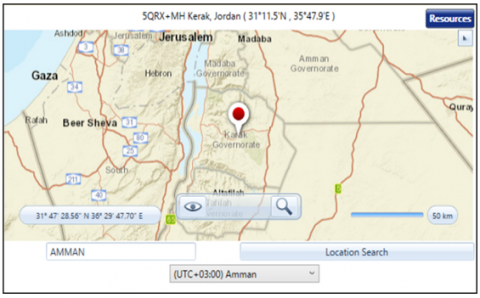
2.3.1 The RE project location
The location selected for this study is Karak. It is defined in the HOMER software depending on the investigated case to enable the following accurate identification of weather data resources, such as the daily global horizontal solar irradiation, monthly wind speeds, annual ambient temperature, and other daily, monthly, and yearly weather parameters differ from one place to another. Generally, these weather resources are downloaded from the same software package depending on the National Aeronautics and Space Administration (NASA) library. The NASA library integrated into this software can provide abundant information pertaining to various weather resources of any place worldwide. The definition of the research location investigated in the HOMER® software tool can be described in Figure 6.
Figure 6. The determination of the research location in the HOMER® software
2.3.2 The electrical load
In order to provide an optimum hybrid RE design with the lowest LCOE and minimal adverse environmental influences, it is crucial to define the actual electric load consumed by local citizens in Karak. To do this task, this research took into account that most Karaki residents live in a typical apartment with an overall surface area of 200 m2, having around six individuals in each apartment. Knowing that the overall Karaki population amounted to 374,800 in 2022, conforming to the Jordanian Department of Statistics (JDoS) [37], then, the number of families/ households equals (374,800/6) = 62,467. A typical apartment used by most Karaki citizens can be illustrated in Figure 7.
Figure 7. A typical 200 square meter apartment used by most Karaki citizens with three bedrooms [38]
This general Karaki apartment comprises a combination of electrical devices and appliances that consume specific amounts of electrical power, as described in Table 1.
The base load calculated in the table considers that the fridge does not consume the same electrical wattage around the clock nor the water cooler since when residents sleep, the electrical consumption of those two devices will be very low. For this reason, the wattage considered in the estimation process of the base load would be lower than the values represented in the table.
Table 1. The main devices used in the typical Karaki apartment
|
# |
Electrical Device |
Power (W) |
Appliance Frequency |
Total (W) |
|
1 |
AC Condition |
1,400 |
3 |
4,200 |
|
2 |
Air Cooler |
60 |
3 |
180 |
|
3 |
Ceiling Fan |
50 |
4 |
200 |
|
4 |
Fridge with Freezer |
400 |
1 |
400 |
|
5 |
Internet Router |
10 |
1 |
10 |
|
6 |
LED Lamps |
7 |
55 (1) |
385 |
|
7 |
Laptop |
50 |
2 |
100 |
|
8 |
Microwave |
600 |
1 |
600 |
|
9 |
Receiver |
25 |
1 |
25 |
|
10 |
Smart Phone Charger |
6 |
5 |
30 |
|
11 |
Television |
55 |
1 |
55 |
|
12 |
Vacuum Cleaner |
420 |
1 |
420 |
|
13 |
Washing Machine |
550 |
1 |
550 |
|
14 |
Water Cooler |
75 |
1 |
75 |
|
--- |
Base Load |
170 (2) |
--- |
--- |
|
Overall |
6,990 W |
|||
|
* (Assuming the apartment has 11 lighting fixtures, each needs 5 LED Lamps). |
||||
|
Base Load (BL) = Load that is permanently operating over 24 hours in the four seasons. BL = Fridge with Freezer + 5 Smart Phone Chargers + Water Cooler + Internet router = 300 W. |
||||
Relying on the electrical power consumption data of appliances shown in this table, the total electric load is evaluated by estimating the electrical power usage corresponding to each hour. Appendices A and B provide some details pertaining to the electrical power kind pursuant to the twelve months linked to the 62,467 households in Karak. When the load profile was defined and uploaded into the HOMER® software library, some options were selected pertaining to the peak time of load, either in winter (January) or summer (July). In this work, and for most cases, July represents the peak month due to the wide utilization of Air Conditioning (AC) Systems, including AC split units in homes that can consume large electrical tariffs. Also, the HOMER® optimization software requires to determine the type of zone to be served by the RE system (typically, the type of load profiles addressed in this software between a group of choices, including (I) residential (for a small home), (II) commercial (for larger RE projects dedicated to commercial buildings), (III) industrial (for large industrial facilities or factories), (IV) community (which is for utility-scale RE projects that provide clean electrical power for districts and large provinces), or (V) blank (when the researcher may not be sure about the scale of his RE project). Because all the residents of the Karak province are served with this HRES, the type of load profile was chosen as a community, as shown in Table 2.
Table 2. The definition of community load and the month at which peak load takes place
|
No. |
Category |
Value |
|
1 |
Type of Electrical Load |
Community |
|
2 |
Peak Month of the Eletrical Power Demand |
July |
Furthermore, after defining these electrical power data, some additional electrical power elements were defined and identified, like those shown in Table 3.
Table 3. Some electric load dimensions and elements considered in the software
|
No. |
Electrical Power Metric |
Value |
|
|
Baseline |
Scaled |
||
|
1 |
Average Demand |
3,805,941.6 kWh/day |
3,815,250.0 kWh/day |
|
2 |
Average Power |
158,580.9 Kw |
158,968.75 Kw |
|
3 |
Peak Demand |
563,610.8 Kw |
564,989.25 Kw |
|
4 |
Load Factor |
0.28 |
0.28 |
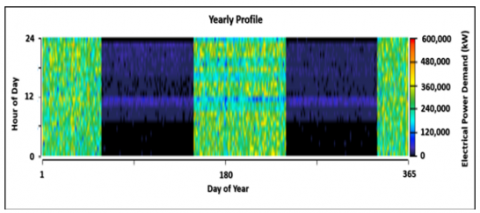
After defining all these parameters, a yearly load configuration was automatically developed by the HOMER® software, which can be described in Figure 8.
Figure 8. The yearly load profile related to the consumption behavior of the residents living in Karak, Jordan
It can be inferred from the data illustrated in Figure 8 that the days around 90 and 270 have a very low consumption rate (which can be indicated by the dark blue color) compared with winter days (December, January, and February) and summer days (which are around the day 180).
The latter has higher load consumption due to the employment of heating equipment (which are ACs in winter) and cooling technologies (which are ACs as well in summer).
2.3.3 Weather resources
To help enhance the outcomes of this study, it is crucial to define the precise place (which is Karak) to enable the NASA climate website to download weather data that can give accurate measures regarding the hybrid RE electrical power production.
The critical weather data considered in this work comprise, for instance, the solar irradiation crucial for the selection and definition of the PV system.
The solar irradiation data were defined after the location of the Karak province was determined, as illustrated in Figure 9.
Figure 9. Solar irradiation data downloaded from the NASA climate website for Karak
At the same time, another vital climate database, notably the average monthly ambient temperature, was considered in this paper. Mean air temperature information was also downloaded for Karak, as indicated in Figure 10.
Figure 10. The definition of average air temperature data for Karak
Meanwhile, the databases regarding wind speeds were downloaded from the NASA climate website, which is integrated into the HOMER® software.
These types of data are necessary to guarantee active analysis and appropriate optimization of the LCOE when the wind turbine is considered in the RE framework.
The definition of wind velocity for each month related to the Karak province is illustrated in Figure 11.
Figure 11. The definition of monthly wind speed profile for Karak
2.3.4 System’s components
The major HRES is defined and developed based on the combination of some RE systems besides some energy storage technologies that can provide active solutions in case RE, like solar PV or wind energy, is not adequate to match the needed electrical power related to local Karaki citizens.
The primary system’s configuration can be shown in Figure 12.
Each table in the following paragraphs describes a detailed definition and categorization of each component selected in this HRES shown in the previous figure.
Figure 12. The principal hybrid RE layout
For example, Table 4 illustrates the definition process of solar PV panels. The financial data shown in Table 4 explain that the IC, RC, and O&MC of the PV system are very large.
The reason is due to the large capacity and more significant electrical load needed to offer from the PV system, which is similar to the following tables. Massive price also expresses corresponding components of PV modules, electric lines, power converters, and other necessary parts and mechanical structures necessary to prepare and provide in order to complete the overall solar PV system establishment and operation.
The prices and financial information recorded in this table and other tables are based on global RE prices that are defined either by HOMER® or the Jordanian RE market.
Table 4. The selection and determination of the solar PV system’s financial and technical parameters
|
No. |
Category |
Value |
|
1 |
Overall PV Capacity |
564,989 kW |
|
2 |
IC |
700,000,000 USD |
|
3 |
RC |
200,000,000 USD |
|
4 |
O&MC |
5,000,000 USD/annum |
|
Other Technical Data |
||
|
5 |
Total Lifetime |
25 Years |
|
6 |
Derating Factor |
88% |
|
7 |
Rated PV Module Wattage |
345 kW |
|
8 |
Temperature Coefficient |
- 0.390 %/℃ |
|
9 |
Operating Temperature |
44.0℃ |
|
10 |
Rated Panel Efficiency |
17.8% |
|
11 |
Manufacturer |
Trina Solar |
|
12 |
PV Module Type |
Mono Crystalline |
|
13 |
Number of Cells per Panel |
72 |
Table 5. The selection and determination of the solar power converter considering financial and technical parameters
|
No. |
Category |
Value |
|
1 |
Overall Converter Capacity |
564,990 kW |
|
2 |
IC |
100,000,000 USD |
|
3 |
RC |
90,000,000 USD |
|
4 |
O&MC |
850,000 USD/annum |
|
Other Technical Data |
||
|
5 |
Total Lifetime |
15 Years |
|
6 |
Manufacturing Company |
Generic |
|
7 |
Rectifier Efficiency |
95.0% |
|
8 |
Inverter Efficiency |
95.0% |
|
9 |
Relative Capacity |
100.0% |
In addition, Table 5 indicates the selection and determination of the solar power converter considering financial and technical parameters.
Similar to the discussion explained above, it can be noted that the IC, RC, and O&MC related to the solar power converter are very high as well due to the larger capacity of the overall HRES.
However, it is worth mentioning that the selection of the power converter was left to be automatically chosen by the HOMER® software itself since the design process and definition of the number of power converters and some other electrical and technical dimensions are not available in this software.
Besides, Table 6 illustrates the selection and identification of the wind turbine’s financial and technical parameters.
Table 6. The selection and identification of the wind turbine’s financial and technical parameters
|
# |
Category |
Value |
|
1 |
Wind Turbine Capacity |
8,000 kW |
|
2 |
IC |
1,760,800,000 USD |
|
3 |
RC |
1,600,000,000 USD |
|
4 |
O&MC |
70,000,000 USD/annum |
|
5 |
Number of Wind Turbines |
71 |
|
6 |
Overall System Capacity |
564,989 kW |
|
Other Technical Data |
||
|
7 |
Total Lifetime |
20 Years |
|
8 |
Manufacturing Company |
VESTAS 164/ 8.0 MW |
|
9 |
Rotor Diameter |
164 m |
|
10 |
Hub Height |
30 m |
Based on the economic data represented in Table 6, the price of this wind turbine was defined relative to the global wind turbine prices of 2023 after reviewing multiple wind turbine websites and wind turbine manufacturing companies worldwide. Table 7 depicts the selection and identification of the battery’s financial and technical parameters.
Table 7. The selection and identification of the battery’s financial and technical parameters
|
No. |
Category |
Value |
|
1 |
Battery Total Capacity |
1.0 MWh |
|
2 |
IC |
2,670,500,000 USD |
|
3 |
RC |
2,670,500,000 USD |
|
4 |
O&MC |
26,705,000 USD/annum |
|
5 |
Number of Needed Batteries |
3,816 |
|
6 |
Overall System Capacity |
564,989 kW |
|
Other Technical Data |
||
|
7 |
Manufacturing Company |
Generic |
|
8 |
Type of Battery |
Li-Ion |
|
9 |
Nominal Voltage |
600 V |
|
10 |
Nominal Amperage Capacity |
1,670 Ah |
|
11 |
Maximum Charge Current |
1,670 A |
|
12 |
Maximum Discharge Current |
5,000 A |
|
13 |
Initial State of Charge |
100.0% |
|
14 |
Minimum State of Charge |
20.0% |
|
15 |
Roundtrip Efficiency |
90% |
As indicated in Table 7, 1.0 MWh battery was selected as the capacity of the whole system is very large. However, it is expected due to the expensive components of these batteries that the LCOE will be very high in case they are engaged in the RE configuration.
Table 8. The selection and identification of the generator’s financial and technical parameters
|
No. |
Category |
Value |
|
1 |
Type of the Generator |
Autosize Generic |
|
2 |
IC |
500 USD/kW |
|
3 |
RC |
500 USD/kW |
|
4 |
O&MC |
0.030 USD/opt.hr |
|
5 |
Type of Fuel |
Diesel |
|
6 |
Price of the Fuel |
1.00 USD/L |
|
Other Technical Data |
||
|
7 |
Electrical Bus |
AC |
|
8 |
Lifetime |
15,000 Hours |
|
9 |
Minimum Load Ratio |
25.0% |
|
10 |
Fuel Curve Intercept |
9,241 L/hr |
|
11 |
Fuel Curve Slope |
0.236 L/hr/kW |
|
12 |
Carbon Monoxide |
16.5 g/L |
|
13 |
Unburned Hydrocarbons |
0.72 g/L Fuel |
|
14 |
Particulate Matter |
0.10 g/L Fuel |
|
15 |
Fuel Sulfur to PM |
2.2% |
|
16 |
Density |
820 kg/m3 |
|
17 |
Lower Heating Values |
43.5 MJ/kg |
|
18 |
Carbon Content |
88.0% |
On the contrary, involving such energy solution approaches into the HRES could provide many beneficial characteristics in terms of longer periods of storage, more sustainability, and overcoming of solar irradiation and wind speed fluctuations around the year.
Table 8 describes the selection and identification of the generator’s financial and technical parameters.
It is inferred from Table 8 that the diesel generator is left for the HOMER® software to be selected automatically, depending on the amount of electrical power generated from RE resources.
In case very low electrical power is provided from RE resources, then the amount of LCOE would be high due to the significant reliance on the diesel generator to meet the community electrical demand in Karak.
In this section, the main findings obtained from the numerical analysis conducted with the help of the HOMER® software are represented in detail.
The following paragraphs indicate the overall cases and scenarios found from the HRES considered and analyzed in this paper.
3.1 The overall scenarios of the investigated HRES
After defining the entire technical parameters and important financial variables for each component in the HRES, the HOMER® software found ten feasible cases/ scenarios. These outputs were attained based on a group of fiscal criteria and economic indices that best describe the cost-effectiveness, economic feasibility, and profitability of the ten hybrid RE configurations. Before introducing Table 9, the symbols (abbreviations) in this table should be clarified, as follows:
1) Net Present Cost (NPC),
2) Operating Cost (OC),
3) Capital Expenditure (CAEX).
These essential indices are mostly utilized and considered in different papers and works involving optimization of HRESs.
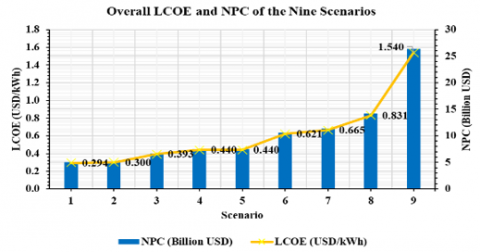
It can be inferred from the numerical findings represented in Table 9 that the most cost-effective HRES is the one that has the lowest value of LCOE, which is the first scenario that takes into account PV modules, wind turbine, diesel generator, Li-Ion battery, and power converter. The LCOE of this scenario amounts to 0.294 USD/kWh. Nonetheless, this scene may not be environmentally friendly because it relies on a diesel generator as a backup. As a result, carbon emissions are generated. On the other hand, the second case comprises all the components considered in this work, except PV modules. But excluding the PV system from this configuration does not provide more cost-effectiveness, which can be interpreted with larger LCOE due to the more considerable initial capital cost of the whole system. The exclusion of the PV system led to an LCOE of a 0.300 USD/kWh. Regarding the third case, only the wind turbine is excluded from the whole HRES. Consequently, when the wind turbine was not considered, the LCOE was higher. In turn, it contributed to a value of 0.393 USD/kWh. In case number 4, two components were excluded, which were PV system and Li-ion battery. Thus, it is predicted that excluding those critical components would lead to larger LCOE, which recorded an amount of 0.440 USD/kWh. Similarly, it is worth noting that excluding the Li-ion battery from the HRES would result in the same LCOE rate realized in the fourth case. However, in the last two cases, it can be observed that using no diesel generator would contribute to expensive LCOE. This aspect may be interpreted due to the shortage of energy storage capacity, by which clean electrical power might be lost without any utilization or storage for later use. At the same time, this research should remark that the higher values shown in Table 8 do not necessarily reflect poor economic feasibility due to the higher LCOE quantities. The reason goes back to the fact that this HRES is installed to serve clean electricity for 62,467 households in Karak (which corresponds to community/ utility load) but not for a single customer or a small home. For this reason, the LCOE of these community RE configurations would be considerable. Another clarifying graphical illustration of LCOE linked to the nine scenarios, expressed in Table 9 is displayed in Figure 13.
Figure 13. A summary of major LCOE rates and NPCs related to the nine investigated scenarios of this work
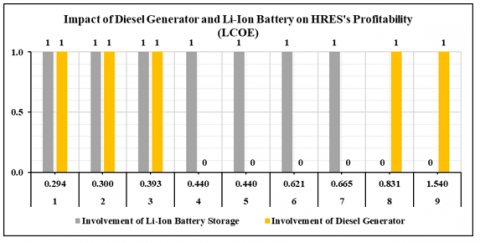
A clarifying column graph, distinguishing the influence of LCOE rate (cost feasibility) when diesel generator and/ or Li-ion battery do exist, can be expressed in Figure 14.
Table 9. The critical numerical outcomes of fiscal statistics and economic results for the ten hybrid RE scenarios/ cases
|
# |
Scenario/ Case Architecture |
Financial Details and Economic Measures |
System |
|||||||
|
NPC (Billion USD) |
LCOE (USD/kWh) |
OC (Million USD/yr) |
CAEX (Billion USD) |
RE Fraction (%) |
||||||
|
1 |
$\checkmark$ |
$\checkmark$ |
$\checkmark$ |
$\checkmark$ |
$\checkmark$ |
5.03 |
0.294 |
282 |
1.38 |
59.2 |
|
2 |
|
$\checkmark$ |
$\checkmark$ |
$\checkmark$ |
$\checkmark$ |
5.13 |
0.300 |
295 |
1.32 |
57.7 |
|
3 |
$\checkmark$ |
|
$\checkmark$ |
$\checkmark$ |
$\checkmark$ |
6.71 |
0.393 |
378 |
1.81 |
34.6 |
|
4 |
|
$\checkmark$ |
$\checkmark$ |
|
$\checkmark$ |
7.52 |
0.440 |
497 |
1.09 |
30.1 |
|
5 |
$\checkmark$ |
$\checkmark$ |
$\checkmark$ |
|
$\checkmark$ |
7.52 |
0.440 |
495 |
1.12 |
30.8 |
|
6 |
$\checkmark$ |
|
$\checkmark$ |
|
$\checkmark$ |
10.6 |
0.621 |
714 |
1.39 |
0 |
|
7 |
|
|
$\checkmark$ |
|
|
11.4 |
0.665 |
855 |
0.305 |
0 |
|
8 |
$\checkmark$ |
$\checkmark$ |
|
$\checkmark$ |
$\checkmark$ |
14.2 |
0.831 |
345 |
9.73 |
100 |
|
9 |
$\checkmark$ |
|
|
$\checkmark$ |
$\checkmark$ |
26.4 |
1.54 |
495 |
20.0 |
100 |
Figure 14. Effect on involving diesel generator and/ or Li-ion battery energy storage on LCOE of this study [0 = not exist, 1 = exists]
It can be inferred from the data explained in Figure 14 that the existence of diesel generator does adversely impact the rate of LCOE, contributing to more increase (like in scenario No. 8 and 9), besides its negative impact on environment. On the contrary, if Li-ion battery is utilized, it could make the HRES more feasible by lowering the LCOE scale (like in scenario No. 4, 5, 6, and 7). However, it should be noted that Scenarios 1, 2, and 3 were more cost-effective than 4, 5, 6, and 7. The reason of this outcome is correlated to the existence of alternative feasible RE resources like PV alone, wind alone, or PV and wind. Resultantly, LOCE rate would be become lower, contributing to more profitability.
The outcomes of this work are consistent with the findings of some researchers, who also utilized the HOMER® software in their work, like [39], stated that the LCOE of a community/ utility-scale load devoted to clean electrical power generation to a population of roughly 100,000 in Bangladesh amounted to 375 USD/MWh (or 0.375 USD/kWh). While scholars in [40] who developed a HRES for a community in Namibia found that the LCOE of this utility-scale HRES was (443 USD/MWh or 0.443/kWh) and (380 USD/MWh or 0.380 USD/kWh), corresponding to small and community loads of 1.7 kWh/day and 5.5 MWh/day, respectively. A third study in [41] revealed that after the HOMER® program to design a HRES for a rural community, it was found that the LCOE range of diesel (only) recorded LCOE rates between 920 USD/MWh (0.920/kWh) and 1,300 USD/MWh (or 1.30 USD/kWh), which is very expensive. Also, those authors mentioned that the solar PV system accomplished an LCOE of (400 USD/MWh (0.40 USD/kWh) to 610 MWh/USD (0.61 USD/kWh). Meantime, hybrid solar PV/diesel attained an LCOE of (540 USD/MWh [0.54 USD/kWh] to 770 USD/MWh [0.77 USD/kWh]), indicating that diesel is the most expensive technology.
In all cases, and from the review of literature, either authors [39-41], or other researchers, who carried out an LCOE analysis using the same software (HOMER®), confirmed that excluding diesel generators from the HRES is considerably preferable in terms of active prevention of GHG emissions and minimization of LCOE, helping fufill optimum profitability and enhanced cost-effectiveness.
Table 10. A comparison between hybrid RE projects and general RE systems in terms of different aspects
|
No. |
Criteria |
Major Key Strengths/ Weaknesses |
|
|
Type of RE System |
|||
|
HRES |
Normal |
||
|
1 |
Cost-Effectiveness |
More profitable due to the presence of multiple RE resources |
Lower feasibility due to a single RE power source |
|
2 |
Amount of Annual Yield Clean Electricity |
The amount of total electrical power generated per annum is large because more than one RE resource provides sustainable power |
It is limited as solar irradiation or wind speed are not permanently available |
|
3 |
Environmental Impact |
Lower ecological effect due to the use of clean ESTSs like batteries, capacitors, or flywheels |
It may be high because diesel generators may be used to substitute the shortage of power |
|
4 |
Reliability and Resilience |
High and satisfying due to the existence of ESTSs that can provide backup electricity in case of RE resource scarcity |
Clean electrical power is not always available |
|
5 |
Energy Security Levels |
A higher degree of energy security because storage is used as a backup |
Low due to intermittent solar irradiation and fluctuations in the wind speed |
|
6 |
Dependence on the Local Electrical Grid |
No utilization of local network because storage technique is adopted |
Power is consumed from the local electrical grid at night or low wind speeds |
|
7 |
Power Management |
More flexibility and control in the management of electrical generation and storage |
Limited because no storage exists of excess power to be used at peak demand or night |
|
8 |
Overall Efficiency |
High |
Low |
Table 11. A comparison between the LCOE obtained from this work with other scientists
|
# |
Reference |
Year |
Country |
Type of RE System |
RE Plant Capacity |
LCOE (USD/kWh) |
|
1 |
Al-Ghussain et al. [42] |
2018 |
Al-Tafilah, Jordan |
Hybrid (PV, Wind) (Without ESS) |
20.75 MW PV, 26 MW Wind, and 16.8 MWh Li-Ion Batteries |
0.213 |
|
Hybrid (PV, Wind, and Li-Ion Battery) (With ESS) |
20.75 MW PV, 26 MW Wind, and 16.8 MWh Li-Ion Batteries |
0.203 |
||||
|
2 |
Afif et al. [43] |
2023 |
Karak, Jordan |
Hybrid (PV, Wind, Biomass Generator, Lead-Acid Battery, and Flywheel) |
327 kW PV, 20 kW Wind, 7.15 kWh Lead-Acid Battery, and 100 kW Flywheel |
0.024 |
|
3 |
Ahmad et al. [44] |
2018 |
Pakistan |
Hybrid (PV, Wind, Biogas Generator, and Converter) |
15.0 MW PV, 15.0 MW Wind, 20.0 MW Biogas Generator, 15.0 MW Converter |
0.05744 |
|
4 |
Bataineh et al. [45] |
2014 |
Mafraq, Jordan |
PV System |
21 kW PV System |
0.240 |
|
PV, Diesel Generator |
20 kW PV, 10 kW Diesel Generator |
0.240 |
||||
|
PV, Wind, Diesel Generator |
15 kW PV, 3 kW Wind, 10 kW Diesel Generator |
0.277 |
||||
|
PV, Wind Turbine |
21 kW PV, 3 kW Wind Turbine |
0.288 |
||||
|
Wind Turbine, Diesel Generator |
12 kW Wind Turbine, 10 kW Diesel Generator |
0.592 |
||||
|
Diesel Generator, Lead-Acid Battery |
10 kW Diesel Generator and 54 kWh Lead Acid Battery |
0.837 |
||||
|
5 |
Thirunavukkarasu and Sawle [46] |
2020 |
Nadu, India |
PV, Diesel Generator, Lead-Acid Battery |
3.45 kW PV, 2.30 kW Diesel Generator, 10 kWh Lead-Acid Battery |
0.319 |
|
PV, Lead-Acid Battery |
3.45 kW PV, 24 kWh Lead-Acid Battery |
0.433 |
||||
|
Diesel Generator, Lead-Acid Battery |
2.30 kW Diesel Generator, 4 kWh Lead-Acid Battery |
0.528 |
||||
|
PV, Diesel Generator |
7.87 kW PV, 2.30 kW Diesel Generator |
0.533 |
||||
|
Diesel Generator |
2.30 kW Diesel Generator |
0.572 |
||||
|
6 |
Al-Masri et al. [47] |
2023 |
Al-Mastaba, Jordan |
PV, Wind Turbines, Hydro |
12,692 Solar PV Panels, 28 Wind Turbines, and 106.98 m as $h_{\text {hydro }}$ linked to PHES of the UR. |
0.042 |
|
7 |
Bataineh and Al-Mofleh [48] |
2014 |
Um-Jamal, Mafraq, Jordan |
PV |
21 kW PV |
0.240 |
|
PV and Diesel Generator |
20 kW PV and 10 kW Diesel Generator |
0.240 |
||||
|
PV, Wind Turbine, and Diesel Generator |
15 kW PV, 3 kW Wind Turbine, and 10 kW Diesel Generator |
0.277 |
||||
|
PV and Wind Turbine |
21 kW PV and 3 kW Wind Turbine |
0.288 |
||||
|
Wind Turbine and Diesel Generator |
12 kW Wind Turbine and 10 kW Diesel Generator |
0.592 |
||||
|
Diesel Generator |
10 kW Diesel Generator |
0.837 |
||||
|
8 |
This Work |
2023 |
Karak, Jordan |
PV, Wind, Li-Ion Battery, Diesel Generator |
87.9 MW PV, 2.6 GW Wind, 469 MWh Li-Ion Battery, 610 MW Diesel Generator |
0.294 |
|
Wind, Li-Ion Battery, Diesel Generator |
Wind, 568 MWh Li-Ion Battery, 610 MW Diesel Generator |
0.300 |
||||
|
PV, Li-Ion Battery, Diesel Generator |
525 MW PV, 509 MWh Li-Ion Battery, 610 MW Diesel Generator |
0.393 |
||||
|
Wind, Diesel Generator |
Wind, 610 MW Diesel Generator |
0.440 |
||||
|
PV, Wind, Diesel Generator |
13.2 MW PV, Wind, 610 MW Diesel Generator |
0.440 |
||||
|
Wind, Diesel Generator |
Wind, 610 MW Diesel Generator |
0.621 |
||||
|
Diesel Generator |
610 MW Diesel Generator |
0.665 |
||||
|
PV, Wind, Li-Ion Battery |
1.34 GW PV, Wind, 9,060 MWh Li-Ion Battery |
0.831 |
||||
|
PV, Li-Ion Battery |
5.27 GW PV, 13,578 MWh Li-Ion Battery |
1.540 |
||||
|
9 |
Jordanian Electrical Grid Price |
2023 |
Jordan |
Residential |
--- |
0.070 to 0.280 |
|
Commercial |
0.170 to 0.210 |
|||||
|
Industrial |
0.085 to 0.096 |
|||||
|
Hotel |
0.120 |
3.2 Comparative analysis of HRES
To clarify the advantageous impacts of HRESs, it is worth conducting a clear comparison that best describes the critical benefits of HRESs compared with normal RE projects. Consequently, Table 10 is developed to explain the major technical gains and beneficial values of installing HRESs compared with regular RE framework.
3.3 Comparative analysis of the LCOE
On top of previous findings fulfilled from the HOMER optimization, it is important to compare the contributory outcomes of this work by validating the values of the LCOE attained in this numerical analysis with the LCOE from other scholars. In this context, another comparative analysis was conducted to express different LCOE amounts realized by various researchers. Table 11 represents this comparative investigation linked to the LCOE.
It can be noted from the comparative analysis conducted in Table 11 that the LCOE of this work was relatively acceptable and satisfying due to the existence of similar amounts that are closer to LCOE values of this work, like what other researchers found.
In addition, it is worth mentioning that some of the LCOE outcomes of this work (like scenarios one and two, (corresponding to LCOE of 0.294 and 0.300, respectively), were feasible when compared with the current electrical tariffs in Jordan, which is illustrated in row No. 6, including residential and commercial electrical tariffs.
It is also important to explain that utilizing ESTSs in any HRES can increase its resilience, durability, reliability, and efficiency. As a result, its profitability and cost-effectiveness can be also realized. Fortunately, with continuous R&D, the potential, performance, practicality, and economic because of longer storage duration and larger number of autonomy days of these modern and state-of-the-art ESTSs. Certainly, Li-ion batteries utilized in smart phones express an amended form of ESTSs since of its extended resilience and durability. The latest styles and models of Li-ion batteries possess considerably enhanced storage capacity, DOD, lower charging duration, and extended lifespan, helping increase the resilience of overall HRESs.
This paper was guided to investigate the critical relevances and beneficial impacts of HRESs and RE projects in accomplishing better sustainability and economic effectiveness in terms of cost of electricity, positive environmental influences, and electrical power sufficiency. An HRES system was developed using the HOMER® software. Optimizations, sensitivity analysis, and simulations were performed to calculate the carbon emissions and better LCOE under the consideration and definition of some parameters and research variables. According to the analytical process conducted in the HOMER® software, it was found that the most cost-effective HRES was a system comprising PV modules, wind turbine, diesel generator, Li-Ion battery, and power converter. The LCOE of this scenario amounted to 0.294 USD/kWh. Nonetheless, this scene may not be environmentally friendly because it relies on a diesel generator, producing carbon emissions. The second case comprised all the components except PV modules. But excluding the PV system would cause larger LCOE due to the more considerable initial capital cost of the whole system. The exclusion of the PV system led to an LCOE of a 0.300 USD/kWh. When only the wind turbine is excluded from the whole HRES the corresponding LCOE would be higher. It contributed to 0.393 USD/kWh. When PV system and Li-ion battery are not employed, larger LCOE would be noted, which was 0.440 USD/kWh. Similar to this fourth case, it is worth noting that excluding the Li-ion battery from the HRES would result in the same LCOE rate. Nonetheless, in the last two cases, it can be observed that using no diesel generator would contribute to expensive LCOE. This aspect may be interpreted due to the shortage of energy storage capacity, by which clean electrical power might be lost without any utilization or storage for later use.
At the same time, higher LCOE values do not necessarily reflect poor economic feasibility. The reason goes back to the utility-scale HRES devoted to serve 62,467 households in Karak. Therefore, the LCOE of this community load would be more considerable. Finally, it is suggested to utilize energy storage solutions that guarantee continuous provision of electrical power around the hour.
Building on the numerical findings and statistical outcomes obtained from this work, this work proposes a set of critical possible fields of enhancements that could be followed to amend the robustness of the article’s outcomes. These essential future work directions include the following:
1) To conduct the same numerical analysis, taking into account additional RE components, like thermal energy, bioenergy, hydropower, or other RE resources;
2) To consider the implementation of other feasible ESTSs, like flywheels;
3) To utilize another optimization and simulation software or optimization algorithms and compare the accuracy and LCOE rates attained from those approaches;
4) To utilize correcting factors and specific electrical energy indices in the network to consider the power loss and variating load in certain days with peak demand.
Appendix A
Electrical Load Definition of the Karaki Households
Table 1. The kind and trend of electricity load and electric demand in four seasons for 62,467 households in Karak
|
Time |
Season |
||||
|
(am/pm) |
(24 Hours) |
Winter |
Spring |
Summer |
Autumn |
|
12:00 am |
0:00 |
Base Load, 3 ACs |
Base Load |
Base Load, 3 ACs, 3 Air Coolers, 2 Ceiling Fans |
Base Load |
|
1:00 am |
1:00 |
Base Load, 3 ACs |
Base Load |
Base Load, 3 ACs, 3 Air Coolers, 2 Ceiling Fans |
Base Load |
|
2:00 am |
2:00 |
Base Load, 3 ACs |
Base Load |
Base Load, 3 ACs, 3 Air Coolers, 2 Ceiling Fans |
Base Load |
|
3:00 am |
3:00 |
Base Load, 3 ACs |
Base Load |
Base Load, 3 ACs, 3 Air Coolers, 2 Ceiling Fans |
Base Load |
|
4:00 am |
4:00 |
Base Load, 3 ACs |
Base Load |
Base Load, 3 ACs, 3 Air Coolers, 2 Ceiling Fans |
Base Load |
|
5:00 am |
5:00 |
Base Load, 3 ACs |
Base Load |
Base Load, 3 ACs, 3 Air Coolers, 2 Ceiling Fans |
Base Load |
|
6:00 am |
6:00 |
Base Load, 3 ACs |
Base Load |
Base Load, 3 ACs, 3 Air Coolers, 2 Ceiling Fans |
Base Load |
|
7:00 am |
7:00 |
Base Load, 3 ACs, 30 Lamps |
Base Load, 25 Lamps |
Base Load, 3 ACs, 3 Air Coolers, 2 Ceiling Fans |
Base Load, 25 Lamps |
|
8:00 am |
8:00 |
Base Load, 3 ACs, TV, Receiver, 20 Lamps |
Base Load, TV, Receiver, 15 Lamps |
Base Load, 3 ACs, 3 Air Coolers, 3 Ceiling Fans, TV, Receiver, 10 Lamps, |
Base Load, TV, Receiver, 25 Lamps |
|
9:00 am |
9:00 |
Base Load, 3 ACs, TV, Receiver, 20 Lamps |
Base Load, TV, Receiver, 20 Lamps |
Base Load, 2 ACs, 3 Air Coolers, 4 Ceiling Fans, TV, Receiver, 15 Lamps, |
Base Load, TV, Receiver, 15 Lamps |
|
10:00 am |
10:00 |
Base Load, 3 ACs, 20 Lamps, Vacuum cleaner |
Base Load, 15 Lamps, Vacuum cleaner |
Base Load, 2 ACs, 3 Air Coolers, 4 Ceiling Fans, 15 Lamps, Vacuum cleaner, |
Base Load, 20 Lamps, Vacuum cleaner |
|
11:00 am |
11:00 |
Base Load, 3 ACs, 20 Lamps, Washing Machine |
Base Load, 20 Lamps, Washing Machine |
Base Load, 1 AC, 15 Lamps, 2 Air Coolers, 3 Ceiling Fans, Washing Machine |
Base Load, 20 Lamps, Washing Machine |
|
12:00 pm |
12:00 |
Base Load, 3 ACs, 20 Lamps |
Base Load, 15 Lamps |
Base Load, 20 Lamps, 3 ACs, 3 Air Coolers, 3 Ceiling Fans |
Base Load, 20 Lamps |
|
1:00 pm |
13:00 |
Base Load, 3 ACs, 20 Lamps |
Base Load, 20 Lamps |
Base Load, 20 Lamps, 3 ACs, 2 Air Coolers, 3 Ceiling Fans |
Base Load, 25 Lamps |
|
2:00 pm |
14:00 |
Base Load, 3 ACs, 20 Lamps |
Base Load, 15 Lamps |
Base Load, 25 Lamps, 3 ACs, 3 Air Coolers, 4 Ceiling Fans |
Base Load, 30 Lamps |
|
3:00 pm |
15:00 |
Base Load, 3 ACs, 15 Lamps |
Base Load, 20 Lamps |
Base Load, 30 Lamps, 2 ACs, 3 Air Coolers, 4 Ceiling Fans |
Base Load, 25 Lamps |
|
4:00 pm |
16:00 |
Base Load, 3 ACs, 25 Lamps, TV, Receiver |
Base Load, 30 Lamps, TV, Receiver |
Base Load, 20 Lamps, 2 Air Coolers, 3 Ceiling Fans, TV, Receiver, 2 ACs |
Base Load, 30 Lamps, TV, Receiver |
|
5:00 pm |
17:00 |
Base Load, 3 AC, 35 Lamps, TV, Receiver, Microwave |
Base Load, 25 Lamps, TV, Receiver, Microwave |
Base Load, 3 ACs, 3 Air Coolers, 4 Ceiling Fans, 30 Lamps, TV, Receiver, Microwave |
Base Load, 25 Lamps, TV, Receiver, Microwave |
|
6:00 pm |
18:00 |
Base Load, 3 ACs, 30 Lamps, TV, Receiver |
Base Load, 30 Lamps, TV, Receiver |
Base Load, 2 ACs, 3 Air Coolers, 3 Ceiling Fans, 40 Lamps, TV, Receiver |
Base Load, 20 Lamps, TV, Receiver |
|
7:00 pm |
19:00 |
Base Load, 3 ACs, 30 Lamps, TV, Receiver, Laptop |
Base Load, 30 Lamps, TV, Receiver, Laptop |
Base Load, 2 ACs, 35 Lamps, TV, Receiver, Laptop, 3 Ceiling Fans, 3 air coolers |
Base Load, 25 Lamps, TV, Receiver, Laptop |
|
8:00 pm |
20:00 |
Base Load, 3 ACs, 35 Lamps, TV, Receiver, Laptop |
Base Load, 35 Lamps, TV, Receiver, Laptop |
Base Load, 3 ACs, 45 Lamps, TV, Receiver, Laptop, 3 Ceiling Fans, 3 air coolers |
Base Load, 20 Lamps, TV, Receiver, Laptop |
|
9:00 pm |
21:00 |
Base Load, 3 ACs, 40 Lamps, TV, Receiver, Laptop |
Base Load, 30 Lamps, TV, Receiver, Laptop |
Base Load, 3 ACs, 30 Lamps, TV, Receiver, Laptop, 2 Air Coolers, 3 Ceiling Fans |
Base Load, 20 Lamps, TV, Receiver, Laptop |
|
10:00 pm |
22:00 |
Base Load, 3 ACs, 50 Lamps, TV, Receiver, Laptop |
Base Load, 45 Lamps, TV, Receiver, Laptop |
Base Load, 3 ACs, 35 Lamps, TV, Receiver, Laptop, 2 Air Coolers, 4 Ceiling Fans |
Base Load, 25 Lamps, TV, Receiver, Laptop |
|
11:00 pm |
23:00 |
Base Load, 3 ACs |
Base Load |
Base Load, 2 ACs, 3 Air Coolers, 4 Ceiling Fans |
Base Load |
Appendix B
Values of Hourly Electrical Loads for a typical household in Karak
Table 2. Details on the electrical load consumption in four seasons for a typical household in Karak
|
Time |
Season |
||||
|
(am/pm) |
(24 Hours) |
Winter |
Spring |
Summer |
Autumn |
|
12:00 am |
0:00 |
4,500 |
300 |
4,780 |
300 |
|
1:00 am |
1:00 |
4,500 |
300 |
4,780 |
300 |
|
2:00 am |
2:00 |
4,500 |
300 |
4,780 |
300 |
|
3:00 am |
3:00 |
4,500 |
300 |
4,780 |
300 |
|
4:00 am |
4:00 |
4,500 |
300 |
4,780 |
300 |
|
5:00 am |
5:00 |
4,500 |
300 |
4,780 |
300 |
|
6:00 am |
6:00 |
4,500 |
300 |
4,780 |
300 |
|
7:00 am |
7:00 |
4,710 |
475 |
4,850 |
475 |
|
8:00 am |
8:00 |
4,720 |
485 |
4,980 |
555 |
|
9:00 am |
9:00 |
4,720 |
520 |
3,665 |
485 |
|
10:00 am |
10:00 |
5,060 |
825 |
4,005 |
860 |
|
11:00 am |
11:00 |
5,190 |
990 |
2,625 |
990 |
|
12:00 pm |
12:00 |
4,640 |
405 |
4,970 |
440 |
|
1:00 pm |
13:00 |
4,640 |
440 |
4,910 |
475 |
|
2:00 pm |
14:00 |
4,640 |
405 |
5,055 |
510 |
|
3:00 pm |
15:00 |
4,605 |
440 |
3,770 |
475 |
|
4:00 pm |
16:00 |
4,755 |
590 |
3,590 |
590 |
|
5:00 pm |
17:00 |
4,875 |
605 |
5,220 |
605 |
|
6:00 pm |
18:00 |
4,790 |
590 |
3,790 |
520 |
|
7:00 pm |
19:00 |
4,840 |
640 |
3,805 |
605 |
|
8:00 pm |
20:00 |
4,875 |
675 |
5,275 |
570 |
|
9:00 pm |
21:00 |
4,910 |
640 |
5,110 |
570 |
|
10:00 pm |
22:00 |
4,980 |
745 |
5,195 |
605 |
|
11:00 pm |
23:00 |
4,500 |
300 |
3,480 |
300 |
Appendix C
Amounts of Hourly Electrical Loads for the 62,467 households in Karak (in kW)
Table 3. Details on the electrical load usage in four seasons for the 62,467 households in Karak (in kW)
|
Hour |
Month |
|||||||||||
|
January |
February |
March |
April |
May |
June |
July |
August |
September |
October |
November |
December |
|
|
0:00 |
281,102 |
281,102 |
18,740 |
18,740 |
18,740 |
298,592 |
298,592 |
298,592 |
18,740 |
18,740 |
18,740 |
281,102 |
|
1:00 |
281,102 |
281,102 |
18,740 |
18,740 |
18,740 |
298,592 |
298,592 |
298,592 |
18,740 |
18,740 |
18,740 |
281,102 |
|
2:00 |
281,102 |
281,102 |
18,740 |
18,740 |
18,740 |
298,592 |
298,592 |
298,592 |
18,740 |
18,740 |
18,740 |
281,102 |
|
3:00 |
281,102 |
281,102 |
18,740 |
18,740 |
18,740 |
298,592 |
298,592 |
298,592 |
18,740 |
18,740 |
18,740 |
281,102 |
|
4:00 |
281,102 |
281,102 |
18,740 |
18,740 |
18,740 |
298,592 |
298,592 |
298,592 |
18,740 |
18,740 |
18,740 |
281,102 |
|
5:00 |
281,102 |
281,102 |
18,740 |
18,740 |
18,740 |
298,592 |
298,592 |
298,592 |
18,740 |
18,740 |
18,740 |
281,102 |
|
6:00 |
281,102 |
281,102 |
18,740 |
18,740 |
18,740 |
298,592 |
298,592 |
298,592 |
18,740 |
18,740 |
18,740 |
281,102 |
|
7:00 |
294,220 |
294,220 |
29,672 |
29,672 |
29,672 |
302,965 |
302,965 |
302,965 |
29,672 |
29,672 |
29,672 |
294,220 |
|
8:00 |
294,844 |
294,844 |
30,296 |
30,296 |
30,296 |
311,086 |
311,086 |
311,086 |
34,669 |
34,669 |
34,669 |
294,844 |
|
9:00 |
294,844 |
294,844 |
32,483 |
32,483 |
32,483 |
228,942 |
228,942 |
228,942 |
30,296 |
30,296 |
30,296 |
294,844 |
|
10:00 |
316,083 |
316,083 |
51,535 |
51,535 |
51,535 |
250,180 |
250,180 |
250,180 |
53,722 |
53,722 |
53,722 |
316,083 |
|
11:00 |
324,204 |
324,204 |
61,842 |
61,842 |
61,842 |
163,976 |
163,976 |
163,976 |
61,842 |
61,842 |
61,842 |
324,204 |
|
12:00 |
289,847 |
289,847 |
25,299 |
25,299 |
25,299 |
310,461 |
310,461 |
310,461 |
27,485 |
27,485 |
27,485 |
289,847 |
|
13:00 |
289,847 |
289,847 |
27,485 |
27,485 |
27,485 |
306,713 |
306,713 |
306,713 |
29,672 |
29,672 |
29,672 |
289,847 |
|
14:00 |
289,847 |
289,847 |
25,299 |
25,299 |
25,299 |
315,771 |
315,771 |
315,771 |
31,858 |
31,858 |
31,858 |
289,847 |
|
15:00 |
287,661 |
287,661 |
27,485 |
27,485 |
27,485 |
235,501 |
235,501 |
235,501 |
29,672 |
29,672 |
29,672 |
287,661 |
|
16:00 |
297,031 |
297,031 |
36,856 |
36,856 |
36,856 |
224,257 |
224,257 |
224,257 |
36,856 |
36,856 |
36,856 |
297,031 |
|
17:00 |
304,527 |
304,527 |
37,793 |
37,793 |
37,793 |
326,078 |
326,078 |
326,078 |
37,793 |
37,793 |
37,793 |
304,527 |
|
18:00 |
299,217 |
299,217 |
36,856 |
36,856 |
36,856 |
236,750 |
236,750 |
236,750 |
32,483 |
32,483 |
32,483 |
299,217 |
|
19:00 |
302,340 |
302,340 |
39,979 |
39,979 |
39,979 |
237,687 |
237,687 |
237,687 |
37,793 |
37,793 |
37,793 |
302,340 |
|
20:00 |
304,527 |
304,527 |
42,165 |
42,165 |
42,165 |
329,513 |
329,513 |
329,513 |
35,606 |
35,606 |
35,606 |
304,527 |
|
21:00 |
306,713 |
306,713 |
39,979 |
39,979 |
39,979 |
319,206 |
319,206 |
319,206 |
35,606 |
35,606 |
35,606 |
306,713 |
|
22:00 |
311,086 |
311,086 |
46,538 |
46,538 |
46,538 |
324,516 |
324,516 |
324,516 |
37,793 |
37,793 |
37,793 |
311,086 |
|
23:00 |
281,102 |
281,102 |
18,740 |
18,740 |
18,740 |
217,385 |
217,385 |
217,385 |
18,740 |
18,740 |
18,740 |
281,102 |
[1] Siksnelyte-Butkiene, I., Zavadskas, E.K., Streimikiene, D. (2020). Multi-criteria decision-making (MCDM) for the assessment of renewable energy technologies in a household: A review. Energies, 13(5): 1164. https://doi.org/10.3390/en13051164
[2] Cakir, M., Cankaya, I., Garip, I., Colak, I. (2022). Advantages of using renewable energy sources in smart grids. In 2022 10th International Conference on Smart Grid (icSmartGrid), Istanbul, Turkey, pp. 436-439. https://doi.org/10.1109/icSmartGrid55722.2022.9848612
[3] Megía, P.J., Vizcaíno, A.J., Calles, J.A., Carrero, A. (2021). Hydrogen production technologies: From fossil fuels toward renewable sources. A mini review. Energy & Fuels, 35(20): 16403-16415. https://doi.org/10.1021/acs.energyfuels.1c02501
[4] Chien, F., Chau, K.Y., Sadiq, M. (2023). The effect of energy transition technologies on greenhouse gas emissions: New evidence from ASEAN countries. Sustainable Energy Technologies and Assessments, 58: 103354. https://doi.org/ 10.1016/j.seta.2023.103354
[5] Trinh, V.L., Chung, C.K. (2023). Renewable energy for SDG-7 and sustainable electrical production, integration, industrial application, and globalization: Review. Clean Engineering Technology, 15: 100657. https://doi.org/10.1016/j.clet.2023.100657
[6] Wang, H., Lei, Z., Zhang, X., Zhou, B., Peng, J. (2019). A review of deep learning for renewable energy forecasting. Energy Conversion Management, 198: 111799. https://doi.org/10.1016/j.enconman.2019.111799
[7] Mbungu, N.T., Naidoo, R.M., Bansal, R.C., Siti, M.W., Tungadio, D.H. (2020). An overview of renewable energy resources and grid integration for commercial building applications. Journal of Energy Storage, 29: 101385. https://doi.org/10.1016/j.est.2020.101385
[8] Tan, K.M., Babu, T.S., Ramachandaramurthy, V.K., Kasinathan, P., Solanki, S.G., Raveendran, S.K. (2021). Empowering smart grid: A comprehensive review of energy storage technology and application with renewable energy integration. Journal of Energy Storage, 39: 102591. https://doi.org/10.1016/j.est.2021.102591
[9] Ugwu, J., Odo, K.C., Ohanu, C.P., García, J., Georgious, R. (2022). Comprehensive review of renewable energy communication modeling for smart systems. Energies, 16(1): 409. https://doi.org/10.3390/en16010409
[10] Ahmad, T., Zhang, H., Yan, B. (2020). A review on renewable energy and electricity requirement forecasting models for smart grid and buildings. Sustainable Cities Society, 55: 102052. https://doi.org/10.1016/j.scs.2020.102052
[11] Jafarinejad, S., Beckingham, L.E., Kathe, M., Henderson, K. (2021). The renewable energy (RE) industry workforce needs: RE simulation and analysis tools teaching as an effective way to enhance undergraduate engineering students’ learning. Sustainability, 13(21): 11727. https://doi.org/10.3390/su132111727
[12] Silva, J.L.D.S., Costa, T.S., Melo, K.B.D., Sako, E.Y., Moreira, H.S., Villalva, M.G. (2020). A comparative performance of PV power simulation software with an installed PV plant. In 2020 IEEE International Conference on Industrial Technology (ICIT), Buenos Aires, Argentina, pp. 531-535. https://doi.org/10.1109/ICIT45562.2020.9067138
[13] González-Peña, D., García-Ruiz, I., Díez-Mediavilla, M., Dieste-Velasco, M.I., Alonso-Tristán, C. (2021). Photovoltaic prediction software: Evaluation with real data from northern Spain. Applied Sciences, 11(11): 5025. https://doi.org/10.3390/app11115025
[14] Milosavljević, D.D., Kevkić, T.S., Jovanović, S.J. (2022). Review and validation of photovoltaic solar simulation tools/software based on case study. Open Physics, 20(1): 431-451. https://doi.org/10.1515/phys-2022-0042
[15] Burduhos, B.G., Visa, I., Neagoe, M., Devetakovic, M., Cretescu, N.R. (2020). Comparative analysis of software accuracy in photovoltaic energy estimation for a temperate mountain climate. Solar Energy Conversion in Communities, 125-139. https://doi.org/10.1007/978-3-030-55757-7_9
[16] Bevanda, I., Betti, T., Maric, P., Marasovic, I. (2022). Evaluating the performance of photovoltaic simulation tools: Case study of grid-connected 31 kWp photovoltaic system. In 2022 7th International Conference on Smart and Sustainable Technologies (SpliTech), Split / Bol, Croatia, pp. 1-5. https://doi.org/10.23919/SpliTech55088.2022.9854237
[17] Reja, R.K., Amin, R., Tasneem, Z., Ali, M.F. M., Islam, R., Saha, D.K., Badal, F.R., Ahamed, M. H., Moyeen, S.I., Das, S.K. (2022). A review of the evaluation of urban wind resources: challenges and perspectives. Energy Building, 257: 111781. https://doi.org/10.1016/j.enbuild.2021.111781
[18] Balo, F., Yılmaz, U., Sua, L.S. (2021). Energy Efficiency and Sustainability Through Wind Power for Green Hospitals. Sustainable Engineering for Life Tomorrow, Maryland, UK: Lexington Books.
[19] Sharma, H., Mishra, S. (2019). Hybrid optimization model for smart grid distributed generation using HOMER. In 2019 3rd International Conference on Recent Developments in Control, Automation & Power Engineering (RDCAPE), Noida, India, pp. 94-99. https://doi.org/10.1109/RDCAPE47089.2019.8979121
[20] Islam, M.K., Akanto, J.M., Zeyad, M., Ahmed, S.M.M. (2021). Optimization of microgrid system for community electrification by using HOMER pro. In 2021 IEEE 9th Region 10 Humanitarian Technology Conference (R10-HTC), Bangalore, India, pp. 1-5. https://doi.org/10.1109/R10-HTC53172.2021.9641615
[21] Ribó-Pérez, D., Herraiz-Cañete, Á., Alfonso-Solar, D., Vargas-Salgado, C., Gómez-Navarro, T. (2021). Modelling biomass gasifiers in hybrid renewable energy microgrids; a complete procedure for enabling gasifiers simulation in HOMER. Renewable Energy, 174: 501-512. https://doi.org/10.1016/j.renene.2021.04.083
[22] Khalid, M.H., Shakir, S., Waqas, A., Liaquat, R., Janjua, A.K. (2023). Optimization of industrial hybrid renewable energy system using HOMER. In 2023 International Conference on Emerging Power Technologies (ICEPT), Topi, Pakistan, pp. 1-7. https://doi.org/10.1109/ICEPT58859.2023.10152347
[23] Chisale, S.W., Eliya, S., Taulo, J. (2023). Optimization and design of hybrid power system using HOMER pro and integrated CRITIC-PROMETHEE II approaches. Green Technologies and Sustainability, 1(1): 100005. https://doi.org/10.1016/j.grets.2022.100005
[24] Mokhi, C.E., Choukai, O., Hachimi, H., Ait Errouhi, A. (2023). Assessment and optimization of photovoltaic systems at the University Ibn Tofail according to the new law on renewable energy in Morocco using HOMER Pro. Energy Harvesting and Systems, 10(1): 55-69. https://doi.org/10.1515/ehs-2022-0035
[25] Khasawneh, H.J., Mustafa, M.B., Al-Salaymeh, A., Saidan, M. (2019). Techno-economic evaluation of on-grid battery energy storage system in Jordan using homer pro. In 2019 AEIT International Annual Conference (AEIT), Florence, Italy, pp. 1-6. https://doi.org/10.23919/AEIT.2019.8893416
[26] Azad, F.S., Ahmed, I., Hossain, S.R., Tuhin, R.A. (2019). HOMER optimized off-grid hybrid energy system: a case study on Rohingya relocation center in Bangladesh. In 2019 1st International Conference on Advances in Science, Engineering and Robotics Technology (ICASERT), Dhaka, Bangladesh, pp. 1-5. https://doi.org/10.1109/ICASERT.2019.8934534
[27] Uwineza, L., Kim, H.G., Kim, C.K. (2021). Feasibility study of integrating the renewable energy system in Popova Island using the Monte Carlo model and HOMER. Energy Strategy Reviews, 33: 100607. https://doi.org/10.1016/j.esr.2020.100607
[28] Abdin, Z., Mérida, W. (2019). Hybrid energy systems for off-grid power supply and hydrogen production based on renewable energy: A techno-economic analysis. Energy Convers Manag, 196: 1068-1079. https://doi.org/10.1016/j.enconman.2019.06.068
[29] Bošnjaković, M., Čikić, A., Zlatunić, B. (2021). Cost-benefit analysis of small-scale rooftop PV Systems: The case of Dragotin, Croatia. Applied Sciences, 11(19): 9318. https://doi.org/10.3390/app11199318
[30] Teo, Y.L., Go, Y.I. (2021). Techno-economic-environmental analysis of solar/hybrid/storage for vertical farming system: A case study, Malaysia. Renewable Energy Focus, 37: 50-67. https://doi.org/10.1016/j.ref.2021.02.005
[31] Jafarinejad, S., Beckingham, L.E., Kathe, M., Henderson, K. (2021). The renewable energy (RE) industry workforce needs: RE simulation and analysis tools teaching as an effective way to enhance undergraduate engineering students’ learning. Sustainability, 13(21): 11727. https://doi.org/10.3390/su132111727
[32] Agyekum, E.B., Ampah, J.D., Afrane, S., Adebayo, T.S., Agbozo, E. (2022). A 3E, hydrogen production, irrigation, and employment potential assessment of a hybrid energy system for tropical weather conditions – COMBINATION of HOMER software, Shannon entropy, and TOPSIS. International Journal of Hydrogen Energy, 47(73): 31073-31097. https://doi.org/10.1016/j.ijhydene.2022.07.049
[33] Rahmat, M.A.A., Hamid, A.S.A., Lu, Y., Ishak, M.A.A., Suheel, S.Z., Fazlizan, A., Ibrahim, A. (2022). An analysis of renewable energy technology integration investments in Malaysia using HOMER pro. Sustainability, 14(20): 13684. https://doi.org/10.3390/su142013684
[34] Sawle, Y., Jain, S., Babu, S., Nair, A.R., Khan, B. (2021). Prefeasibility economic and sensitivity assessment of hybrid renewable energy system. IEEE Access, 9: 28260-28271. https://doi.org/10.1109/ACCESS.2021.3058517
[35] Srivastava, R., Giri, V.K. (2016). Optimization of hybrid renewable resources using HOMER. International Journal of Renewable Energy Research, 6(1). https://doi.org/10.20508/ijrer.v6i1.3275.g6770
[36] Lilienthal, P. (2016). How the HOMER® pro software can improve the design and development of clean and sustainable energy projects. In Asia Clean Energy Forum, Manila, Philippines: HOMER, p. 12. https://asiacleanenergyforum.adb.org/wp-content/uploads/2016/03/Peter-Lilienthal-HOMER-Pro-Software.pdf.
[37] Department of Statistics. Overall Number of Jordanian Populations in 2022. Amman, 2023. Report. A PDF file. Source: The Jordanian Department of Statistics. https://dosweb.dos.gov.jo/population/population-2/.
[38] Nugroho, A. (2023). 200 Sqm Modern House Design 10×20 M 2Storey. https://www.andrewsloghomes.com/floor-plans, accessed on Aug. 8, 2023.
[39] Salehin, S., Ferdaous, M.T., Chowdhury, R.M., Shithi, S.S., Rofi, M.S.R.B., Mohammed, M.A. (2016). Assessment of renewable energy systems combining techno-economic optimization with energy scenario analysis. Energy, 112: 729-741. https://doi.org/10.1016/j.energy.2016.06.110
[40] Amupolo, A., Nambundunga, S., Chowdhury, D.S.P., Grün, G. (2022). Techno-economic feasibility of off-grid renewable energy electrification schemes: A case study of an informal settlement in Namibia. Energies (Basel), 15(12): 4235. https://doi.org/10.3390/en15124235
[41] Zebra, E.I.C., Windt, H.J.V.D., Nhumaio, G., Faaij, A.P.C. (2021). A review of hybrid renewable energy systems in mini-grids for off-grid electrification in developing countries. Renewable and Sustainable Energy Reviews, 144: 111036. https://doi.org/10.1016/j.rser.2021.111036
[42] Al-Ghussain, L., Ahmed, H., Haneef, F. (2018). Optimization of hybrid PV-wind system: Case study Al-Tafilah cement factory, Jordan. Sustainable Energy Technologies and Assessments, 30: 24-36. https://doi.org/10.1016/j.seta.2018.08.008
[43] Afif, R.A., Ayed, Y., Maaitah, O.N. (2023). Feasibility and optimal sizing analysis of hybrid renewable energy systems: A case study of Al-Karak, Jordan. Renew Energy, 204: 229-249. https://doi.org/10.1016/j.renene.2022.12.109
[44] Ahmad, J., Muhammad, I., Abdullah, K., Waseem, I., Rehan, A.S., Muhammad, A., Farooq, A.S., Siddique, K.K. (2018). Techno economic analysis of a wind-photovoltaic-biomass hybrid renewable energy system for rural electrification: A case study of Kallar Kahar. Energy, 148: 208-234. https://doi.org/10.1016/j.energy.2018.01.133
[45] Bataineh, A., Alqudah, A., Athamneh, A. (2014). Optimal design of hybrid power generation system to ensure reliable power supply to the health center at Umm Jamal, Mafraq, Jordan. Energy and Environment Research, 4(3): 9-20. https://doi.org/10.5539/eer.v4n3p9
[46] Thirunavukkarasu, M., Sawle, Y. (2020). Design, analysis and optimal sizing of standalone PV/diesel/battery hybrid energy system using HOMER. In IOP Conference Series: Materials Science and Engineering, 937: 012034. https://doi.org/10.1088/1757-899X/937/1/012034
[47] Al-Masri, H.M., Dawaghreh, O.M., Magableh, S.K. (2023). Optimal configuration of a large scale on-grid renewable energy systems with different design strategies. Journal of Cleaner Production, 414: 137572. https://doi.org/10.1016/j.jclepro.2023.137572
[48] Bataineh, A., Al-Mofleh, A. (2019). Using hybrid power generation to ensure the reliability of power system in Jordan. Benefits, 9(5): 29-36. https://doi.org/10.7176/JETP